arXiv:1406.4456v1 [hep-ex] 17 Jun 2014
EUROPEAN ORGANISATION FOR NUCLEAR RESEARCH (CERN)
CERN-PH-EP-2014-094
Submitted to: Physics Letters B
Search for
W Z
resonances in the fully leptonic channel using
pp
collisions at
√ s = 8 TeV
with the ATLAS detector
The ATLAS Collaboration
Abstract
A search for resonant
WZ
production in the
ℓνℓ
′ℓ
′(
ℓ, ℓ
′= e, µ
) decay channel using 20.3 fb
−1of
√
s = 8 TeV pp
collision data collected by the ATLAS experiment at LHC is presented. No significant
deviation from the Standard Model prediction is observed and upper limits on the production cross
sections of
WZ
resonances from an extended gauge model
W
′and from a simplified model of heavy
vector triplets are derived. A corresponding observed (expected) lower mass limit of 1.52 (1.49)
TeV
is
derived for the
W
′at the 95% confidence level.
c
Search for WZ resonances in the fully leptonic channel using pp collisions at
√
s = 8
TeV with the ATLAS detector
The ATLAS Collaboration
Abstract
A search for resonant WZ production in the ℓνℓ′ℓ′(ℓ, ℓ′ = e, µ) decay channel using 20.3 fb−1of √s = 8 TeV pp collision data
collected by the ATLAS experiment at LHC is presented. No significant deviation from the Standard Model prediction is observed and upper limits on the production cross sections of WZ resonances from an extended gauge model W′and from a simplified model
of heavy vector triplets are derived. A corresponding observed (expected) lower mass limit of 1.52 (1.49) TeV is derived for the W′
at the 95% confidence level.
1. Introduction
The search for diboson resonances is an essential comple-ment to the investigation of the source of electroweak sym-metry breaking. Despite the compatibility between the prop-erties of the newly discovered particle at the LHC [1–4] with those expected for the Standard Model (SM) Higgs boson, the naturalness problem associated with a light Higgs boson sug-gests that the SM is likely to be an effective theory valid only at low energies. Extensions of the SM, such as Grand Uni-fied Theories [5], Little Higgs models [6], Technicolor [7–10], more generic Composite Higgs models [11,12], or models of extra dimensions [13–15], predict diboson resonances at high masses.
This Letter presents a search for resonant WZ production in the fully leptonic decay channels WZ → ℓνℓ′ℓ′(ℓ, ℓ′ = e, µ)
using 20.3 fb−1 of pp collision data collected by the ATLAS
detector at a centre-of-mass energy of √s = 8 TeV. Four
pos-sible leptonic decay channels (eνee, eνµµ, µνee and µνµµ) are considered. To interpret the results, the extended gauge model (EGM) [16] with a spin-1 W′boson is used as a benchmark signal hypothesis. In this model, the couplings of the EGM W′ boson to the SM particles are identical to those of the W bo-son, except for its coupling to WZ, which is suppressed with respect to the SM WWZ triple gauge coupling by a factor of (mW/mW′)2 and entails a linear relationship between the
reso-nance width and mass. In other scenarios, such as for leptopho-bic W′bosons [17–19], the decay to a pair of gauge bosons can
be a dominant channel. A narrow W′resonance is predicted in
the EGM, with an intrinsic decay width that is negligible with respect to the experimental resolutions on the reconstructed WZ invariant mass. Possible interferences between signal and SM backgrounds are assumed to be small and are neglected. Under these assumptions, the final results presented here can be rein-terpreted in terms of any narrow spin-1 resonance for a given signal efficiency and acceptance.
A phenomenological Lagrangian for heavy vector triplets (HVT) [20] has recently been introduced, where the couplings
of the new fields to fermions and gauge bosons are defined in terms of parameters. By scanning these parameters the generic Lagrangian describes a large class of models. The triplet field, which mixes with the SM gauge bosons, couples to the fermionic current through the combination of parame-ters g2cF/gV and to the Higgs and vector bosons through gVcH,
where g is the S U(2)L gauge coupling, the parameter gV
rep-resents the coupling strength to vector bosons, and cF and cH
allow to modify the couplings and are expected to be close to unity in most specific models. Two benchmark models, pro-vided in Ref. [20], are used here as well. In Model A, weakly coupled vector resonances arise from an extension of the SM gauge group [21]. In Model B, the heavy vector triplet is pro-duced in a strongly coupled scenario, for example in a Compos-ite Higgs model [22]. In Model A, the branching fractions to fermions and gauge bosons are comparable, whereas for Model B, fermionic couplings are suppressed.
Direct searches for WZ resonances have been reported by several experiments. The ATLAS collaboration reported on searches for a W′resonance using approximately 1 fb−1of data
for the ℓνℓ′ℓ′channel and 4.7 fb−1of data for the ℓν j j
chan-nel, where j is a hadronic jet, both at √s = 7 TeV, and
ex-cluded an EGM W′boson with mass below 0.76 TeV [23] and 0.95 TeV [24] respectively. The advantage of the three-lepton
WZ final state over its partial or fully hadronic final state
coun-terparts is its better sensitivity at the lower end of the mass spec-trum due to its significantly smaller SM backgrounds and supe-rior mass resolution. The CMS collaboration analysed 5 fb−1of
data at √s = 7 TeV in the ℓνℓ′ℓ′channel, and EGM W′bosons
with masses below 1.143 TeV [25] were excluded.
2. The ATLAS detector
The ATLAS detector [26] consists of an inner tracking de-tector (ID), electromagnetic (EM) and hadronic calorimeters, and a muon spectrometer. The ID is immersed in a 2 T axial magnetic field, generated by a superconducting solenoid, and consists of a silicon pixel detector, a silicon microstrip detector,
and a transition radiation tracker. The ID provides a pseudora-pidity coverage of |η| < 2.5.1
The EM calorimeters are composed of interspersed lead and liquid argon, acting as absorber and active material respectively, with high granularity in both the barrel (|η| < 1.475) and end-cap up to the end of the tracker acceptance (1.375 < |η| < 2.5), and somewhat coarser granularity from |η| = 2.5 to 3.2. The hadronic calorimeter uses steel and scintillator tiles in the bar-rel region, while the endcaps use liquid argon as the active material and copper as an absorber. The muon spectrometer (MS) is based on three large superconducting air-core toroids arranged with an eight-fold azimuthal coil symmetry around the calorimeters. Three layers of precision tracking chambers, con-sisting of drift tubes and cathode strip chambers, enable pre-cise muon track measurements in the pseudorapidity range of
|η| < 2.7, and resistive-plate and thin-gap chambers provide
muon triggering capability in the range of |η| < 2.4.
3. Data and Monte Carlo modelling
The data analysed here were collected by the ATLAS de-tector at the LHC in pp collisions at √s = 8 TeV during the
2012 data-taking run. Events are selected using a combination (logical OR) of isolated and non-isolated single-lepton (e or µ) triggers. The pT thresholds are 24 GeV for isolated
single-lepton triggers and 60 (36) GeV for non-isolated single-e (µ) triggers. The requirement that three high-pTleptons are in the
final state gives a trigger efficiency above 99.5%. After data-quality requirements are applied, the total integrated luminosity is 20.3 fb−1with an uncertainty of 2.8% [27].
The baseline EGM W′ signals are generated with
PYTHIA 8.162 [28] and the MSTW2008LO [29] parton distri-bution function (PDF) set. The production cross section times branching fraction (with W → eν, µν, τν, where all τ decays are considered, and Z → ee, µµ) are scaled to their theoretical predictions at next-to-next-to-leading order (NNLO) using ZW-PROD [30], which are 1.43 pb for mW′ = 200 GeV, 4.12 fb for
mW′ = 1 TeV, and 0.08 fb for mW′ = 2 TeV. In the W → τν
component, only the leptonic τ decays enter the signal accep-tance, albeit slightly and only at high signal mass, whereas the
Z → ττ component is totally negligible. The intrinsic decay
widths of the EGM W′scale linearly with mW′at high mass and
are 5.5 GeV for mW′= 200 GeV, 36 GeV for mW′ = 1 TeV, and
72 GeV for mW′ = 2 TeV. These are significantly less than the
experimental resolutions, which have Gaussian widths of the order of 25 GeV for mW′ = 200 GeV, 100 GeV for mW′= 1 TeV,
and 180 GeV for mW′= 2 TeV. MC samples were produced for
the EGM W′signal from 200 GeV to 400 GeV at intervals of 50
1ATLAS uses a right-handed coordinate system with its origin at the
nom-inal interaction point (IP) in the centre of the detector and the z-axis along the beam pipe. The x-axis points from the IP to the centre of the LHC ring, and the
y-axis points upward. Cylindrical coordinates (r, φ) are used in the transverse
plane, φ being the azimuthal angle around the beam pipe. The pseudorapidity is defined in terms of the polar angle θ as η = − ln tan(θ/2). The separation be-tween final-state particles is defined as ∆R = p(∆η)2+ (∆φ)2. The transverse
momentum is denoted by pT.
GeV and from 400 GeV to 2 TeV at intervals of 200 GeV. An in-terpolation procedure is adopted to obtain the distributions for mass points between 200 GeV and 400 GeV with 25 GeV step size and from 400 GeV to 2 TeV with 50 GeV step size.
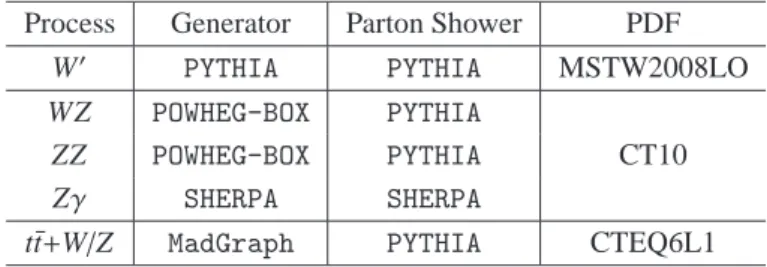
Table 1: Overview of the primary MC samples. The backgrounds from misidentified jets are estimated from the data.
Process Generator Parton Shower PDF
W′ PYTHIA PYTHIA MSTW2008LO
WZ POWHEG-BOX PYTHIA
ZZ POWHEG-BOX PYTHIA CT10
Zγ SHERPA SHERPA
t¯t+W/Z MadGraph PYTHIA CTEQ6L1
The dominant SM WZ background is modelled by
POWHEG-BOX [31], a next-to-leading-order (NLO) event gen-erator combined with the NLO CT10 PDF set [32]. Back-ground events arising from ZZ are modelled with POWHEG-BOX, while those from t¯t + W/Z processes are generated with
MadGraph 5.1.4.8 [33] together with the CTEQ6L1 [34] PDF set. All these events are interfaced with PYTHIA, using the AU2 tune [35] for parton showering.
A second category of background arises from photons misidentified as electrons, mainly from Zγ production. A pho-ton can be misreconstructed as an electron if it lies close to a charged particle track or if the photon converts to e+e− after interacting with the material in front of the calorimeter. This contribution is estimated using simulated Zγ MC events gener-ated with SHERPA 1.4.0 [36].
Finally, a third category of background includes all other sources where one or more jets are misidentified as an isolated lepton. The contributions from these fake backgrounds are es-timated using a data-driven method as described in Section6. The contribution from events with only one jet misidentified as an isolated lepton is found to be dominant while those with more than one are found to be negligible. Thus, in this analysis the fake backgrounds are denoted by ℓℓ′+jets.
An overview of the major MC samples used is presented in Table1.
Monte Carlo (MC) events are processed through the full de-tector simulation [37] using geant4 [38], and their reconstruc-tion is performed with the same software used to reconstruct data events. Correction factors for lepton reconstruction and identification efficiencies are applied to the simulation to ac-count for differences with respect to data. The simulated lep-ton four-momenta are tuned, via calorimeter energy scaling and momentum resolution smearing, to reproduce the distributions observed in data from leptonic W, Z and J/ψ decays after cal-ibration. Furthermore, additional inelastic pp collision events are overlaid with the hard scattering process in the MC simu-lation and then reweighted to reproduce the observed average number of interactions per bunch-crossing in data.
4. Object reconstruction
Electron candidates are reconstructed in the region of the EM calorimeter with |η| < 2.47 by matching the calorimeter clusters to the tracks in the ID. The transition region between the barrel and endcap calorimeters (1.37 < |η| < 1.52) is excluded. Can-didate electrons must satisfy the medium quality definition [39] re-optimized for 2012 data-taking conditions, which is based on a set of requirements on the calorimeter shower shape, track quality, and track matching with the calorimeter cluster. The longitudinal impact parameter z0 of the associated track with
respect to the primary vertex (PV), which is defined as the ver-tex with the largest sum of squared transverse momenta of as-sociated tracks, must satisfy |z0sin θ| < 0.5 mm. The
trans-verse impact parameter d0of the associated track must satisfy
|d0/σd0| < 6, where σd0 is the uncertainty on the
measure-ment of d0. To reduce the background due to jets
misidenti-fied as electrons, electron candidates are required to be isolated in both the calorimeter and the ID. The isolation requirements are Riso
Cal <0.16 and R iso
ID <0.16, where R iso
Calis the total
trans-verse energy recorded in the calorimeters within a cone of size
∆R = 0.3 around the lepton direction, excluding the energy of
the lepton itself, divided by the lepton ET, and RisoID is the sum
of the pT of the tracks in a cone of size ∆R = 0.3 around the
lepton direction, excluding the track of the lepton, divided by the lepton pT.
Muon candidates are reconstructed within the range |η| < 2.5 by combining tracks in the ID and the MS. Robust recon-struction is ensured by requiring a minimum number of hits in each of the sub-detectors of ID to be associated with the reconstructed ID tracks. Moreover, the muon reconstructed track must satisfy the requirements |z0sin θ| < 0.5 mm and
|d0/σd0| < 3.5. The measured momenta in the ID and the
MS are required to be consistent with each other by satisfy-ing |(q/p)ID
− (q/p)MS| < 5σ, where (q/p)IDand (q/p)MS are
the charge q over momentum p in the ID and the MS respec-tively, and σ is the total uncertainty on the difference between
q/p measurements in the ID and the MS. The muon isolation
requirements are Riso
Cal<0.2 and R iso ID <0.15.
When the Z boson has high momentum (& 600 GeV), its
collimated lepton decay products can be within a cone of size
∆R = 0.3. To maintain a high efficiency for high-mass signals
the isolation requirements imposed on the leptons are modi-fied to not include in the calculation of Riso
Cal and R iso ID the
en-ergy and momenta of any close-by same-flavour leptons. For a
mW′ = 1.4 TeV signal, the relative efficiency gain, with respect
to the selection without modifying the isolation requirements, is of the order of 60%. Finally, to reduce photon conversion backgrounds from muon radiation, if a muon and an electron are separated by less than ∆R = 0.1 from each other, the elec-tron candidate is discarded.
The missing transverse momentum, with magnitude Emiss T , is
the momentum imbalance in the transverse plane. The Emiss T is
calculated from the negative vector sum of the transverse mo-menta of all reconstructed objects, including muons, electrons, photons and jets, as well as clusters of calorimeter cells not as-sociated with these objects [40].
Attributing the EmissT to the transverse component of the neu-trino momentum, its longitudinal component (pνz) is derived by
requiring that the neutrino and the lepton attributed to the W boson decay have an invariant mass equal to the pole mass of the W boson: 80.385 GeV [41]. This constraint results in a quadratic equation with two solutions for pν
z. If the solutions
are real the one with the smaller absolute value is kept. If the solutions are complex only the real part is kept. In general, about 30% of the events are found to have complex solutions, mainly due to the Emiss
T resolution at the reconstruction level.
The invariant mass of the WZ → ℓνℓ′ℓ′system is reconstructed
from the four-vectors of the candidate W and Z bosons and is used as the discriminating variable for the signal.
5. Event selection
The PV of the event must have at least three associated tracks with pT > 0.4 GeV. Candidate WZ → ℓνℓ′ℓ′ events
are then required to have exactly three charged leptons with
pT>25 GeV and ETmiss>25 GeV. Events are rejected if a fourth
lepton is found with pT>20 GeV. At least one of the three
lep-tons is required to be geometrically matched to an object that fired the trigger. Two opposite-sign same-flavour leptons are required to have an invariant mass (mℓℓ) within 20 GeV of the Z
boson pole mass: 91.1875 GeV [42]. If two possibilities exist, the pair that has mℓℓclosest to the Z boson pole mass is chosen
to form the Z candidate. To suppress the Z+jets background where one jet is reconstructed as an isolated electron, the elec-trons used in the reconstruction of the W bosons are required to satisfy tighter identification criteria (tight) than those required for the leptons used in the reconstruction of Z boson decays (medium). These stricter criteria are described in Ref. [39].
To improve the sensitivity to resonant signals, events are fur-ther required to have ∆y(W, Z) < 1.5, where ∆y(W, Z) is the ra-pidity2difference between the W and Z bosons. This selection has an efficiency exceeding 82% for all W′masses and reaching 94% for mW′ = 200 GeV.
Finally, two signal regions are defined, one more sensitive for high-mass W′signals (m
W′ & 250 GeV) and the other one
for low-mass W′ signals (mW′ . 250 GeV). The high-mass
signal region (SRHM) is defined by the additional requirement
∆φ(ℓ, Emiss
T ) < 1.5, where ∆φ(ℓ, E miss
T ) is the azimuthal angle
between the lepton attibuted to the W candidate decay and the missing transverse momentum vector. Conversely, the low-mass signal region (SRLM) is required to have ∆φ(ℓ, EmissT ) >
1.5, which has high acceptance for low-mass signals.
6. Background estimations
The major backgrounds come from the SM WZ, ZZ and
t¯t + W/Z processes with at least three prompt leptons in the
final state. A control region dominated by SM WZ events (CRSMWZ) is defined to check the modelling of the MC
pre-dictions for these backgrounds. The selection criteria used for
2Rapidity is defined as y = (1/2) ln[(E + p
this region are similar to those for the signal regions except that the requirement on ∆y(W, Z) is reversed and the requirement on
∆φ(ℓ, Emiss
T ) is removed. The reversal of the ∆y(W, Z) selection
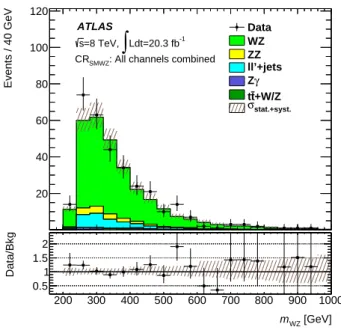
reduces possible signal contamination to negligible levels, as-suming previous exclusion results [23,25]. In total, 323 events are observed in data for all four channels combined and the SM backgrounds are expected to be 298 ± 4(stat.) ± 26(syst.) events, where the computation of the systematic uncertainties is detailed in Section7. Good agreement is also found between data and the SM predictions in the shapes of various kinemat-ical distributions. The mWZ distribution in the SM WZ control
region is shown in Fig.1.
200 300 400 500 600 700 800 900 1000 Events / 40 GeV 20 40 60 80 100 120 ATLAS -1 Ldt=20.3 fb
∫
=8 TeV, s: All channels combined
SMWZ CR Data WZ ZZ ll’+jets γ Z +W/Z t t stat.+syst. σ [GeV] WZ m 200 300 400 500 600 700 800 900 1000 Data/Bkg 0.5 1 1.5 2
Fig. 1: Distribution of WZ invariant mass (mWZ) in the SM WZ control re-gion (CRSMWZ) for the four ℓνℓ′ℓ′channels combined. The uncertainty bands
upon the expected background include both the statistical and systematic un-certainties in the MC simulation and the fake-background estimation added in quadrature.
Contributions from the ℓℓ′+jets background, where at least
one lepton originates from hadronic jets, are estimated using a data-driven method. A lepton-like jet is defined as a jet that is reconstructed as a lepton and satisfies all lepton selection cri-teria but, in the muon case, fails either the calorimeter or track isolation requirement, or, in the electron case, fails the isola-tion or medium quality requirement but passes a looser set of electron identification quality requirements. A “fake factor”, defined as the number of events in which a jet satisfies the nom-inal lepton selection criteria divided by the number of events in which a jet satisfies the lepton-like jet criteria, is computed. It can be interpreted as the probability that a lepton-like jet is in-stead reconstructed as a nominal lepton. The fake background is dominated by events with one jet misidentified as an isolated lepton, while contributions from other processes with two or three jets misidentified as isolated leptons are found to be neg-ligible. The fake background is thus estimated by applying the fake factor to a data sample (denoted as “tight+loose sample”) selected using all signal selection criteria except for a
require-ment that one of the three leptons must be a lepton-like jet. Since the electron identification and isolation requirements are different for those coming from a Z or a W candidate decay, the electron fake factor is calculated separately for these two cases. The lepton fake factor is measured in two different data sam-ples: dijet and Z+jets events. In both cases the tag-and-probe method [43,44] is used, but the tag objects are different. The larger number of events within the dijet sample permits a mea-surement of the dependence of the lepton fake factor on the lep-ton pTor η. Using the Z+jets sample, on the other hand, leads
to a measurement where the kinematic distributions and flavour compositions are closer to that of the signal region, albeit with significantly fewer events allowing only a measurement of the fake factor as a single number.
In the tight+loose sample and the two samples used for the fake-factor measurement, the backgrounds containing prompt leptons are estimated using MC simulation and subtracted from the data samples. These include the production of Z+jets simu-lated with ALPGEN 2.14 [45], t¯t with MC@NLO 4.03 [46], W+jets and Wγ with ALPGEN, as well as the previously mentioned WZ,
ZZ, Zγ, and t¯t + W/Z MC samples. The parton showering is
modelled by HERWIG/JIMMY [47,48] for Z+jets, t¯t, W+jets, and
Wγ events. The events remaining after subtraction are thus the
expected lepton yields due to misidentified jets.
The dijet sample is selected with one tag jet and one probe jet that are almost back-to-back, with ∆φ > 2.5. The tag jets are normal hadronic jets and the probe jet is required to satisfy the selection criteria for a lepton-like jet or a nominal lepton. The tag jets are reconstructed up to |η| = 4.5 from calorimeter clus-ters with the anti-kt algorithm [49] using a distance parameter
of 0.4 and are calibrated to the hadronic energy scale. They are required to have pT >25 GeV. For jets with pT <50 GeV and
|η| < 2.4, the scalar pT sum of the tracks that are associated
with the PV and that fall into the jet area must be at least 50% of the scalar pTsum of all tracks falling into the same jet area.
The dijet events are selected by single-muon and single-photon triggers, with pT and ET thresholds of 24 and 20 GeV in the
muon and electron cases respectively. The muon/electron re-quirements at the trigger level are looser than the lepton-like jet selection criteria in order to allow for an unbiased measurement of the lepton fake factor. To better mimic the kinematic proper-ties of the signal region, the Emiss
T is required to be higher than
25 GeV, which also helps reject the Z+jets background. The probe jet and the missing transverse momentum are required to have a transverse mass smaller than 40 GeV to suppress the
W+jets background. The probe jet is then examined to
deter-mine whether it satisfies the nominal lepton selection criteria or those of the lepton-like jet.
The Z+jets sample is defined as having one same-flavour opposite-charge lepton pair consistent with the Z boson decay as the tagged object, and a probe jet that satisfies the selec-tion criteria for a lepton-like jet or a nominal lepton. They are selected by a set of single-lepton and dilepton triggers to improve the trigger efficiency. To suppress the contribution from prompt leptons from WZ production, events are required to have Emiss
T <25 GeV. The probe jet is used for measuring the
In both the dijet and Z+jets samples, several sources of systematic uncertainty for the measurement of the fake fac-tors are considered, stemming from the trigger bias, kinematic and flavour differences with respect to the signal region, the
Emiss
T threshold requirement, and prompt-lepton subtraction.
In the dijet sample, possible biases related to the tag-jet pT
threshold, the transverse mass requirement on the probe jet and
Emiss
T system, and the azimuthal angle between the tag jet and
the probe jet are also considered. Likewise, additional biases associated with the measurement in the Z+jets sample, such as potential systematic kinematic differences between the low- and high-EmissT regions, are also considered. The total uncertainties on the fake factors measured using the dijet sample ranges from 8% to 33% for muons with pT < 50 GeV and electrons with pT <70 GeV. Beyond the above pTranges the fake factors are
assigned a& 100% systematic uncertainty due to the
subtrac-tion of prompt backgrounds. The total uncertainties on the fake factors measured using the Z+jets sample range from 27% to 36% for different lepton flavours and definitions. The uncer-tainties on the fake factors are applied to the fake-background estimate as normalization uncertainties.
The fake factors, which are of the order of 0.1 for both lepton flavours, are measured in both samples. The pT-binned central
values from the dijet sample measurement are the ones used in this analysis. The differences between the fake factors from the two samples can be up to ∼ 60% and are the dominant contri-butions to the fake-factor uncertainty.
The observed and predicted background event yields are compared in a ℓℓ′+jets-enriched control region (CRℓℓ′+jets)
where events are required to have the same lepton selection and Z mass requirement as in the nominal signal selection but with ETmiss less than 25 GeV and the transverse mass of the W candidate less than 25 GeV. In this region, a total of 204 events are observed in data with an SM expectation of 195 ± 4(stat.) ± 38(syst.) events. Good agreement is found between observed data and estimated background for various kinematic distributions. The Z candidate invariant mass distri-bution is shown in Fig.2.
7. Systematic uncertainties
Relative uncertainties on the expected yields of the dominant
WZ background and the EGM W′signal with mW′ = 1 TeV in
SRHMare shown in Table2. These uncertainties are
represen-tative of those found for other signal masses and background types. The lepton-related ones include uncertainties from the lepton trigger, identification, energy scale, energy resolution, isolation, and impact parameters. The uncertainties on the lep-ton momentum and jet energy scales and resolutions are prop-agated to the Emiss
T calculation. Other E miss
T -related
uncertain-ties include those on soft energy deposits due to additional pp collisions, and energy deposits not associated with any recon-structed object. Both the normalization and shape uncertainties are taken into account from the above sources.
Cross-section uncertainties for the dominant SM physics pro-cesses are computed via MCFM [50], which provides NLO QCD calculations for diboson production cross sections. The relative
70 80 90 100 110 120 Events / 2 GeV 10 20 30 40 50 60 70 80 90 ATLAS -1 Ldt=20.3 fb
∫
=8 TeV, s: All channels combined
ll’+jets CR Data WZ ZZ ll’+jets γ Z +W/Z t t stat.+syst. σ (ll) [GeV] m 70 80 90 100 110 120 Data/Bkg 0.5 1 1.5 2
Fig. 2: Z candidate invariant mass distribution in the ℓℓ′+jets background
con-trol region (CRℓℓ′+jets). The uncertainty bands upon the expected background
include both the statistical and systematic uncertainties in the MC simulation and the fake-background estimation added in quadrature.
uncertainty due to higher-order corrections to the WZ cross sec-tions is 5% [51]. The renormalization and factorization scales are varied by a factor of two relative to their nominal values. The resulting sum in quadrature of the uncertainties in SRHMon
the WZ, ZZ, and Zγ cross sections are found to be 6.9%, 4.3%, and 5.0% respectively. PDF uncertainties are derived by com-paring the predicted cross sections using the NLO CT10 and MSTW PDF as well as the CT10 eigenvector error PDF sets (90% confidence level). The resulting uncertainties are 4.1%, 4.7% and 3.2% for these three processes respectively.
Given that the SM background modelling suffers from low MC event counts in the tail of the mWZ distribution, an
extrap-olation method is devised to smooth the predicted yields. The method consists in performing two independent χ2fits, one on the WZ background in the region with mWZ > 500 GeV, and
a second on the sum of all non-WZ backgrounds in the re-gion with mWZ > 300 GeV, each with the power-law function
N(x) = c0xc1, where x is mWZ. The overall normalization of the
fitted function is set to the expected number of events for each of the two types of background. The non-WZ backgrounds are fitted jointly to gain from their combined size, thus reducing the total uncertainty in the fit, which is computed via the min-imization function’s Hessian error matrix. Other fitting tions such as an exponential or more elaborate power-law func-tions were tested, but their shapes were found to be within the uncertainties from the simple power-law function given above. Hence, only the uncertainties from the simple power-law func-tion are considered, and these dominate all other uncertainties in the range mWZ >800 GeV (e.g. the fit uncertainty reaches
50% of the total expected yields at mWZ = 800 GeV, and 400%
at mWZ = 1.6 TeV).
WZ process predicted by POWHEG-BOX and the multi-leg
gen-erators SHERPA and MadGraph, as well as NLO gengen-erators such as MC@NLO are compared. The largest deviations from the
POWHEG-BOX distribution are used as systematic uncertainties
on the predicted mWZ shape.
A procedure was developed to obtain the mWZ distribution
for any given mW′ mass point using a functional interpolation
between the available mWZ signal templates. These
distribu-tions are individually fitted with a crystal ball function using
RooFit [52]. The 4 crystal ball parameters are then each fitted as a function of the W′mass to build the mWZ template for any
intermediate W′ mass point. All systematic uncertainties are
individually interpolated.
Theoretical uncertainties on the EGM W′signal yields pri-marily come from uncertainties on the reconstructed signal’s acceptance times efficiency due to the PDF set used. The un-certainties in the signal acceptance due to the PDF are derived from the MSTW eigenvector error sets, and the difference be-tween the predictions of the CT10 and MSTW PDF sets, com-bined in quadrature.
8. Results
The mWZ spectrum in the two signal regions is scrutinized
for excesses of data over the predicted SM backgrounds. A to-tal of 449 WZ candidate events in SRHM are observed in the
data after applying all event selection criteria, to be compared with the SM prediction of 421 ± 5(stat.)+56−39(syst.) events. The
corresponding numbers in SRLMare 617 events selected in the
data and 563 ± 5(stat.)+55−43(syst.) events expected from SM
pro-cesses. The observed mWZ distribution in SRHMis compared to
the expected SM background distribution in Fig.3, which com-bines all four lepton decay channels. The contributions from hypothetical EGM W′ bosons with masses of 600, 1000, and
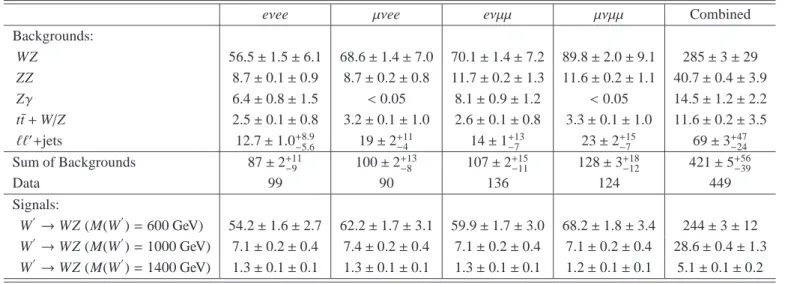
1400 GeV are also shown. A breakdown of the signal, back-grounds, and observed data yields in SRHMis shown in Table3
for each individual channel and also for all four channels com-bined. The mWZdistribution in SRLMis shown in Fig.4.
The mWZdistribution is used to build a binned log-likelihood
ratio (LLR) test statistic [53]. The systematic uncertainties are represented by nuisance parameters for both the back-grounds and signals. Confidence levels (CL) for the signal-plus-background hypothesis (CLs+b) and background-only
hy-pothesis (CLb) are computed by integrating the LLR
distribu-tions obtained from simulated pseudo-experiments using Pois-son statistics.
To check the consistency between the observed data and ex-pected SM backgrounds, the p-value, defined as 1 − CLb, for a
background fluctuation to give rise to an excess at least as large as that observed in data is computed. The obtained p-values are reported in Table 4for the signal hypothesis of a W′particle
with mass from 200 GeV to 2 TeV. The lowest local p-value probability is found to be 8% for the 375 GeV resonance mass hypothesis, equivalent to a 1.75σ local excess, indicating that no significant excess is observed.
In the modified frequentist approach [54], the 95% CL ex-cluded cross section is computed as the cross section for which
200 400 600 800 1000 1200 1400 1600 1800 Events / 40 GeV -1 10 1 10 2 10 3 10 ATLAS -1 Ldt=20.3 fb
∫
=8 TeV, s: All channels combined
HM SR Data W’(600 GeV) WZ W’(1000 GeV) Other bkg W’(1400 GeV) stat.+syst. σ [GeV] WZ m 200 400 600 800 1000 1200 1400 1600 1800 Data/Bkg 0.51 1.52 2.53
Fig. 3: Observed and predicted WZ invariant mass (mWZ) distribution for events in the high-mass signal region (SRHM). An extrapolation of the backgrounds to
the very-high-mass region was performed using a power-law function to fit for the SM WZ and the sum of all other backgrounds separately. Predictions from
W′samples with masses of 600 GeV, 1000 GeV and 1400 GeV are also shown, stacked on top of the expected backgrounds. The uncertainty bands upon the expected background include both the statistical and systematic uncertainties in the MC simulation and the fake-background estimation added in quadrature.
100 200 300 400 500 600 Events / 20 GeV 20 40 60 80 100 120 140 160 180 200 220 240 ATLAS -1 Ldt=20.3 fb
∫
=8 TeV, s: All channels combined
LM SR Data WZ ZZ ll’+jets γ Z +W/Z t t stat.+syst. σ 1/10 × W’(200 GeV) [GeV] WZ m 100 200 300 400 500 600 Data/Bkg 0.5 1 1.5 2
Fig. 4: Observed and predicted WZ invariant mass (mWZ) distribution for events in the low-mass signal region (SRLM). Predictions from a W′sample with mass
of 200 GeV are also shown. The W′curve is scaled by 1/10 for better display.
The uncertainty bands upon the expected background include both the statistical and systematic uncertainties in the MC simulation and the fake-background estimation added in quadrature.
Table 2: Relative uncertainties in the expected yields for the SM WZ background and the EGM W′signal with mW′= 1 TeV in the high-mass signal region (SRHM).
The renormalization and factorization scales, together with the PDF uncertainties on the fiducial cross section are included under theoretical uncertainty for SM
WZ background. For EGM W′signal, the theoretical uncertainty stands for the effects of the scale and PDF uncertainties, added in quadrature, on its acceptance.
Shape-related uncertainties are not included here. Similar results are found in the low-mass signal region (SRLM).
Uncertainty SM WZ EGM W′(m
W′ = 1 TeV)
sources eνee µνee eνµµ µνµµ eνee µνee eνµµ µνµµ
MC statistics 2.7% 2.0% 2.0% 2.2% 2.5% 2.5% 2.5% 2.5% Lepton-related 3.1% 1.8% 1.8% 1.9% 3.7% 2.6% 2.1% 2.4% Emiss T -related 2.8% 1.9% 2.6% 1.7% 1.1% 0.4% 0.4% 0.4% Luminosity 2.8% 2.8% 2.8% 2.8% 2.8% 2.8% 2.8% 2.8% Theory 9.5% 9.5% 9.5% 9.5% 0.6% 0.5% 0.2% 0.2%
Table 3: The estimated background yields, the observed number of data events, and the predicted signal yield for a set of W′resonance masses in the high-mass signal region (SRHM).
eνee µνee eνµµ µνµµ Combined Backgrounds: WZ 56.5 ± 1.5 ± 6.1 68.6 ± 1.4 ± 7.0 70.1 ± 1.4 ± 7.2 89.8 ± 2.0 ± 9.1 285 ± 3 ± 29 ZZ 8.7 ± 0.1 ± 0.9 8.7 ± 0.2 ± 0.8 11.7 ± 0.2 ± 1.3 11.6 ± 0.2 ± 1.1 40.7 ± 0.4 ± 3.9 Zγ 6.4 ± 0.8 ± 1.5 <0.05 8.1 ± 0.9 ± 1.2 <0.05 14.5 ± 1.2 ± 2.2 t¯t + W/Z 2.5 ± 0.1 ± 0.8 3.2 ± 0.1 ± 1.0 2.6 ± 0.1 ± 0.8 3.3 ± 0.1 ± 1.0 11.6 ± 0.2 ± 3.5 ℓℓ′+jets 12.7 ± 1.0+8.9−5.6 19 ± 2+11−4 14 ± 1+13−7 23 ± 2+15−7 69 ± 3+47−24 Sum of Backgrounds 87 ± 2+11 −9 100 ± 2 +13 −8 107 ± 2 +15 −11 128 ± 3 +18 −12 421 ± 5 +56 −39 Data 99 90 136 124 449 Signals: W′→ WZ (M(W′) = 600 GeV) 54.2 ± 1.6 ± 2.7 62.2 ± 1.7 ± 3.1 59.9 ± 1.7 ± 3.0 68.2 ± 1.8 ± 3.4 244 ± 3 ± 12 W′→ WZ (M(W′) = 1000 GeV) 7.1 ± 0.2 ± 0.4 7.4 ± 0.2 ± 0.4 7.1 ± 0.2 ± 0.4 7.1 ± 0.2 ± 0.4 28.6 ± 0.4 ± 1.3 W′→ WZ (M(W′) = 1400 GeV) 1.3 ± 0.1 ± 0.1 1.3 ± 0.1 ± 0.1 1.3 ± 0.1 ± 0.1 1.2 ± 0.1 ± 0.1 5.1 ± 0.1 ± 0.2
CLs, defined as the ratio CLs+b/CLb, is equal to 0.05. For the
mass points above 400 GeV, only the high-mass signal region is used in the calculation by statistically combining all lepton de-cay channels. For the mass points below or equal to 400 GeV, the two signal regions are further combined to maximize the sensitivity of the search.
Fig.5 presents the 95% CL upper limits on σ(pp → X) ×
B(X → WZ) as a function of the signal resonance mass, where
X stands for the signal resonance, together with the
theoreti-cal cross sections of the EGM W′and HVT benchmark
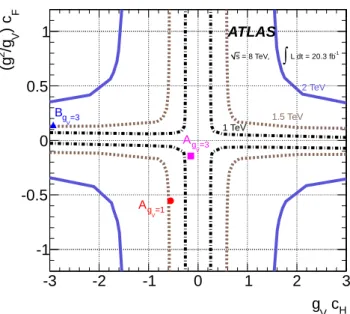
mod-els. The latter cross sections are calculated via the web in-terface [55] provided by the authors of Ref. [20]. The exclu-sion region in parameter space {(g2/gV)cF,gVcH} is shown in
Fig. 6. The fermion coupling cF was set to the same value
for quarks and leptons. The couplings cVVV, cVV HH and cVVW,
which involve vertices with more than one heavy vector boson and which have negligible effect on the cross section, were set to zero. Table4presents the expected and observed limits for a selected set of signal mass points as well as the EGM W′
signal acceptance A and correction factor C. The acceptance
A is defined as the number of generated events found within
the fiducial region at particle level divided by the total number of generated events, while C is defined as the number of re-constructed events passing the nominal selection requirements divided by the number of generated events within the fiducial region at particle level. The fiducial region selection criteria consist of the same kinematic selections (lepton pT, lepton η, Z boson mass, EmissT , ∆y(W, Z) and ∆φ(ℓ, ETmiss)) and lepton iso-lation requirements as in the nominal selections. Particle level refers to particle states that stem from the hard scatter, includ-ing those that are the product of hadronization, but before their interaction with the detector. Table5presents the 95% CL ex-pected and observed lower limits on the EGM W′boson mass
for each decay channel and their combination. The observed (expected) exclusion limit on the EGM W′ mass is found to
be 1.52 (1.49) TeV, and the limits in each channel are shown in Table 5. The simulated HVT resonances are found to have kinematic distributions similar to those of the W′and thus have
similar acceptances to the EGM model. The corresponding ob-served (expected) limits for the A(gV = 1), A(gV = 3), and
B(gV = 3) HVT resonances from Ref. [20] are 1.49 (1.45) TeV,
0.76 (0.69) TeV, and 1.56 (1.53) TeV respectively. In Fig.5, the HVT benchmark model curves are not shown for low resonance mass where the models do not apply.
Table 5: Expected and observed lower mass limits at 95% CL in TeV for the EGM W′ boson in the eνee, eνµµ, µνee, µνµµ channels as well as the four
channels combined.
Excluded EGM W′lower mass [TeV]
eνee µνee eνµµ µνµµ combined Expected 1.21 1.16 1.17 1.16 1.49 Observed 1.20 1.19 1.06 1.17 1.52 [GeV] m 200 400 600 800 1000 1200 1400 1600 1800 2000 WZ) [pb] → B(X × X) → (pp σ -2 10 -1 10 1 10 2 10 Expected 95% CL Limit σ 1 ± 95% CL σ 2 ± 95% CL Observed Limit EGM W’ HVT A(gv=1) HVT A(gv=3) HVT B(gv=3) ATLAS -1 Ldt = 20.3 fb
∫
=8 TeV, sFig. 5: The observed 95% CL upper limits on σ(pp → X) × B(X → WZ) as a function of the signal mass m, where X stands for the signal resonance. The expected limits are also shown together with the ±1 and ±2 standard devi-ation uncertainty bands. Both the expected and observed upper limits assume the EGM W′signal acceptance times efficiency as presented in Table4.
The-oretical cross sections for the EGM W′and the HVT benchmark models are
also shown. The uncertainty band around the EGM W′cross-section line
rep-resents the theoretical uncertainty on the NNLO cross-section calculation using ZWPROD [30]. H c V g -3 -2 -1 0 1 2 3 F ) c V /g 2 (g -1 -0.5 0 0.5 1 ATLAS -1 L dt = 20.3 fb
∫
= 8 TeV, s =1 V g A =3 V g A =3 V g B 1 TeV 1.5 TeV 2 TeVFig. 6: Observed 95% CL exclusion contours in the HVT parameter space {(g2/g
V)cF,gVcH} for resonances of mass 1 TeV, 1.5 TeV and 2 TeV. Also shown are the benchmark model parameters A(gV=1) (circle) and A(gV=3)
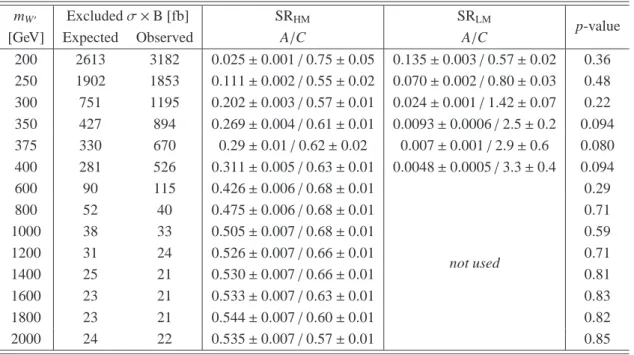
Table 4: The expected and observed 95% CL upper limits on the production cross section of narrow resonances decaying to WZ as a function of their mass. The high-mass signal region (SRHM) and low-mass signal region (SRLM) fiducial acceptances at particle level (A) and correction factors (C) for a EGM W′as
implemented inPYTHIA are also given. SRLMwas not used in setting the limits for the mass points beyond 400 GeV due to their very low acceptances. Errors
shown are statistical. The p-value, defined as 1 − CLb, is also shown for each mass point in the last column.
mW′ Excluded σ × B [fb] SRHM SRLM
p-value
[GeV] Expected Observed A/C A/C
200 2613 3182 0.025 ± 0.001 / 0.75 ± 0.05 0.135 ± 0.003 / 0.57 ± 0.02 0.36 250 1902 1853 0.111 ± 0.002 / 0.55 ± 0.02 0.070 ± 0.002 / 0.80 ± 0.03 0.48 300 751 1195 0.202 ± 0.003 / 0.57 ± 0.01 0.024 ± 0.001 / 1.42 ± 0.07 0.22 350 427 894 0.269 ± 0.004 / 0.61 ± 0.01 0.0093 ± 0.0006 / 2.5 ± 0.2 0.094 375 330 670 0.29 ± 0.01 / 0.62 ± 0.02 0.007 ± 0.001 / 2.9 ± 0.6 0.080 400 281 526 0.311 ± 0.005 / 0.63 ± 0.01 0.0048 ± 0.0005 / 3.3 ± 0.4 0.094 600 90 115 0.426 ± 0.006 / 0.68 ± 0.01 not used 0.29 800 52 40 0.475 ± 0.006 / 0.68 ± 0.01 0.71 1000 38 33 0.505 ± 0.007 / 0.68 ± 0.01 0.59 1200 31 24 0.526 ± 0.007 / 0.66 ± 0.01 0.71 1400 25 21 0.530 ± 0.007 / 0.66 ± 0.01 0.81 1600 23 21 0.533 ± 0.007 / 0.63 ± 0.01 0.83 1800 23 21 0.544 ± 0.007 / 0.60 ± 0.01 0.82 2000 24 22 0.535 ± 0.007 / 0.57 ± 0.01 0.85 9. Conclusion
A search for resonant WZ diboson production in the fully leptonic channel has been performed with the ATLAS detector, using 20.3 fb−1of pp collision data collected at √s = 8 TeV at
the LHC. No excess is found in data compared to the SM expec-tations. Stringent limits on the production cross section times
WZ branching ratio are obtained as a function of the resonance
mass for a W′ arising from an extended gauge model and de-caying to WZ. A corresponding observed (expected) mass limit of 1.52 (1.49) TeV is derived for the W′.
Acknowledgements
We thank CERN for the very successful operation of the LHC, as well as the support staff from our institutions without whom ATLAS could not be operated efficiently.
We acknowledge the support of ANPCyT, Argentina; Yer-PhI, Armenia; ARC, Australia; BMWF and FWF, Austria; ANAS, Azerbaijan; SSTC, Belarus; CNPq and FAPESP, Brazil; NSERC, NRC and CFI, Canada; CERN; CONICYT, Chile; CAS, MOST and NSFC, China; COLCIENCIAS, Colom-bia; MSMT CR, MPO CR and VSC CR, Czech Repub-lic; DNRF, DNSRC and Lundbeck Foundation, Denmark; EPLANET, ERC and NSRF, European Union; IN2P3-CNRS, CEA-DSM/IRFU, France; GNSF, Georgia; BMBF, DFG, HGF, MPG and AvH Foundation, Germany; GSRT and NSRF, Greece; ISF, MINERVA, GIF, I-CORE and Benoziyo Center, Israel; INFN, Italy; MEXT and JSPS, Japan; CNRST, Mo-rocco; FOM and NWO, Netherlands; BRF and RCN, Nor-way; MNiSW and NCN, Poland; GRICES and FCT, Portugal;
MNE/IFA, Romania; MES of Russia and ROSATOM, Russian Federation; JINR; MSTD, Serbia; MSSR, Slovakia; ARRS and MIZ ˇS, Slovenia; DST/NRF, South Africa; MINECO, Spain; SRC and Wallenberg Foundation, Sweden; SER, SNSF and Cantons of Bern and Geneva, Switzerland; NSC, Taiwan; TAEK, Turkey; STFC, the Royal Society and Leverhulme Trust, United Kingdom; DOE and NSF, United States of Amer-ica.
The crucial computing support from all WLCG partners is acknowledged gratefully, in particular from CERN and the ATLAS Tier-1 facilities at TRIUMF (Canada), NDGF (Den-mark, Norway, Sweden), CC-IN2P3 (France), KIT/GridKA (Germany), INFN-CNAF (Italy), NL-T1 (Netherlands), PIC (Spain), ASGC (Taiwan), RAL (UK) and BNL (USA) and in the Tier-2 facilities worldwide.
References
[1] Observation of a new particle in the search for the Standard Model Higgs boson with the ATLAS detector at the LHC, Phys. Lett. B716 (2012) 1– 29.arXiv:1207.7214,doi:10.1016/j.physletb.2012.08.020. [2] Observation of a new boson at a mass of 125 GeV with the CMS
exper-iment at the LHC, Phys. Lett. B716 (2012) 30–61. arXiv:1207.7235,
doi:10.1016/j.physletb.2012.08.021.
[3] Evidence for the spin-0 nature of the Higgs boson using ATLAS data, Phys. Lett. B726 (2013) 120–144. arXiv:1307.1432,
doi:10.1016/j.physletb.2013.08.026.
[4] Study of the Mass and Spin-Parity of the Higgs Boson Candidate Via Its Decays to Z Boson Pairs, Phys. Rev. Lett. 110 (2013) 081803.
arXiv:1212.6639,doi:10.1103/PhysRevLett.110.081803. [5] P. Langacker, R. W. Robinett, J. L. Rosner, New Heavy Gauge
Bosons in pp and p ¯p Collisions, Phys. Rev. D30 (1984) 1470.
doi:10.1103/PhysRevD.30.1470.
[6] N. Arkani-Hamed, A. G. Cohen, E. Katz, A. E. Nelson, The littlest Higgs, JHEP 07 (2002) 034.arXiv:hep-ph/0206021.
[7] K. Lane, S. Mrenna, The Collider phenomenology of technihadrons in the technicolor straw man model, Phys. Rev. D67 (2003) 115011.
arXiv:hep-ph/0210299,doi:10.1103/PhysRevD.67.115011. [8] E. Eichten, K. Lane, Low-scale technicolor at the Tevatron and
LHC, Phys. Lett. B669 (2008) 235–238. arXiv:0706.2339,
doi:10.1016/j.physletb.2008.09.047.
[9] F. Sannino, K. Tuominen, Orientifold theory dynamics and symmetry breaking, Phys. Rev. D71 (2005) 051901. arXiv:hep-ph/0405209,
doi:10.1103/PhysRevD.71.051901.
[10] A. Belyaev, et al., Technicolor Walks at the LHC, Phys. Rev. D79 (2009) 035006.arXiv:0809.0793,doi:10.1103/PhysRevD.79.035006. [11] K. Agashe, R. Contino, A. Pomarol, The Minimal composite Higgs
model, Nucl. Phys. B719 (2005) 165–187. arXiv:hep-ph/0412089,
doi:10.1016/j.nuclphysb.2005.04.035.
[12] G. Giudice, C. Grojean, A. Pomarol, R. Rattazzi, The Strongly-Interacting Light Higgs, JHEP 0706 (2007) 045.
arXiv:hep-ph/0703164,doi:10.1088/1126-6708/2007/06/045. [13] L. Randall, R. Sundrum, A large mass hierarchy from a small extra dimen-sion, Phys. Rev. Lett. 83 (1999) 3370–3373.arXiv:hep-ph/9905221,
doi:10.1103/PhysRevLett.83.3370.
[14] H. Davoudiasl, J. L. Hewett, T. G. Rizzo, Bulk gauge fields in the Randall-Sundrum model, Phys. Lett. B473 (2000) 43–49.
arXiv:hep-ph/9911262,doi:10.1016/S0370-2693(99)01430-6. [15] C. Csaki, C. Grojean, H. Murayama, L. Pilo, J. Terning, Gauge theories on an interval: Unitarity without a Higgs, Phys. Rev. D69 (2004) 055006.
arXiv:hep-ph/0305237,doi:10.1103/PhysRevD.69.055006. [16] G. Altarelli, B. Mele, M. Ruiz-Altaba, Searching for new Heavy
Vector Bosons in p ¯p Colliders, Z. Phys. C45 (1989) 109.
doi:10.1007/BF01556677.
[17] K. Babu, C. F. Kolda, J. March-Russell, Leptophobic U(1)’s and the R(b) - R(c) crisis, Phys. Rev. D54 (1996) 4635–4647.
arXiv:hep-ph/9603212,doi:10.1103/PhysRevD.54.4635. [18] T. G. Rizzo, Gauge kinetic mixing and leptophobic Z′ in E(6) and
SO(10), Phys. Rev. D59 (1999) 015020. arXiv:hep-ph/9806397,
doi:10.1103/PhysRevD.59.015020.
[19] J. Hewett, T. Rizzo, Dissecting the Wjj Anomaly: Diagnostic Tests of a Leptophobic Z’arXiv:1106.0294.
[20] D. Pappadopulo, A. Thamm, R. Torre, A. Wulzer, Heavy Vector Triplets: Bridging Theory and DataarXiv:1402.4431.
[21] V. D. Barger, W.-Y. Keung, E. Ma, A Gauge Model With Light W and Z Bosons, Phys.Rev. D22 (1980) 727.doi:10.1103/PhysRevD.22.727. [22] R. Contino, D. Marzocca, D. Pappadopulo, R. Rattazzi, On the effect of resonances in composite Higgs phenomenology, JHEP 1110 (2011) 081.
arXiv:1109.1570,doi:10.1007/JHEP10(2011)081.
[23] Search for resonant WZ production in the WZ → ℓνℓ′ℓ′channel in√s =
7 TeV pp collisions with the ATLAS detector, Phys. Rev. D85 (2012) 112012.arXiv:1204.1648,doi:10.1103/PhysRevD.85.112012. [24] Search for resonant diboson production in the lvjj decay channels with the
ATLAS detector, Phys. Rev. D87 (2013) 112006. arXiv:1305.0125,
doi:10.1103/PhysRevD.87.112006.
[25] Search for a W√ ′ or Techni-ρ Decaying into WZ in pp Collisions at
s = 7 TeV, Phys. Rev. Lett. 109 (2012) 141801. arXiv:1206.0433,
doi:10.1103/PhysRevLett.109.141801.
[26] ATLAS Collaboration, The ATLAS Experiment at the CERN Large Hadron Collider, JINST 3 (2008) S08003.
doi:10.1088/1748-0221/3/08/S08003.
[27] Improved luminosity determination in pp collisions at √s = 7 TeV
us-ing the ATLAS detector at the LHC, Eur. Phys. J. C73 (2013) 2518.
arXiv:1302.4393,doi:10.1140/epjc/s10052-013-2518-3. [28] T. Sjostrand, S. Mrenna, P. Z. Skands, A Brief Introduction to PYTHIA
8.1, Comput. Phys. Commun. 178 (2008) 852–867.arXiv:0710.3820,
doi:10.1016/j.cpc.2008.01.036.
[29] A. Martin, W. Stirling, R. Thorne, G. Watt, Parton distributions for the LHC, Eur. Phys. J. C63 (2009) 189–285. arXiv:0901.0002,
doi:10.1140/epjc/s10052-009-1072-5.
[30] R. Hamberg, W. van Neerven, T. Matsuura, A Complete calculation of the order α − s2correction to the Drell-Yan K factor, Nucl. Phys. B359 (1991) 343–405.doi:10.1016/0550-3213(91)90064-5.
[31] S. Alioli, P. Nason, C. Oleari, E. Re, A general framework for implementing NLO calculations in shower Monte Carlo programs: the POWHEG BOX, JHEP 1006 (2010) 043. arXiv:1002.2581,
doi:10.1007/JHEP06(2010)043.
[32] H.-L. Lai, M. Guzzi, J. Huston, Z. Li, P. M. Nadolsky, J. Pumplin, C.-P. Yuan, New parton distributions for collider physics, Phys. Rev. D82 (2010) 074024. arXiv:1007.2241,
doi:10.1103/PhysRevD.82.074024.
[33] J. Alwall, M. Herquet, F. Maltoni, O. Mattelaer, T. Stelzer, Mad-Graph 5 : Going Beyond, JHEP 1106 (2011) 128. arXiv:1106.0522,
doi:10.1007/JHEP06(2011)128.
[34] P. M. Nadolsky, H.-L. Lai, Q.-H. Cao, J. Huston, J. Pumplin, et al., Implications of CTEQ global analysis for collider ob-servables, Phys. Rev. D78 (2008) 013004. arXiv:0802.0007,
doi:10.1103/PhysRevD.78.013004.
[35] Summary of ATLAS Pythia 8 tunes, Tech. Rep. ATL– PHYS-PUB-2012-003, CERN, Geneva (Aug 2012).
[36] J. Archibald, et al., Simulation of photon-photon interactions in hadron collisions with SHERPA, Nucl. Phys. Proc. Suppl. 179-180 (2008) 218– 225.doi:10.1016/j.nuclphysbps.2008.07.027.
[37] The ATLAS Simulation Infrastructure, Eur. Phys. J. C70 (2010) 823–874.
arXiv:1005.4568,doi:10.1140/epjc/s10052-010-1429-9. [38] S. Agostinelli, et al., GEANT4: A Simulation toolkit, Nucl.Instrum.Meth.
A506 (2003) 250–303.doi:10.1016/S0168-9002(03)01368-8. [39] Electron reconstruction and identification efficiency measurements with
the ATLAS detector using the 2011 LHC proton-proton collision dataarXiv:1404.2240.
[40] Performance of Missing Transverse Momentum Reconstruc-tion in Proton-Proton Collisions at 7 TeV with ATLAS, Eur. Phys. J. C72 (2012) 1844. arXiv:1108.5602,
doi:10.1140/epjc/s10052-011-1844-6.
[41] T. Aaltonen, et al., Combination of CDF and D0 W-Boson Mass Mea-surements, Phys. Rev. D88 (5) (2013) 052018. arXiv:1307.7627,
doi:10.1103/PhysRevD.88.052018.
[42] S. Schael, et al., Precision electroweak measurements on the Z reso-nance, Phys. Rept. 427 (2006) 257–454. arXiv:hep-ex/0509008,
doi:10.1016/j.physrep.2005.12.006.
[43] T. Aaltonen, et al., First measurement of inclusive W and Z cross sections from Run II of the Fermilab Tevatron Collider, Phys. Rev. Lett. 94 (2005) 091803.arXiv:0406078,doi:10.1103/PhysRevLett.94.091803. [44] V. M. Abazov, et al., Measurement of the shape of the boson
rapid-ity distribution for p ¯p → Z/γ∗ → e+e− + X events produced at
√s of 1.96 TeV, Phys. Rev. D76 (2007) 012003. arXiv:0702025,
doi:10.1103/PhysRevD.76.012003.
[45] M. L. Mangano, M. Moretti, F. Piccinini, R. Pittau, A. D. Polosa, ALPGEN, a generator for hard multiparton processes in hadronic collisions, JHEP 0307 (2003) 001. arXiv:hep-ph/0206293,
doi:10.1088/1126-6708/2003/07/001.
[46] S. Frixione, B. R. Webber, Matching NLO QCD computations and parton shower simulations, JHEP 0206 (2002) 029. arXiv:hep-ph/0204244,
doi:10.1088/1126-6708/2002/06/029.
[47] G. Corcella, I. Knowles, G. Marchesini, S. Moretti, K. Oda-giri, et al., HERWIG 6: An Event generator for hadron emis-sion reactions with interfering gluons (including supersymmetric processes), JHEP 0101 (2001) 010. arXiv:hep-ph/0011363,
doi:10.1088/1126-6708/2001/01/010.
[48] J. Butterworth, J. R. Forshaw, M. Seymour, Multiparton interac-tions in photoproduction at HERA, Z. Phys. C72 (1996) 637–646.
arXiv:hep-ph/9601371,doi:10.1007/s002880050286.
[49] M. Cacciari, G. P. Salam, G. Soyez, The Anti-k(t) jet clus-tering algorithm, JHEP 0804 (2008) 063. arXiv:0802.1189,
doi:10.1088/1126-6708/2008/04/063.
[50] J. M. Campbell, R. K. Ellis, C. Williams, Vector boson pair pro-duction at the LHC, JHEP 1107 (2011) 018. arXiv:1105.0020,
doi:10.1007/JHEP07(2011)018.
[51] F. Campanario, S. Sapeta, WZ production beyond NLO for high-pT
observables, Phys. Lett. B718 (2012) 100–104. arXiv:1209.4595,
doi:10.1016/j.physletb.2012.10.013.
[52] W. Verkerke, D. P. Kirkby, The RooFit toolkit for data modeling, eConf C0303241 (2003) MOLT007.arXiv:physics/0306116.
[53] M. G. Kendall, A. Stuart, The Advanced Theory of Statistics, Charles Griffin and Company Limited, London, 1967.
[54] A. L. Read, Presentation of search results: The CL(s) technique, J. Phys. G28 (2002) 2693–2704.doi:10.1088/0954-3899/28/10/313.
[55] D. Pappadopulo, A. Thamm, R. Torre, A. Wulzer, http://rtorre.web.cern.ch/rtorre/Riccardotorre/vector triplet t.html.
The ATLAS Collaboration
G. Aad84, B. Abbott112, J. Abdallah152, S. Abdel Khalek116, O. Abdinov11, R. Aben106, B. Abi113, M. Abolins89,
O.S. AbouZeid159, H. Abramowicz154, H. Abreu153, R. Abreu30, Y. Abulaiti147a,147b, B.S. Acharya165a,165b,a, L. Adamczyk38a,
D.L. Adams25, J. Adelman177, S. Adomeit99, T. Adye130, T. Agatonovic-Jovin13a, J.A. Aguilar-Saavedra125a,125f, M. Agustoni17,
S.P. Ahlen22, F. Ahmadov64,b, G. Aielli134a,134b, H. Akerstedt147a,147b, T.P.A. Åkesson80, G. Akimoto156, A.V. Akimov95,
G.L. Alberghi20a,20b, J. Albert170, S. Albrand55, M.J. Alconada Verzini70, M. Aleksa30, I.N. Aleksandrov64, C. Alexa26a,
G. Alexander154, G. Alexandre49, T. Alexopoulos10, M. Alhroob165a,165c, G. Alimonti90a, L. Alio84, J. Alison31,
B.M.M. Allbrooke18, L.J. Allison71, P.P. Allport73, J. Almond83, A. Aloisio103a,103b, A. Alonso36, F. Alonso70, C. Alpigiani75,
A. Altheimer35, B. Alvarez Gonzalez89, M.G. Alviggi103a,103b, K. Amako65, Y. Amaral Coutinho24a, C. Amelung23, D. Amidei88,
S.P. Amor Dos Santos125a,125c, A. Amorim125a,125b, S. Amoroso48, N. Amram154, G. Amundsen23, C. Anastopoulos140, L.S. Ancu49, N. Andari30, T. Andeen35, C.F. Anders58b, G. Anders30, K.J. Anderson31, A. Andreazza90a,90b, V. Andrei58a, X.S. Anduaga70, S. Angelidakis9, I. Angelozzi106, P. Anger44, A. Angerami35, F. Anghinolfi30, A.V. Anisenkov108, N. Anjos125a, A. Annovi47, A. Antonaki9, M. Antonelli47, A. Antonov97, J. Antos145b, F. Anulli133a, M. Aoki65, L. Aperio Bella18, R. Apolle119,c, G. Arabidze89, I. Aracena144, Y. Arai65, J.P. Araque125a, A.T.H. Arce45, J-F. Arguin94, S. Argyropoulos42, M. Arik19a,
A.J. Armbruster30, O. Arnaez30, V. Arnal81, H. Arnold48, M. Arratia28, O. Arslan21, A. Artamonov96, G. Artoni23, S. Asai156, N. Asbah42, A. Ashkenazi154, B. Åsman147a,147b, L. Asquith6, K. Assamagan25, R. Astalos145a, M. Atkinson166, N.B. Atlay142,
B. Auerbach6, K. Augsten127, M. Aurousseau146b, G. Avolio30, G. Azuelos94,d, Y. Azuma156, M.A. Baak30, C. Bacci135a,135b,
H. Bachacou137, K. Bachas155, M. Backes30, M. Backhaus30, J. Backus Mayes144, E. Badescu26a, P. Bagiacchi133a,133b,
P. Bagnaia133a,133b, Y. Bai33a, T. Bain35, J.T. Baines130, O.K. Baker177, S. Baker77, P. Balek128, F. Balli137, E. Banas39,
Sw. Banerjee174, A.A.E. Bannoura176, V. Bansal170, H.S. Bansil18, L. Barak173, S.P. Baranov95, E.L. Barberio87, D. Barberis50a,50b,
M. Barbero84, T. Barillari100, M. Barisonzi176, T. Barklow144, N. Barlow28, B.M. Barnett130, R.M. Barnett15, Z. Barnovska5,
A. Baroncelli135a, G. Barone49, A.J. Barr119, F. Barreiro81, J. Barreiro Guimar˜aes da Costa57, R. Bartoldus144, A.E. Barton71,
P. Bartos145a, V. Bartsch150, A. Bassalat116, A. Basye166, R.L. Bates53, L. Batkova145a, J.R. Batley28, M. Battaglia138,
M. Battistin30, F. Bauer137, H.S. Bawa144,e, T. Beau79, P.H. Beauchemin162, R. Beccherle123a,123b, P. Bechtle21, H.P. Beck17,
K. Becker176, S. Becker99, M. Beckingham139, C. Becot116, A.J. Beddall19c, A. Beddall19c, S. Bedikian177, V.A. Bednyakov64,
C.P. Bee149, L.J. Beemster106, T.A. Beermann176, M. Begel25, K. Behr119, C. Belanger-Champagne86, P.J. Bell49, W.H. Bell49, G. Bella154, L. Bellagamba20a, A. Bellerive29, M. Bellomo85, K. Belotskiy97, O. Beltramello30, O. Benary154, D. Benchekroun136a, K. Bendtz147a,147b, N. Benekos166, Y. Benhammou154, E. Benhar Noccioli49, J.A. Benitez Garcia160b, D.P. Benjamin45,
J.R. Bensinger23, K. Benslama131, S. Bentvelsen106, D. Berge106, E. Bergeaas Kuutmann16, N. Berger5, F. Berghaus170,
E. Berglund106, J. Beringer15, C. Bernard22, P. Bernat77, C. Bernius78, F.U. Bernlochner170, T. Berry76, P. Berta128, C. Bertella84, G. Bertoli147a,147b, F. Bertolucci123a,123b, D. Bertsche112, M.I. Besana90a, G.J. Besjes105, O. Bessidskaia147a,147b, M.F. Bessner42, N. Besson137, C. Betancourt48, S. Bethke100, W. Bhimji46, R.M. Bianchi124, L. Bianchini23, M. Bianco30, O. Biebel99,
S.P. Bieniek77, K. Bierwagen54, J. Biesiada15, M. Biglietti135a, J. Bilbao De Mendizabal49, H. Bilokon47, M. Bindi54, S. Binet116,
A. Bingul19c, C. Bini133a,133b, C.W. Black151, J.E. Black144, K.M. Black22, D. Blackburn139, R.E. Blair6, J.-B. Blanchard137,
T. Blazek145a, I. Bloch42, C. Blocker23, W. Blum82,∗, U. Blumenschein54, G.J. Bobbink106, V.S. Bobrovnikov108, S.S. Bocchetta80,
A. Bocci45, C. Bock99, C.R. Boddy119, M. Boehler48, J. Boek176, T.T. Boek176, J.A. Bogaerts30, A.G. Bogdanchikov108,
A. Bogouch91,∗, C. Bohm147a, J. Bohm126, V. Boisvert76, T. Bold38a, V. Boldea26a, A.S. Boldyrev98, M. Bomben79, M. Bona75,
M. Boonekamp137, A. Borisov129, G. Borissov71, M. Borri83, S. Borroni42, J. Bortfeldt99, V. Bortolotto135a,135b, K. Bos106,
D. Boscherini20a, M. Bosman12, H. Boterenbrood106, J. Boudreau124, J. Bouffard2, E.V. Bouhova-Thacker71, D. Boumediene34,
C. Bourdarios116, N. Bousson113, S. Boutouil136d, A. Boveia31, J. Boyd30, I.R. Boyko64, I. Bozovic-Jelisavcic13b, J. Bracinik18,
A. Brandt8, G. Brandt15, O. Brandt58a, U. Bratzler157, B. Brau85, J.E. Brau115, H.M. Braun176,∗, S.F. Brazzale165a,165c, B. Brelier159,
K. Brendlinger121, A.J. Brennan87, R. Brenner167, S. Bressler173, K. Bristow146c, T.M. Bristow46, D. Britton53, F.M. Brochu28, I. Brock21, R. Brock89, C. Bromberg89, J. Bronner100, G. Brooijmans35, T. Brooks76, W.K. Brooks32b, J. Brosamer15, E. Brost115, G. Brown83, J. Brown55, P.A. Bruckman de Renstrom39, D. Bruncko145b, R. Bruneliere48, S. Brunet60, A. Bruni20a, G. Bruni20a, M. Bruschi20a, L. Bryngemark80, T. Buanes14, Q. Buat143, F. Bucci49, P. Buchholz142, R.M. Buckingham119, A.G. Buckley53,
S.I. Buda26a, I.A. Budagov64, F. Buehrer48, L. Bugge118, M.K. Bugge118, O. Bulekov97, A.C. Bundock73, H. Burckhart30,
S. Burdin73, B. Burghgrave107, S. Burke130, I. Burmeister43, E. Busato34, D. B¨uscher48, V. B¨uscher82, P. Bussey53,
C.P. Buszello167, B. Butler57, J.M. Butler22, A.I. Butt3, C.M. Buttar53, J.M. Butterworth77, P. Butti106, W. Buttinger28, A. Buzatu53,
M. Byszewski10, S. Cabrera Urb´an168, D. Caforio20a,20b, O. Cakir4a, P. Calafiura15, A. Calandri137, G. Calderini79, P. Calfayan99,
R. Calkins107, L.P. Caloba24a, D. Calvet34, S. Calvet34, R. Camacho Toro49, S. Camarda42, D. Cameron118, L.M. Caminada15,
R. Caminal Armadans12, S. Campana30, M. Campanelli77, A. Campoverde149, V. Canale103a,103b, A. Canepa160a, M. Cano Bret75,
J. Cantero81, R. Cantrill76, T. Cao40, M.D.M. Capeans Garrido30, I. Caprini26a, M. Caprini26a, M. Capua37a,37b, R. Caputo82,
R. Cardarelli134a, T. Carli30, G. Carlino103a, L. Carminati90a,90b, S. Caron105, E. Carquin32a, G.D. Carrillo-Montoya146c,
J.R. Carter28, J. Carvalho125a,125c, D. Casadei77, M.P. Casado12, M. Casolino12, E. Castaneda-Miranda146b, A. Castelli106,
V. Castillo Gimenez168, N.F. Castro125a, P. Catastini57, A. Catinaccio30, J.R. Catmore118, A. Cattai30, G. Cattani134a,134b,