EUROPEAN ORGANIZATION FOR NUCLEAR RESEARCH (CERN)
CERN-EP-2017-129 2017/10/11
CMS-SUS-16-049
Search for direct production of supersymmetric partners of
the top quark in the all-jets final state in proton-proton
collisions at
√
s
=
13 TeV
The CMS Collaboration
∗Abstract
A search for direct production of top squark pairs in events with jets and large trans-verse momentum imbalance is presented. The data are based on proton-proton colli-sions at a center-of-mass energy of 13 TeV, collected with the CMS detector in 2016 at
the CERN LHC, and correspond to an integrated luminosity of 35.9 fb−1. The search
considers a variety of R-parity conserving supersymmetric models, including ones for which the top squark and neutralino masses are nearly degenerate. Specialized jet reconstruction tools are developed to exploit the unique characteristics of the signal topologies. With no significant excess of events observed above the standard model expectations, upper limits are set on the direct top squark pair production cross sec-tion in the context of simplified supersymmetric models for various decay hypothe-ses. Models with larger differences in mass between the top squark and neutralino are probed for masses up to 1040 and 500 GeV, respectively, whereas models with a more compressed mass hierarchy are probed up to 660 and 610 GeV, respectively. The smallest mass difference probed is for masses near to 550 and 540 GeV, respectively.
Published in the Journal of High Energy Physics as doi:10.1007/JHEP10(2017)005.
c
2017 CERN for the benefit of the CMS Collaboration. CC-BY-3.0 license
∗See Appendix A for the list of collaboration members
1
1
Introduction
Although the standard model (SM) of particle physics provides a remarkably accurate descrip-tion of phenomena associated with the known elementary particles and their interacdescrip-tions, it leaves significant problems unresolved. It cannot, for instance, explain how the Higgs boson [1–6] can evade divergent quantum corrections, without very significant fine tuning [7, 8] of SM parameters, to allow it to have its mass at the weak scale [9–14]. Moreover, an abundance of cosmological observations, including the existence of dark matter, cannot be explained within the context of the SM alone [15–17].
Supersymmetry (SUSY) provides a theoretical framework that can address these questions. At its core, SUSY is a symmetry between fermions and bosons. In SUSY, a “sparticle” (generally referred to as a superpartner) is proposed for each SM particle with the same gauge quantum numbers but differing by one half-unit of spin and potentially in mass. The superpartners of the electroweak vector W and Z bosons and scalar Higgs boson mix to produce charged and
neutral fermions referred to as charginos (χe
±) and neutralinos (
e
χ0), respectively. For a given
fermion f, there are two superpartners corresponding to the fermion’s left- and right-handed
states. The superpartners mix to form two mass eigenstates, ef1and ef2, with ef1being the lighter
of the two. The quantum corrections to the value of the Higgs boson mass (mH) from sparticles
could cancel the otherwise problematic SM contributions. In this way, SUSY can protect the
value of mH [18–21], provided that the mass differences between the SM particles and their
superpartners are not too large. This is particularly important for superpartners of third gen-eration SM particles, because they have the largest couplings to the Higgs boson, and there-fore produce the largest corrections. Furthermore, a combination of precision measurements and null search results indicate that the superpartners of the light quarks may have very large masses [22]. In view of these considerations, the superpartners of the top and bottom quarks,
theet and eb squarks, respectively, are expected to be among the lightest sparticles, potentially
light enough to be produced at the CERN LHC [23]. An important point to note is that SUSY models with R-parity conservation [24, 25] require sparticles to be produced in pairs, with the lightest SUSY particle (LSP) therefore stable on cosmological time scales. This means that if the
lightest neutralino, denotedχe
0
1, is the LSP, then it is also a very promising dark matter
candi-date [26] that would remain at the end of all R-parity conserving sparticle cascade decays. The
two motivating principles above place the search for pair production of top squarks (etet) among
the highest priorities of the LHC program.
The most recent searches for directetet production were carried out by the ATLAS and CMS
Col-laborations in proton-proton (pp) collisions at center-of-mass energies√s of 7, 8, and 13 TeV at
the LHC [27–47]. The searches have provided no evidence for sparticle production in models
withet masses up to∼900 GeV andχe
0
1masses up to∼400 GeV.
This paper presents a search for directetet production in R-parity conserving SUSY using data
collected in pp collisions at√s =13 TeV by the CMS experiment at the LHC in 2016, and
cor-responding to an integrated luminosity of 35.9 fb−1. The search is based on methods presented
in Ref. [44], and represents an extension of that search to larger sparticle masses by means of a significantly larger dataset and the development of more sensitive search tools. This search focuses on all-hadronic final states, defined as those events whose visible content is made up solely of hadronic jets, as would be expected for signal processes in which all W bosons de-cay to quarks. These final states have the largest accessible branching fraction. In many SUSY
models, the favoredet decay modes depend strongly on the mass hierarchy of the sparticles. In
particular, different ranges of mass difference∆m between theet andχe
0
dif-2 1 Introduction
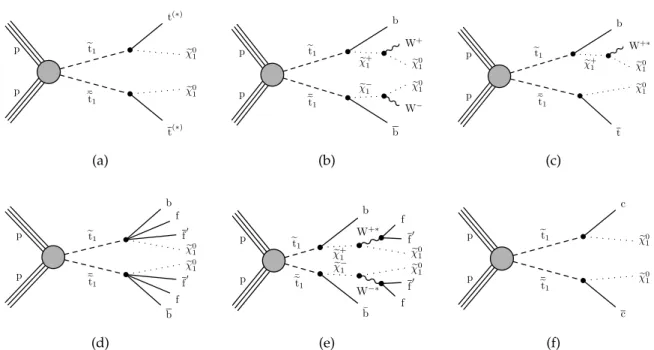
the basis for our searches are displayed in Fig. 1.
p p et1 et1 t(∗) e χ01 e χ01 t(∗) (a) p p et1 et1 e χ+1 e χ−1 b W− e χ01 e χ01 W+ b (b) p p et1 et1 e χ+1 t e χ01 e χ01 W+∗ b (c) p p et1 et1 b f f′ e χ01 e χ01 f′ f b (d) p p ¯ et1 et1 e χ−1 W−∗ e χ+1 W+∗ ¯ b f f′ e χ01 e χ01 f′ f b (e) p p et1 et1 c e χ01 e χ01 c (f)
Figure 1: Feynman diagrams for pair production of top squarks with the decay modes of the simplified models that are studied in this analysis. An asterisk indicates the particle may be produced off-shell.
The search regions (SR) are optimized for different models and ranges of ∆m. The simplest
decays that we consider areet1 → t(∗)χe 0 1, denoted “T2tt”, andet1 → bχe ± 1 → bW±χe 0 1, denoted
“T2bW”, under the assumption that the χe±1 mass lies halfway between theet1 and χe
0
1 masses.
The choice of moderate χe
±
1 mass in the latter model permits high momentum objects in the
final state. The χe ±
1 represents the lightest chargino, and χe
0
1 is the stable LSP, which escapes
detection to produce a large transverse momentum imbalance in the event. Another model, denoted “T2tb”, is considered under the assumption of equal branching fractions of the two aforementioned decay modes. This model, however, assumes a compressed mass spectrum in
which the mass of theχe
±
1 is only 5 GeV greater than that of theχe
0
1. As a result, the W bosons
from chargino decays are produced far off-shell.
In models with∆m less than the W boson mass mW, theet1 can decay through the T2tt decay
mode with shell t and W, through the same decay chain as in the T2bW model, via
off-shell W bosons, or decay through a flavor changing neutral current process (et1 → cχe
0
1, where
c is the charm quark). These will be referred to as the “T2ttC”, “T2bWC”, and “T2cc” models, respectively, where C denotes the hypothesis of a compressed mass spectrum in the first two
cases. Observations in such low ∆m models are experimentally challenging since the visible
decay products are typically very soft (low-momentum), and therefore often evade identifi-cation. Nevertheless, such models are particularly interesting because their dark matter relic density is predicted to be consistent with the cosmological observations [49]. Specialized jet reconstruction tools and event selection criteria are therefore developed to enhance sensitivity to these signals.
This paper is organized as follows. A brief description of the CMS detector is presented in Section 2, while Section 3 discusses the simulation of background and signal processes. Event reconstruction is presented in Section 4, followed by a description of the search strategy in Sec-tion 5. Methods employed to estimate the SM backgrounds and their corresponding systematic uncertainties are detailed in Sections 6 and 7, respectively. The discussion of the systematic
un-Figure 1: Diagrams for the decay modes of pair-produced top squarks studied in this analysis. The decay cascades are denoted: (a) T2tt, (b) T2bW, (c) T2tb, (d) T2ttC, (e) T2bWC, and (f) T2cc. An asterisk indicates that the particle may be produced off-shell.
ferent final-state signatures. Only the lightestet mass eigenstate,et1, is assumed to be involved
in the models considered in this paper, although the results are expected to be equivalent for
the heavier eigenstate. Theet1 decay modes of the simplified models [48–50] that are used as
the basis for our searches are displayed in Fig. 1.
The search regions (SR) are optimized for different models and ranges of∆m. In models with
∆m larger than the W boson mass mW(“high∆m models”), the simplest decays that we
con-sider areet1 → t(∗)χe 0 1, denoted “T2tt”, andet1 → bχe ± 1 → bW±χe 0
1, denoted “T2bW”, under the
assumption that theχe
±
1 mass lies halfway between theet1 andχe
0
1masses. The choice of
mod-erateχe
±
1 mass in the latter model permits high momentum objects in the final state. The χe
±
1
represents the lightest chargino, andχe
0
1 is the stable LSP, which escapes detection to produce
a large transverse momentum imbalance in the event. Another model, denoted “T2tb”, is con-sidered under the assumption of equal branching fractions of the two aforementioned decay modes. This model, however, assumes a compressed mass spectrum in which the mass of the
e
χ±1 is only 5 GeV greater than that of theχe
0
1. As a result, the W bosons from chargino decays
are produced far off-shell.
In models with∆m less than mW(“low∆m models”), theet1can decay through the T2tt decay
mode with shell t and W, through the same decay chain as in the T2bW model, via
off-shell W bosons, or decay through a flavor changing neutral current process (et1 → cχe01, where
c is the charm quark). These will be referred to as the “T2ttC”, “T2bWC”, and “T2cc” models, respectively, where C denotes the hypothesis of a compressed mass spectrum in the first two
cases. Observations in such low∆m models are experimentally challenging since the visible
decay products are typically very soft (low-momentum), and therefore often evade identifi-cation. Nevertheless, such models are particularly interesting because their dark matter relic density is predicted to be consistent with the cosmological observations [51]. Specialized jet reconstruction tools and event selection criteria are therefore developed to enhance sensitivity to these signals.
3
Section 2, while Section 3 discusses the simulation of background and signal processes. Event reconstruction is presented in Section 4, followed by a description of the search strategy in Sec-tion 5. Methods employed to estimate the SM backgrounds and their corresponding systematic uncertainties are detailed in Sections 6 and 7, respectively. The discussion of the systematic un-certainties assigned to the signal processes is also presented in Section 7. The results of the
search and their interpretation in the context of a variety of models ofet1production and decay
are presented in detail in Section 8, followed by a summary in Section 9.
2
The CMS detector
The central feature of the CMS apparatus is a superconducting solenoid of 6 m internal diame-ter, providing a magnetic field of 3.8 T. Within the solenoid volume are an all-silicon pixel and strip tracker, a lead tungstate crystal electromagnetic calorimeter (ECAL), and a brass and scin-tillator hadron calorimeter (HCAL), each composed of a barrel and two endcap sections. For-ward calorimeters extend the pseudorapidity (η) coverage provided by the barrel and endcap detectors. Muons are measured in gas-ionization detectors embedded in the steel flux-return yoke outside the solenoid. The first level of the CMS trigger system, composed of custom hard-ware processors, uses information from the calorimeters and muon detectors to select the most interesting events in a fixed time interval of less than 4 µs. The high-level trigger processor farm further decreases the event rate from around 100 kHz to around 1 kHz, before data storage. A more detailed description of the CMS detector, together with a definition of the coordinate system used and the relevant kinematic variables, can be found in Ref. [52].
3
Simulated events
Monte Carlo (MC) simulated events are used to study the important SM backgrounds, as well as to formulate the overall search for SUSY processes. Background processes composed uniquely of jets produced via the strong interaction of quantum chromodynamics (QCD) are referred to as “QCD multijet” processes. Simulated events originating from tt, W+jets, Z+jets,
γ+jets, and QCD multijet processes are generated using MADGRAPH5 aMC@NLO2.3.3 [53] at
leading order (LO) using the LO NNPDF3.0 [54] parton distribution functions (PDF). The WZ,
ZZ, ttZ, and ttW processes are generated using MADGRAPH5 AMC@NLO at next-to-leading
order (NLO), the single top quark process in the tW channel usingPOWHEG [55–58] and the
WW process is generated at NLO withPOWHEGv2.0 [59], all using the NLO NNPDF3.0 PDF. In
all of the aforementioned cases, parton showering and hadronization are simulated inPYTHIA
8.212 [60]. The potential for double counting of partons generated using PYTHIA with those
using MADGRAPH5 aMC@NLO is minimized using the MLM [61] and the FXFX [62]
match-ing schemes, in the LO and NLO samples, respectively. To evaluate systematic uncertainties associated with these aspects of event simulation, two additional tt samples are generated
us-ing POWHEG v2.0 [63], where one is interfaced with PYTHIA and the other with HERWIG++
v2.7.1 [64]. Additional QCD multijet samples are also generated, but interfaced with HER
-WIG++ for the modeling of parton showering and hadronization. Signal processes are
gener-ated at LO using MADGRAPH5 aMC@NLObased on the LO NNPDF3.0 PDF withPYTHIAused
for parton showering and hadronization. Signal production cross sections are calculated using NLO with next-to-leading logarithm (NLL) soft-gluon resummations (NLO+NLL) [65]. The most precise cross section calculations are used to normalize the SM simulated samples, cor-responding to next-to-next-to-leading order (NNLO) accuracy [66–69] in most cases. Finally,
reweighted (referred to as “top quark pT reweighting”) to account for effects due to missing
higher-order corrections in MC simulation, according to the results presented in Ref. [70].
A full GEANT4-based model [71] is used to simulate the response of the CMS detector to SM
background samples. The CMS fast simulation package [72] is used for signal samples after
verifying that it provides results that are consistent with those obtained from the full GEANT
4-based simulation. Event reconstruction is treated in the same manner for MC simulation as for data. A nominal distribution of multiple pp collisions in the same or neighboring bunch crossings (referred to as “pileup”) is used to overlay the simulated events. The events are then reweighted to match the pileup profile observed in the collected data.
4
Event reconstruction
Events are reconstructed using the CMS particle-flow (PF) algorithm [73], which combines in-formation from all detector subsystems to reconstruct the properties of the final-state parti-cles produced in the pp collisions. At least one reconstructed vertex is required; for multiple collision vertices from pileup interactions, the reconstructed vertex with the largest value of
summed physics-object p2T is taken to be the primary pp interaction vertex (PV). The physics
objects used in this context are the objects returned by a jet finding algorithm [74, 75] applied to all charged tracks associated with the vertex under consideration, plus the corresponding asso-ciated missing transverse momentum (the precise definition is given later in the text). Events affected by instrumental noise or reconstruction failures are identified through dedicated fil-ters and rejected. Reconstructed particles are identified as charged hadrons, neutral hadrons, electrons, muons, or photons, to constitute a list of PF candidates.
Our primary jet collection is produced by clustering the PF candidates originating from the PV
using the anti-kTalgorithm [74] with a distance parameter of 0.4. The jet energy is corrected for
the contribution from pileup based on the jet area method [76, 77]. Additional corrections to the jet energy scale are applied to compensate for nonuniform detector response [78]. Jets are
required to have pT≥20 GeV and be contained within the tracker volume of|η| ≤2.4.
Jets originating from the hadronization of bottom (b) quarks are identified, or “tagged”, through the combined secondary vertex (CSVv2) b tagging algorithm [79, 80]. The working point used provides an efficiency for the b tagging of jets originating from b quarks that varies from 60 to
75% depending on pT, whereas the misidentification rate for light quarks or gluons is∼1%, and
∼15% for charm quarks. A novel soft b tagging algorithm was developed for this analysis and
used to identify b quarks with pbT < 20 GeV (i.e. below the jet pTthreshold). The algorithm is
described in Section 4.4. Although the T2cc model involves charm quark jets in the final state, no dedicated c tagger was used in this analysis.
To estimate the pTimbalance in the event, the missing transverse momentum,~pTmiss, is defined
as the negative of the vectorial sum of the~pTof all PF candidates in the event. Its magnitude is
denoted pmiss
T . The jet energy scale corrections applied to the jets are propagated to~pTmiss.
Electrons are reconstructed by combining information from the inner tracker with energy depo-sitions in the ECAL [81]. Muons are reconstructed by combining tracks in the inner tracker and in the muon system [82]. Tracks associated with electrons or muons are required to originate from the PV, and a set of quality criteria is imposed to assure efficient identification [81, 82]. To suppress misidentification of charged hadrons as leptons, we require electrons and muons to
be isolated from jet activity within a pT-dependent cone size defined by a radius Rrelin the η-φ
5
scalar sum of the pT of the PF candidates within the cone divided by the lepton pT. Charged
PF candidates not originating from the PV, as well as PF candidates identified as electrons or
muons, are not considered in the sum. The cone size Rreldepends on the lepton pT:
Rrel= 0.2, pT <50 GeV, 10 GeV/pT, 50 ≤ pT <200 GeV, 0.05, pT ≥200 GeV. (1)
The decreasing cone radius at larger pTprovides high efficiency for the collimated decay
prod-ucts of highly Lorentz-boosted heavy objects [83]. The isolation sum Irelis corrected for
con-tributions of neutral particles originated from pileup interactions using an area-based esti-mate [77] of pileup energy deposition in the cone.
Photons are reconstructed from energy depositions in the ECAL using identification algorithms that utilize a collection of variables related to the spatial distribution of shower energy in the supercluster (a group of 5x5 ECAL crystals), the photon isolation, and the fraction of the en-ergy deposited in the HCAL behind the supercluster relative to the enen-ergy observed in the supercluster [84].
Tau lepton decays to hadrons, τh → (hadrons)ντ, are reconstructed starting from isolated
charged-hadron candidates with pT ≥ 10 GeV and|η| ≤ 2.4. If there are photons with pT ≥
0.5 GeV within a cone of R ≤ 0.2 around the charged hadron, the leading pT photon
momen-tum is vectorially added to that of the charged hadron candidate. In addition, we impose a
requirement on the transverse mass of the τh; for an object with transverse momentum~pT, the
transverse mass mTis defined as:
mT(~pT,~pTmiss) =
q
2pTpmissT (1−cos∆φ) , (2)
where∆φ is the difference in azimuthal angle between~pTand~pTmiss. We require the transverse
mass of the τh to be less than 100 GeV, consistent with the expectation from a τh emitted in a
W boson decay in a high-multiplicity jet environment. A multivariate boosted decision tree
(BDT) classifier [85] is trained to distinguish τh decay products from other charged hadrons.
Input variables include isolation sums within cones of several radii, R-distances from the τh
candidate to the nearest charged particle and to the axis of the jet in which it is contained, and the b tagging discriminant value of that jet.
Many of theet1 decay modes involve unique final-state signatures. In view of this,
reconstruc-tion tools have been developed to exploit these signatures while significantly suppressing the
SM background. Signal models with large∆m have decay chains involving on-shell top quarks
and W bosons. Identification of jets associated with the decays of top quarks and W bosons to quarks is an important component of the analysis, used to suppress most of the backgrounds in searches that target such signals. Because they exhibit a wide range of Lorentz boosts, we take different approaches in their reconstruction depending on whether they have large or small
pT; these are described in Sections 4.1 and 4.2, respectively. In contrast, the decay products in
models with small ∆m are very soft and often fail to be reconstructed through the standard
algorithms. We have therefore developed more effective algorithms for these cases that are described in Sections 4.3 and 4.4.
4.1 Identification of high-pTtop quarks and W bosons
The decay products of highly boosted top quarks with pT ≥ 400 GeV, or W bosons with
pT ≥ 200 GeV, are usually contained within a cone of radius R = 0.8 [86]. A collection of
“large-R jets”, which is distinct from, and possibly overlaps with, the collection of primary jets,
is used to reconstruct these boosted objects by means of the anti-kTclustering algorithm with a
distance parameter of 0.8. Additional information on jet substructure is obtained by recluster-ing the constituents of these jets through the Cambridge–Aachen algorithm [87]. The “modified mass drop tagger” algorithm [88], also known as the “soft drop” (SD) algorithm, with angular
exponent β = 0, soft cutoff threshold zcut ≤ 0.1, and characteristic radius R0 =0.8 [89], is
ap-plied to remove soft, wide-angle radiation from the jet. The performance of the SD algorithm does not depend on the algorithm used initially to reconstruct the large-R jets. Top quark and W boson candidates are selected from the collection of large-R jets after applying a loose pre-selection based on variables reconstructed using the SD algorithm. In our configuration, the SD algorithm identifies two hard subjets of the large-R jet by reversing the Cambridge–Aachen clustering history. The two hard substructures should correspond to the W boson and b quark jet, in the case of top quark candidates, or to two quark jets of a W boson decay, in the case of a W boson candidate. The top quark (W boson) candidates are required to have soft-drop
mass mSD ≥ 110 (50 ≤ mSD < 110) GeV, pT ≥ 400(200)GeV, |η| ≤ 2.4, and subjets with pT
≥20 GeV. These mSDrequirements incur minimal efficiency losses, and ensure that candidates
can only be tagged uniquely.
Two separate multivariate BDT are trained to identify candidates for the quark decays of highly boosted top quarks and W bosons. The identified objects are subsequently referred to as “merged” top quarks and W bosons, respectively. The input variables to the two BDT rely
on mSD, N-subjettiness ratios (τ3/τ2 and τ2/τ1) [90], observables related to quark-gluon
dis-crimination [91], the b tagging discriminant value, the relative difference in pT between each
of the two subjets within the large-R jet, and the mass of each subjet. The N-subjettiness
vari-able, τN, is a measure of the degree to which the jet originates from N subjets. The BDT are
trained in MC simulated samples using the Toolkit for Multivariate Data Analysis (TMVA) [92] to discriminate between “background” and “signal” large-R jets. The merged top quark BDT is trained using, for “signal”, candidates that are matched to generated quark decays of top quarks in simulated SUSY events. For the merged W boson BDT this procedure is repeated in simulated tt events. For the “background” we consider the remaining candidates that could not be matched. The efficiencies to identify matched top quarks and W bosons are shown in Fig. 2. The merged W boson tagging efficiency is determined using W bosons originating from
generated top quark decays; thus, the moderate drop at large pT can be largely attributed to
the merging of the top quark decay products, which reduces the effectiveness of the jet sub-structure variables. The misidentification rate for jets initiated by either gluons or light quarks
depends on the pTof the large-R jet and ranges from 1 to 4% and from 2 to 10% for merged top
quarks and W bosons, respectively.
The misidentification rates for these top quark and W boson taggers are measured in data using a sample of multijet events that is dominated by the QCD multijet process, selected with
an HTtrigger, where HT is defined as the scalar sum of the pTof the primary jets in the event.
We require the events to contain at least one large-R jet and HT ≥ 1 TeV. The misidentification
rate is measured as a function of the jet pT and η, and then compared to the expected rates in
simulation. Data-to-simulation ratios are found to deviate from unity by no more than 20%, and are used to correct results obtained with simulated event samples.
lep-4.2 Identification of intermediate-pTtop quarks 7 [GeV] top T Generated p 400 500 600 700 800 900 Efficiency 0 0.1 0.2 0.3 0.4 0.5 0.6 0.7 0.8
Merged top quarks
(13 TeV) CMS Simulation [GeV] W T Generated p 200 300 400 500 600 700 Efficiency 0 0.1 0.2 0.3 0.4 0.5 0.6 0.7 0.8 Merged W bosons (13 TeV) CMS Simulation
Figure 2: Efficiencies in MC simulation for identifying the quark decays of top quarks (left),
and W bosons (right), as a function of the pTof the generated top quarks or W bosons to which
they were matched.
ton+jets events dominated by the semileptonic tt process and selected using a single-muon
trig-ger. The muon is required to have pT ≥ 50 GeV and|η| ≤ 2.1. To suppress other backgrounds,
at least one b-tagged jet is required in the same hemisphere as the muon, and the large-R jet is required to be in the opposite hemisphere. Contributions from processes with no quark decays of top quarks or W bosons are corrected through misidentification correction factors applied before obtaining the tagging efficiencies. These observed efficiencies are compared to those es-timated in simulation, and simulation-to-data correction factors, typically ranging from 0.9 to
1.1, are extracted and applied to simulated events to account for any dependence on pT.
Sim-ulated signal events generated in the CMS fast simulation package are corrected in a similar
way for the differences in tagging performance relative to the full GEANT4-based simulations.
4.2 Identification of intermediate-pT top quarks
The decay products of moderately boosted top quarks are often resolved as three separate jets in the primary jet collection. To avoid overlap with merged top quarks and W bosons, we only
consider a “cleaned” subset of jets that are separated by a distance R > 0.8 from all of the
candidate merged objects. Three-jet “resolved” top quark candidates are formed by starting with a jet from the cleaned jet collection that is designated to be the b constituent jet. The two jets with highest b tagging discriminant values are the only eligible jets for this step. Two additional constituent jets are designated W constituent jets after being identified from all two-jet combinations in the cleaned collection, excluding the already designated b two-jet. The algorithm is repeated with the remaining b jet. To reduce the combinatorial background before making any stringent selections, we require the two W constituent jets to have invariant mass within
40 GeV of mW = 80 GeV and the combined three-jet system to have invariant mass within
80 GeV of the top quark mass mt=175 GeV. The three-jet systems that pass these requirements
are considered for possible tagging as resolved top quarks.
Resolved top quark tagging is carried out using a BDT trained on simulated tt events. It ex-ploits properties of each three-jet candidate, including masses, angular separations, and other kinematic properties of the constituents. Additional input variables are quark-gluon discrim-ination metrics [93], b tagging discriminant values, and charm quark versus light quark jet discrimination [94] for each of the three jets. The performance of the resolved top quark tagger
is shown in Fig. 3. The drop in efficiency at very high pT stems from the fact that top quark
decay products are kinematically more likely to be merged into single large-R jets. Correspond-ingly, the efficiency of the merged top quark tagger starts to become significant in this region, as seen in Fig. 2 (left).
[GeV] top T Generated p 100 200 300 400 500 600 Efficiency 0 0.1 0.2 0.3 0.4 0.5 0.6 0.7 0.8 0.9 1
Resolved top quarks
(13 TeV) CMS Simulation [GeV] T Candidate p 100 200 300 400 500 600 Misidentification rate 0 0.02 0.04 0.06 0.08 0.1 0.12 0.14 0.16 0.18
Resolved top quarks
(13 TeV) CMS
Simulation
Figure 3: Left: Efficiency in MC simulation to identify resolved top quark decays as a
func-tion of the pT of the generated top quark. Right: Misidentification rate in MC simulation as a
function of the pT of resolved top quarks, in a sample dominated by the QCD multijet process.
The performance of the resolved top quark tagger is evaluated using the same methodology as that described in Section 4.1. Simulation-to-data correction factors ranging from 1.00 to 1.15 are extracted and applied to simulated events to account for differences with data as a
function of pT. Simulated signal events generated in the CMS fast simulation package are
corrected in a similar way for differences in tagging performance relative to the full GEANT
4-based simulations.
4.3 Identification of initial-state radiation
In models with ∆m < mW, the LSP is much heavier than the other decay products, and the
event has relatively low pmissT . However, in cases where theet1et1 pair recoils against
high-pT initial-state radiation (ISR), the massive LSP can be either moderately or highly boosted,
and there can be relatively large values of pmissT . To take advantage of this possibility, we try to
identify an ISR jet candidate in the event. To this end, we use the set of large-R jets described in Section 4.1. The use of such jets improves ISR jet identification by capturing ISR gluon jets that may have undergone splitting to two or more jets that are distributed over a relatively large
solid angle. For events having such jets, the large-R jet with the largest value of pT ≥200 GeV
that fails the “loose” working point of the b tagging algorithm (characterized by a tagging
ef-ficiency of∼80%, and a misidentification rate of∼10% for light quarks and gluons, and∼40%
for charm quarks) is tagged as an ISR jet candidate. This ISR jet is then used in SR that are orthogonal to those that require top quark or W boson candidates.
4.4 Identification of low-pT b quarks
As previously noted, signal models with small∆m produce a large fraction of b quarks below
the jet pT threshold that subsequently fail to be included in the primary jet collection.
9
background. To this end, we identify soft b hadrons, not associated to jets, by means of a sec-ondary vertex (SV) reconstructed by the inclusive vertex finding algorithm [95]. Additional requirements for SV observables are used to suppress background from light-flavor hadrons and jets. These include the distance in the transverse plane between the SV and PV; the sig-nificance of this distance; its pointing angle, defined through the scalar product between the
distance vector and the~pSVdirection as cos(
−−−−−→
(PV, SV),~pSV), where~pSVis the total momentum
of the tracks associated with the SV; and the number of tracks associated with the SV. The
trans-verse momenta of the tracks associated with an SV are required to sum to pT < 20 GeV, and
be separated from any jets (including b-tagged jets) by R> 0.4. This definition leads to∼20%
efficiency to identify a b hadron in the pTrange from 10 to 20 GeV, for a misidentification rate
less than one percent. The soft b tagging efficiency in data is measured in a sample dominated
by tt events having an eµ pair, pmiss
T ≥50 GeV, a b-tagged jet, and no additional jets. The
pres-ence of an additional soft (pT < 20 GeV), nonisolated µ is used to estimate the fraction of soft
b quarks in data. The soft b tagging performance in simulation agrees with the performance in data within 16%. Simulated signal events produced in the CMS fast simulation package are
corrected for differences in soft b tagging relative to GEANT4-based simulations.
5
Search strategy
With the final-state signatures of the signals in mind, we select events collected with a pmiss
T
trig-ger and require pmissT ≥ 250 GeV offline. The SM backgrounds with intrinsic pmissT generated
through the leptonic decay of a W boson are significantly suppressed by rejecting events
con-taining isolated electrons or muons with pT ≥ 5 GeV,|η| ≤ 2.4, and Irel ≤ 0.1, or Irel ≤ 0.2,
respectively. The contribution from events in which a W boson decays to a τ lepton is
sup-pressed by rejecting events containing isolated τhcandidates.
In our “search sample”, defined by the above requirements, the dominant sources of SM
back-ground with intrinsic pmiss
T are tt, W+jets, and Z+jets, single top quark, and ttZ processes. The
contribution from tt and W+jets processes arises from events in which W bosons decay
lepton-ically to produce pmissT associated with an energetic neutrino, but the charged lepton either falls
outside of the kinematic acceptance, or, even more likely, may be misidentified as a jet after failing to be identified as a lepton. This background is collectively referred to as “lost lepton” background. Contributions arising from ttW and single top quark processes also enter this cat-egory at lower levels. The contributions from Z+jets and ttZ events arise when the Z boson
decays to neutrinos, thereby producing significant pmissT . Contributions from the QCD multijet
process enter the search sample in cases where severe mismeasurements of jet momenta (i.e., jets passing through dead regions, cracks, or transition regions of the detector) produce
sig-nificant artificial pmissT , or when neutrinos arise from leptonic decays of heavy-flavor hadrons
produced during jet fragmentation.
We define a total of 104 non-overlapping SR with two sets of disjoint baseline selection criteria
that are designed specifically for application in the high and low ∆m signals. Tables 1 and 2
summarize these criteria for the 51 high∆m SR and 53 low ∆m SR, respectively.
5.1 Strategy for high∆m models
Based on the final-state signatures of models with∆m > mW, we define a high ∆m baseline
selection that requires at least five jets in our primary jet collection (Nj ≥ 5), of which at least
one is b-tagged (Nb ≥ 1). Severely mismeasured high-pT jets in multijet events can lead to
event. We therefore add the requirement of separation in azimuthal angle between~pTmiss and
each of the four jets with largest pT,∆φ1234 ≥0.5, which greatly reduces the contribution from
this background. Events passing the high∆m baseline selection are then divided into multiple
non-overlapping SR, optimized for the kinematic properties of moderate to high ∆m signal
topologies.
In lepton+jets tt events, where most of the pmissT is due to the leptonic decay of a single W boson,
the transverse mass distribution of the neutrino and b quark from the same top quark decay has an endpoint at the mass of the top quark. To take advantage of this fact, we separate events
based on the value of the smallest b quark transverse mass in the event, mbT (see (2)). In case
there are more than two b-tagged jets, only the two jets with the highest b tagging discriminant
value are considered. The two resulting sets of events are the tt-depleted high-mb
T category
(with mbT ≥175 GeV), and the tt-enhanced low-mbTcategory (with mbT <175 GeV).
To target signals with moderate values of∆m that populate the low-mbTcategory, we require the
presence of at least one resolved top quark and Nj ≥7. The latter condition assures that a
sig-nal event would contain at least one radiated jet, providing a boost to the system and thereby
increasing the pmissT for better discrimination from backgrounds. The high-mbTcategory is
sub-divided into two categories: events that do not contain any top quark or W boson candidates
with the requirement Nj ≥ 7, and events that do contain top quark or W boson candidates, as
expected for models with larger values of∆m and highly boosted top quarks or W bosons. In
the latter case, we retain the baseline requirement of Nj ≥ 5 and define separate SR according
to the numbers of candidate merged top quarks (Nt), merged W bosons (NW), and resolved
top quarks (Nres). All these regions are further subdivided into SR according to the number of
b-tagged jets, Nb=1 or≥2, and different ranges of pmissT .
5.2 Strategy for low∆m models
The low ∆m baseline selection is most appropriate for models with ∆m < mW. To this end,
we select events that have at least two jets, no top quark or W boson candidates, and small mb
T
(<175 GeV) when there are b-tagged jets present. In addition, we require an ISR jet with pISR
T ≥
300 GeV,|η| ≤ 2.4, and|∆φ(jISR,~pTmiss)| ≥ 2, where the last requirement suppresses the QCD
multijet process. As discussed in Section 4.3, the requirement of an ISR jet provides sensitivity
to low ∆m signal topologies, in which intrinsic pmiss
T is generated by the decay ofet1et1 pairs
recoiling against ISR. To further suppress the QCD multijet process, we require|∆φ(j1,~pTmiss)| ≥
0.5,|∆φ(j2,3,~pTmiss)| ≥0.15, where j1, j2, j3are the three leading-pTjets. In addition, a measure of
significance in pmissT , defined as pmissT /√HT ≡ SE/T ≥ 10
√
GeV, is required to ensure that pmissT
can only arise from undetectable particles or very rare, extreme mismeasurements.
Events satisfying the above requirements are further subdivided into SR defined by Nb, the
number of identified secondary vertices NSV, pISRT , and pmissT . Events with Nb = 0, a category
used for very soft decay products, are further subdivided by ranges of Nj, 2 to 5 or ≥6, NSV,
and pmissT , after requiring very high pISRT to assure a substantial boost to final-state jets which,
in turn, enhances the effectiveness of soft b tagging by producing more significantly displaced
b hadron decays. The SR with Nb= NSV =0 provide sensitivity to the T2cc model. They may
also provide sensitivity to similar final states involving lighter quarks but we have not studied
these cases. Events with Nb ≥ 1 are subdivided according to the scalar sum of the pT of the
leading and subleading (if one is present) b-tagged jets, pbT, to take advantage of the softer b jet
11
Table 1: Summary of the 51 non-overlapping search regions that mainly target high∆m signal.
The high∆m baseline selection is Nj≥5, pmissT ≥250 GeV, no leptons, Nb≥1, and∆φ1234 ≥0.5.
mb
T <175 GeV
Nj Nt NW Nres Nb pmissT [GeV]
≥7 ≥0 ≥0 ≥1 1,≥2 250-300, 300-400, 400-500,≥500
mbT ≥175 GeV
Nj Nt NW Nres Nb pmissT [GeV]
≥7 0 0 0 1,≥2 250-350, 350-450, 450-550,≥550 ≥5 ≥1 0 0 1 550-650,≥650 0 0 ≥1 250-350, 350-450, 450-550, 550-650,≥650 ≥1 ≥1 0 ≥550 0 ≥1 ≥1 250-350, 350-450, 450-550,≥550 ≥5 1 0 0 ≥2 550-650,≥650 0 1 0 250-350, 350-450, 450-550, 550-650,≥650 0 0 1 250-350, 350-450, 450-550, 550-650,≥650 1 1 0 ≥550 0 1 1 250-350, 350-450, 450-550,≥550 1 0 1 250-350, 350-450,≥450 ≥2 0 0 ≥250 0 ≥2 0 ≥250 0 0 ≥2 ≥250
Table 2: Summary of the 53 non-overlapping search regions that mainly target low∆m signal.
The low∆m baseline selection is Nj ≥ 2, pmissT ≥ 250 GeV, no leptons, Nt = NW = Nres = 0,
mbT < 175 GeV (when applicable),|∆φ(j1,~pTmiss)| ≥ 0.5, |∆φ(j2,3,~pTmiss)| ≥0.15, and an ISR jet
with pISRT ≥300 GeV,|η| ≤2.4,|∆φ(jISR,~pTmiss)| ≥2, and SE/T ≥10
√
GeV.
Nj Nb NSV pISRT [GeV] pbT[GeV] pmissT [GeV]
2–5 0 0 ≥500 — 450–550, 550–650, 650–750,≥750 ≥6 0 450–550, 550–650, 650–750,≥750 2–5 ≥1 450–550, 550–650, 650–750,≥750 ≥6 ≥1 450–550, 550–650, 650–750,≥750 ≥2 1 0 300–500 20–40 300–400, 400–500, 500–600,≥600 0 300–500 40–70 300–400, 400–500, 500–600,≥600 0 ≥500 20–40 450–550, 550–650, 650–750,≥750 0 ≥500 40–70 450–550, 550–650, 650–750,≥750 ≥1 ≥300 20–40 300–400, 400–500,≥500 ≥2 ≥2 ≥0 300–500 40–80 300–400, 400–500,≥500 ≥2 300–500 80–140 300–400, 400–500,≥500 ≥7 300–500 ≥140 300–400, 400–500,≥500 ≥2 ≥500 40–80 450–550, 550–650,≥650 ≥2 ≥500 80–140 450–550, 550–650,≥650 ≥7 ≥300 ≥140 450–550, 550–650,≥650
6
Background estimation
The contribution of each SM background process to the search sample is estimated through measurements of dedicated control data events that are translated to predictions for event counts in the corresponding SR with the aid of simulation. The strategy makes use of methods
described in Ref. [44].
6.1 Estimation of the lost-lepton background
The lost-lepton (LL) background is estimated from a single-lepton control sample that is based
on a sample of events collected with the same pmiss
T trigger as the search sample. We create
a relatively pure single lepton sample (“1`”) by inverting the electron or muon veto
require-ments described in Section 5. More than 90% of the events in these samples contain a single lepton, while the remainder contain two or more leptons. Studies of simulated events indicate that event kinematic variables for different lepton flavors are sufficiently similar to provide a collective estimate of LL backgrounds from a single control sample. Potential contamination by
signal is suppressed by requiring mT(~pT(`),~pTmiss) < 100 GeV, consistent with the expectation
for a W boson decay. In events with more than one identified lepton, the one used in this cal-culation is selected randomly. The selection criteria applied to the single-lepton control sample are the same as those used in the search sample, with the exception of top quark and W boson multiplicity, as discussed below.
The LL estimation in each SR is based upon the event count in corresponding single-lepton control regions (CR). The count is translated to a prediction in the SR by means of a transfer factor obtained from simulation, as follows:
NpredLL =TFLLNdata(1`), (3)
where Ndata(1`)corresponds to the event count observed in the relevant single-lepton CR in
data, and the transfer factor, TFLL, translates Ndata(1`)to a background prediction in the SR,
NpredLL , and is defined as:
TFLL=
NMC(0`)
NMC(1`)
, (4)
where NMC(0`) and NMC(1`) are the LL yields found for simulated events in the search and
single-lepton samples, respectively, that include contributions from tt and W+jets events, as well as smaller contributions from single top quark and ttW processes.
To improve the statistical uncertainty of this background estimation, CR relevant to the high ∆m SR are combined for all top quark and W boson multiplicities in both data and simula-tion. The top quark and W boson tagger results for the simulated events are corrected by the simulation-to-data correction factors discussed in Section 4. Simulation is used to extrapolate these results to each SR with its particular top quark and W boson multiplicity. The selection efficiency for each of the other search variables is estimated directly from data in the single-lepton sample.
6.2 Estimation of the Z
(
νν)
backgroundAn important source of background in the search arises from events in which a Z boson,
pro-duced in association with jets, decays to neutrinos that carry away large pmissT . Two methods are
traditionally used [39, 41] to estimate this background. The first method uses an event sample
dominated by Z(``)+jets events, in which the Z bosons have kinematic properties very similar
to those in the search sample, after correcting for the difference in acceptance between charged lepton pairs and pairs of neutrinos. One drawback in this is that these events are statistically limited, especially in the stringently defined SR often used in SUSY searches. To overcome this limitation, the second method utilizes γ+jets events, in which the γ+jets process has similar LO
6.2 Estimation of theZ(νν)background 13
factor of five. To use this sample requires taking into account the differences in quark–boson couplings and the fact that the Z boson is very massive. Fortunately, these differences are
sub-stantially reduced for the high-pTbosons in this search.
Considering the pros and cons of the two methods led us to use a hybrid method to estimate the
Z(νν)background that makes use of both procedures. We use the Z(``)+jets sample to get the
normalization of the Z(νν)+jets background. This is done in different ranges of Nband NSVto
account for dependence on heavy-flavor production. Meanwhile, the γ+jets events are used to
correct the pmissT distributions of simulated events. The Z(``)sample is collected with dielectron
and dimuon triggers that require the leading electron (muon) to have pT ≥ 25 (20)GeV, and
the subleading electron (muon) to have pT ≥ 15(10)GeV. The leptons must have|η| ≤ 2.4 to
be within the acceptance of the tracker. The γ+jets events are collected with a single-photon
trigger and an offline selection of pT ≥ 200 GeV and |η| ≤ 2.5 for the leading photon. To
suppress potential contributions from signals and to avoid overlap with the search sample
we consider only the events with pmissT < 200 GeV. The transverse momentum of the boson,
as determined from the lepton pair or the photon, is added vectorially to~pTmiss to emulate
the kinematic properties of the Z(νν)+jets process. The modified pmissT , denoted by pmiss,T ``and
pmiss,γT for the Z(``)+jets and γ+jets processes, respectively, is used to calculate the relevant kinematic variables.
The prediction for the Z(νν)background in any particular SR is given by:
NZpred→νν = NZsim→νν RZSγ, (5)
where Nsim
Z→ννis the expected number of Z(νν)events in simulation, RZis the flavor-dependent
Z+jets normalization factor measured using the Z(``)events, and Sγis the correction factor for
the pmissT distribution as extracted from the γ+jets events in data.
The factor RZis calculated by comparing the observed and expected Z(``)yields after applying
the baseline selection criteria, with the exception of the requirements on the azimuthal angles
between jets and pmissT . The latter are omitted to retain more events and hence reduce the
statis-tical uncertainty in the RZestimation, after first confirming that this omission does not bias the
result. To increase the purity of the Z(``)sample, we require the dilepton invariant mass to lie
within the Z boson mass window of 80≤ M`` < 100 GeV. To probe similar phase space as in
the search sample, the pT of the dilepton system is required to be above 200 GeV. The
normal-ization of the nonnegligible tt contamination is estimated from the sidebands of the Z boson
mass window of 50 ≤ M`` < 80 and M`` ≥ 100 GeV. Small contributions from tZ, ttZ, WZ,
and ZZ production, estimated from simulation, are included in the Z(``)sample when
mea-suring RZ; whereas contributions from tW, ttW, and WW are included in the simulated sample
used to obtain the normalization factor for the tt contamination. To account for effects related
to heavy-flavor production, RZ is calculated separately for the Nband NSVrequirements used
in different SR. The RZvalues are consistent with unity. The uncertainty in RZ, ranging from
1 to 29%, comes mainly from the event counts in data and simulation after implementing the
selections, and is treated as a systematic uncertainty in the prediction of the Z(νν)background.
The correction factor Sγ is calculated in each of the search categories via a comparison of the
pmiss,γT distributions of γ+jets events in simulation and data. The event count from simulation
is first normalized to the number of events in data after applying the appropriate ∆m
base-line selections. The Sγ factor is estimated separately for each SR, to account for any potential
mismodeling of the search variables in simulation. As for the LL background estimation, good agreement between simulation and data for the performance of the top quark and W boson tag-gers provides a way for us to combine CR for all multiplicities of top quarks and W bosons to
calculate Sγ, thereby improving the statistical uncertainty of the result. We then use simulation
to extrapolate these results to each SR with its particular top quark and W boson multiplicity, after correcting events using the simulation-to-data correction factors discussed in Section 4. An underlying assumption of the hybrid estimation is that any differences between data and
simulation in the pmissT distributions for Z(νν)events should be compatible with those in the
pmiss,γT distributions for photon events. We checked this assumption by comparing the ratios
of data to simulation for the pmiss,T ``and pmiss,γT distributions of Z(``)+jets and γ+jets samples,
respectively. Residual differences in data and simulation can arise in the process of object re-construction or as a result of the absence of higher-order corrections in simulation. Observed
differences are included in the systematic uncertainties of the Z(νν)prediction.
6.3 Estimation of the QCD multijet background
The background originating from the QCD multijet process generally constitutes less than 10% of the total SM background in the SR. It is estimated using a control region in data, consisting of events collected with the same trigger as that used in the search. A sample dominated by the QCD multijet process is then obtained by requiring the azimuthal angle between any one
of the three leading jets and pmiss
T ,∆φ123, to be smaller than 0.1.
We again translate the observation in the control sample to a prediction in the search sample by means of transfer factors obtained from simulation. Each transfer factor is defined by the ratio between the number of simulated QCD multijet events satisfying the SR selection on the
azimuthal angles of the four leading jets and pmissT , to the number of simulated QCD
multi-jet events satisfying∆φ123 ≤ 0.1. Contributions from other SM processes to the QCD multijet
control sample are subtracted after normalizing the simulation to data in dedicated control samples. The estimation is made in each SR. To improve the statistical uncertainty of the
pre-diction, we combine the CR over Nt, NW, and Nres, in data and in simulation. In similarity with
the estimations of the LL and Z(νν) backgrounds, we extrapolate in top quark and W boson
multiplicity using simulation that is corrected for differences in the top quark and W boson
tagging performance with respect to data. In the low ∆m SR categories, we also combine
re-gions of pmissT in the QCD multijet control sample when yields are limited for the CR defined
by Nb≥ 1, and we assign an uncertainty for the combination based on the data-to-simulation
ratios observed in CR with Nb=0.
The dominant source of events originating from QCD multijet processes that populate the SR
is from the severe mismeasurement of the pTof one or more jets in the event, which translates
to large values of artificial pmissT . The level of mismeasurement can be parameterized via the
response variable rjet, defined as the ratio of the reconstructed pTof the most mismeasured jet
in the event to its generated pT, computed without including the loss of visible momentum
due to neutrinos. The most mismeasured jet is selected based on the jet with greatest absolute
difference between the reconstructed and generated pT. In data, we construct the observable
rpseudojet , defined as the ratio of the pT of a given jet to the magnitude of the vector sum of~pT
and the total~pTmiss of the event, which offers a measure of the true jet response. The jet closest
in φ to~pmiss
T is chosen for this calculation. Mismeasurement correction factors are extracted by
comparing the rpseudojet distributions in data and simulation. The correction factors are
parame-terized as functions of rjet and flavor of the most mismeasured jet. The corrections range from
4 to 82%, and are applied to the simulation on an event-by-event basis.
Due to the large production cross section of the QCD multijet process, samples of simulated QCD multijet events entering the stringently defined SR have limited statistics. To increase it,
6.4 Estimation of “rare” SM backgrounds 15
we use a method that lets each event from the original sample appear multiple times. To this
end, we use event “smearing”, whereby a “new” event is created by randomly assigning rjet
values to the leading two jets, ranked by their generated jet pT, and then recalculating all search
variables based on the “smeared” jets. The rjet values are sampled from inclusive rjet
distribu-tions binned in both generated jet pTand jet flavor in a region centered on the original rjetvalue.
Each original event is smeared 100 times, and the statistical uncertainty in evaluated quanti-ties is estimated through a bootstrapping procedure [96] that utilizes 50 pseudo-experiments. We assign a systematic uncertainty of 50% based on the measured difference in the
distribu-tion of the azimuthal angles between the leading jets and pmissT before and after smearing. This
accounts for any potential bias introduced in this method.
6.4 Estimation of “rare” SM backgrounds
Contributions from diboson (WW, WZ, and ZZ) processes are relatively small compared to the
other backgrounds discussed above, and mainly affect the SR in the low∆m analysis. We
there-fore estimate this background directly from simulation, with an uncertainty in the production cross section of 50% [97–99]. The ttZ contribution is also generally very small due to the rarity of this process. However, in SR requiring more than one top quark or W boson, this process can constitute a significant fraction of the total background due to the strong suppression of all other SM backgrounds. The ttZ simulation is validated using a three-lepton control sample, obtained using single-lepton triggers, requiring the presence of exactly three leptons (electrons
or muons) that satisfy pT ≥ 40 GeV for the leading lepton, pT ≥ 20 GeV for the second and
third lepton, and no additional lepton with pT ≥ 10 GeV. We further require at least five jets,
of which at least two are b-tagged. The same-flavor, opposite-sign lepton pair with the highest
dilepton pTis assumed to originate from Z boson decay. We require the presence of such a pair
with the invariant mass near the Z boson mass (80–100 GeV) and pT greater than 100 GeV to
probe boson kinematic properties similar to those in the search sample. The region outside the Z boson mass window is used to constrain the tt background. We find that yields in simulated ttZ agree with those observed in data. An uncertainty of 24% is assigned to the normalization of the ttZ background in the SR, based on the statistical uncertainty of the simulation-to-data correction factor obtained from this comparison. To assess any potential bias related to the
extrapolation from the Z boson pT (pT(Z)) range of the control sample to that of the search
sample, we evaluate the ttZ simulation-to-data correction factors with different requirements
on the reconstructed pT(Z), and find the pT-binned correction factors to be consistent with the
inclusive correction factor evaluated for pT ≥ 100 GeV. Theoretical uncertainties related to the
choice of PDF and renormalization (µR) and factorization (µF) scales are found to be up to 28%
in simulated events.
6.5 Validation of the background methods in data
The background estimation strategy is validated in a data control sample that is non-overlapping to the samples used in the search and in the background estimation described above. The
validation sample uses the same selection as the search sample, but focuses on low-pmissT
re-gions that are not utilized in the search. The requirement in high ∆m event categories of
mbT ≥175 GeV is also inverted when selecting events with at least two top quarks or W bosons
to increase the statistical power of the validation exercise. Potential signal contamination in the validation regions is negligible. Figure 4 shows the predicted backgrounds and the observed data in the validation regions. The selections defining each bin are summarized in Table 3. The SM prediction is consistent with the observed data, and no indication of a bias is found in the background estimation strategy.
Table 3: Summary of the validation region selections. The top part of the table (rows 0-14)
corresponds to regions for the low∆m selections, whereas the bottom part (rows 15-31)
corre-sponds to regions for the high∆m selections.
Region Selection pmissT [GeV]
0 Nb= 0, NSV= 0, pISRT ≥ 500 GeV, 2 ≤ Nj≤ 5 250–400
1 Nb= 0, NSV= 0, pISRT ≥ 500 GeV, Nj≥ 6 250–400
2 Nb= 0, NSV≥ 1, pISR
T ≥ 500 GeV, 2 ≤ Nj≤ 5 250–400
3 Nb= 0, NSV≥ 1, pISRT ≥ 500 GeV, Nj≥ 6 250–400
4 Nb= 1, NSV= 0, 300 ≤ pISRT < 500 GeV, pbT < 40 GeV 250–300
5 Nb= 1, NSV= 0, 300 ≤ pISRT < 500 GeV, 40 ≤ pbT < 70 GeV 250–300
6 Nb= 1, NSV= 0, pISRT ≥ 500 GeV, pbT< 40 GeV 250–400
7 Nb= 1, NSV= 0, pISRT ≥ 500 GeV, 40 ≤ pbT < 70 GeV 250–400
8 Nb= 1, NSV≥ 1, pbT < 40 GeV 250–300
9 Nb≥ 2, 300 ≤ pISRT < 500 GeV, pbT < 80 GeV 250–300
10 Nb≥ 2, 300 ≤ pISR
T < 500 GeV, 80 ≤ pbT < 140 GeV 250–300
11 Nb≥ 2, 300 ≤ pISRT < 500 GeV, pbT ≥ 140 GeV, Nj ≥ 7 250–300
12 Nb≥ 2, pISR
T ≥ 500 GeV, pbT < 80 GeV 250–400
13 Nb≥ 2, pISRT ≥ 500 GeV, 80 ≤ pbT < 140 GeV 250–400
14 Nb≥ 2, pISR T ≥ 500 GeV, pbT ≥ 140 GeV, Nj≥ 7 250–400 15 Nb= 1, mbT < 175 GeV, Nj ≥ 7, Nres≥ 1 200–250 16 Nb≥ 2, mbT < 175 GeV, Nj ≥ 7, Nres≥ 1 200–250 17 Nb= 1, Nj≥ 7, Nt = 0, Nres = 0, NW= 0 200–250 18 Nb≥ 2, Nj≥ 7, Nt = 0, Nres = 0, NW= 0 200–250 19 Nb= 1, Nt≥ 1, Nres = 0, NW= 0 200–450 20 Nb= 1, Nt= 0, Nres ≥ 1, NW= 0 200–250 21 Nb= 1, Nt≥ 1, Nres = 0, NW≥ 1 200–450 22 Nb= 1, Nt= 0, Nres ≥ 1, NW≥ 1 200–250 23 Nb≥ 2, Nt= 1, Nres = 0, NW= 0 200–450 24 Nb≥ 2, Nt= 0, Nres = 1, NW= 0 200–250 25 Nb≥ 2, Nt= 0, Nres = 0, NW= 1 200–250 26 Nb≥ 2, Nt= 1, Nres = 0, NW= 1 200–450 27 Nb≥ 2, Nt= 0, Nres = 1, NW= 1 200–250 28 Nb≥ 2, Nt= 1, Nres = 1, NW= 0 200–250
29 Nb≥ 2, Nt≥ 2, Nres = 0, NW= 0, mbT < 175 GeV or pmissT < 250 GeV ≥200
30 Nb≥ 2, Nt= 0, Nres ≥ 2, NW= 0, mbT < 175 GeV 200–250
17 Validation region 0 2 4 6 8 10 12 14 Events 1 − 10 1 10 2 10 3 10 4 10 5 10 6 10 (13 TeV) -1 35.9 fb CMS Observed Rare QCD multijet Z(νν) Lost lepton Bkg. uncertainty
Validation region 0 2 4 6 8 10 12 14 exp /N obs N 0 0.5 1 1.5 m ∆ Low Validation region 16 18 20 22 24 26 28 30 32 Events 1 − 10 1 10 2 10 3 10 4 10 5 10 6 10 (13 TeV) -1 35.9 fb CMS Observed Rare QCD multijet Z(νν) Lost lepton Bkg. uncertainty
Validation region 16 18 20 22 24 26 28 30 32 exp /N obs N 0 0.5 1 1.5 m ∆ High
Figure 4: Observed data and SM background predictions in the low-pmiss
T validation sample for
the low∆m (left) and high ∆m (right) selections. Ratios of the observed to SM predicted event
counts derived from control regions are shown in the lower panel of each plot. The shaded blue band represents the statistical uncertainty combined with the systematic uncertainty resulting from the top quark and W boson tagging correction factors on the background prediction.
7
Systematic uncertainties
As described in the preceding section, our strategy for estimating the background relies on translating event counts from data control regions to search regions by means of transfer fac-tors obtained from simulation. These transfer facfac-tors, as well as the signal predictions, are therefore sensitive to a variety of systematic uncertainties related to the modeling of the ex-perimental apparatus, particle kinematic properties, and theoretical models. We discuss the relevant sources of uncertainty below, and summarize their effects on the predictions in the SR in Table 4.
• Choosing the size of control samples in data and simulation can lead to statistical
limitations.
• Important systematic effects can arise from the dependence of the top quark and
W boson tagging performance on the modeling of the tt topology and showering of bottom quarks and partons from decays of W bosons to quarks. We assess a system-atic uncertainty in the modeling of the tt topology by comparing the tagging
efficien-cies in simulation between tt samples generated using POWHEG and MADGRAPH.
The relative effect on the tagging efficiencies ranges from 1 to 4%. Uncertainties related to the choice of scheme in parton showering are evaluated by comparing
the tagging and mistagging efficiencies in simulation between thePYTHIAandHER
-WIG++ shower models. Differences of 5 to 25% and 5 to 40% are seen for tagging and
misidentification, respectively. We also evaluate the impact of heavy flavor jet mul-tiplicity on the data control sample used to define the misidentification correction
factors by comparing the selection for Nb = 0 to the nominal selection of Nb ≥ 1.
The observed difference of 20% is assigned as a systematic uncertainty.
The statistical precision in the tagging correction factors of the top quarks and W bosons ranges from 1 to 25%. The definition of the generator-level matching scheme
used when applying the tagging correction factors, as well as top pT reweighting,
are found to have very small impact on the top quark and W boson tagging per-formance. The sources of uncertainty discussed in this paragraph are collectively referred to as the “remaining sources” in Table 4.
• In simulating rare background processes and signal, a 16% uncertainty is assessed to account for simulation-to-data differences in soft b tagging performance based on comparisons in control regions.
• Correction factors applied to simulation to account for differences in lepton selection
efficiency between data and simulation have associated systematic uncertainties re-lated to changes in the performance of the tracker over the data-taking period.
• Changes in µR and µFscales, PDF, and the strong coupling strength, αSimpact rare
background predictions more significantly than background estimation from control samples in data that often benefit from partial or full cancellation of these uncertain-ties. The effect of unknown higher-order effects on any predicted event count is
estimated by varying simultaneously µR and µF by a factor of two, as detailed in
Refs. [100, 101], and ranges from 1 to 10%. The uncertainty related to the choice of
PDF, including the uncertainty in αS, is obtained as the standard deviation in 100
variations of the NNPDF3.0 [54] PDF, and ranges from 1 to 28%. The PDF systemat-ics are evaluated only for background processes.
• A 2.5% uncertainty is assigned to the integrated luminosity measured by the CMS
experiment for the 2016 data-taking period [102], and affects the simulation-based prediction of rare SM background and signal processes.
• A variety of other sources of systematic uncertainties include the corrections for
b tagging performance, jet energy scale and resolution, which also affect the pmissT in
the event, and reweighting of events for pileup. These sources are generally of much smaller importance compared to the other sources.
The magnitude of the systematic uncertainties is typically small, except for the most stringently defined SR affected by larger statistical uncertainties in the correspond-ing data control samples. The background estimation strategy, which translates event counts from data control samples with kinematic properties very similar to the corresponding SR, benefits from partial or full cancellation of many of the above sources of systematic uncertainty.
8
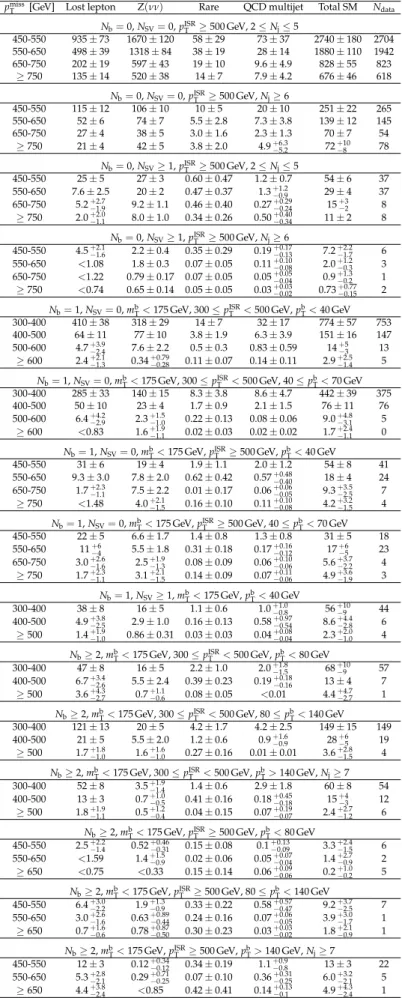
Results and interpretation
The event counts observed in data and those predicted for SM backgrounds are summarized graphically in Figs. 5-8, and numerically in Tables 5 and 6. The observed event counts are in general agreement with the predictions. The two search regions with most significant
discrep-ancies are the low∆m SR defined by the selection Nb ≥ 2, mbT < 175 GeV, pISRT ≥ 500 GeV,
pbT <80 GeV, pmissT ≥ 650 GeV, and the high∆m SR defined by Nb= 1, mbT ≥175 GeV, Nt ≥1,
Nres = 0, NW ≥ 1, pmissT ≥ 550 GeV. For these two SR, observed excesses over the predicted
event counts correspond to local significances of 2.3 and 1.9 standard deviations, respectively. These can be attributed to statistical fluctuations of the SM backgrounds alone, given the num-ber of search regions employed in this analysis.
The statistical interpretations of the results in terms of exclusion limits for signal models being considered in this analysis are based on a binned likelihood fit to the data, which takes into ac-count the predicted background and signal yields in the SR. The extraction of exclusion limits
is based on a modified frequentist approach using the CLscriterion [103, 104] under the
asymp-totic approximation for the test statistic [105, 106]. All of the SR, and their corresponding CR, are fitted simultaneously to determine the signal cross section excluded at a 95% confidence level (CL) for each signal point. Models for signal in which the 95% CL upper limit on the
pro-19
Table 4: Range of systematic uncertainties [%] in the prediction across the different search regions. “Rare” column includes diboson and ttZ processes. “Signal” column shows the range of systematic uncertainties representative of the full set of models shown in Fig. 1.
Source Lost lepton Z(νν) QCD multijet Rare Signal
e/µ veto 1–5 2–3 1–6 1–8 1–5
τhveto 1–7 2–3 1–7 1–7 1–8
b tagging: heavy flavor 1–4 1–5 1–14 1–6 1–10
b tagging: light flavor 1–7 1–15 1–16 1–8 1–20
Soft b tagging — — — 1–16 1–16
Jet energy scale 1–30 1–25 1–6 1–31 1–35
pmiss T resolution 1–13 1–18 1–5 1–30 1–48 tt normalization 1–8 — — — — W+jets normalization 1–11 — — — — Top quark pT 1–24 — — — — Sample size (MC) 1–100 1–100 2–100 4–100 2–100
Sample size (data CR) 2–100 1–100 3–100 — —
RZ — 1–29 — — —
Z/γ difference — 1–23 — — —
Background subtraction — — 13–71 — —
Jet response tail — — 1–14 — —
pmiss T integration — — 1–51 — — Smearing closure — — 50 — — Pileup reweighting 1–12 1–12 1–12 1–16 1–15 Integrated luminosity — — — 2.5 2.5 Cross section — — — 24–50 — PDF and αSdependence 1–10 — — 1–10 — µR/µFdependence 1–7 — — 1–28 1–9 Merged tagging Generator <3 — — <4 <4 Parton showering 1–22 1–23 1–42 1–25 1–34
Sample size (data) 1–5 1–7 1–11 1–3 1–3
Mistag Nb 1–22 1–18 1–18 1–6 1–5 Remaining sources 1–24 — — 1–27 1–32 Resolved tagging Generator <1 — — <1 <3 Parton showering 1–12 — — 1–16 1–31 Remaining sources 1–18 1–17 1–17 1–16 1–20


![Table 4: Range of systematic uncertainties [%] in the prediction across the different search regions](https://thumb-eu.123doks.com/thumbv2/123dok_br/16054272.1105683/21.892.148.745.350.1037/table-range-systematic-uncertainties-prediction-different-search-regions.webp)