article
How climate change can affect the distribution range and conservation status of an
endemic bird from the highlands of eastern Brazil: the case of the Gray-backed Tachuri,
Polystictus superciliaris
(Aves, Tyrannidae)
Diego Hoffmann1,4, Marcelo Ferreira de Vasconcelos2& Roge´rio Parentoni Martins3
1
Departamento de Cieˆncias Agra´rias e Biolo´gicas, Universidade Federal do Espı´rito Santo, Rod. BR 101 Norte, KM 60, Bairro Litoraˆneo, CEP 29932-540, Sa˜o Mateus, ES, Brazil.
2Museu de Cieˆncias Naturais, Pontifı´cia Universidade Cato´lica de Minas Gerais, Avenida Dom Jose´
Gaspar, 290, Pre´dio 41, Corac¸a˜o Eucarı´stico, CEP 30535-610, Belo Horizonte, MG, Brazil. 3Departamento de Biologia, Universidade Federal do Ceara´, Centro de Cieˆncias, Avenida da Universidade,
2853, CEP 60020-181, Fortaleza, CE, Brazil.
4
Corresponding author: Diego Hoffmann, e-mail:diego_hoffmann@hotmail.com
HOFFMANN, D., VASCONCELOS, M.F., MARTINS, R.P. How climate change can affect the
distribution range and conservation status of an endemic bird from the highlands of eastern Brazil: the case of the Gray-backed Tachuri, Polystictus superciliaris(Aves, Tyrannidae).
http://dx.doi.org/10.1590/1676-06032015007513
Abstract: The Gray-backed Tachuri (Polystictus superciliaris) is a Tyrannidae restricted to eastern Brazilian highlands. Its population and range are still thought to be declining mainly due to habitat loss, caused by land use. We evaluated the impacts on its range (increase or decrease, displacement in latitude and altitude), considering possible effects caused by inappropriate land use and climatic changes. For this purpose, we modeled its current range and estimated its overlap between the predicted area and future scenarios. We also analyzed the efficiency of the Brazilian reserves to the species’ protection. The range established by the Maxent model was 76.1% lower than that available in the literature and presented a decrease in the future. Range contraction for the periods under consideration ranged from 22.5% to 77.3%. The distribution center shifts to the southwest (from 102.5 km to 275.4 km) and to higher elevations (1,102 m to 1,428 m). From the predicted range, 20% are under some kind of human occupation. The Brazilian reserves partially protect the species, with only 12% of its range, from the 44.2% expected. Based on these predictions, and depending on the species’ dispersal ability and adaptation, it may become vulnerable in the period of 2080. This study demonstrates that the most important areas for maintaining populations ofP. superciliarisnow and in the future are those located in the ‘Iron Quadrangle’, especially the Serra da Gandarela, where it was partially protected by the recently decreed Gandarela National Park. This region should receive special attention because it is strongly threatened by iron mining in areas relevant for conservation located outside this reserve.
Keywords: Climate change, Evaluation reserve efficiency, Espinhac¸o range, Species distribution model.
HOFFMANN, D., VASCONCELOS, M.F., MARTINS, R.P. Como as mudanc¸as clima´ticas podem
afetar a a´rea de distribuic¸a˜o e o status de conservac¸a˜o de uma ave endeˆmica das montanhas do leste do Brazil: o caso do papa-moscas-de-costas-cinzentas, Polystictus superciliaris (Aves, Tyrannidae). Biota
http://dx.doi.org/10.1590/1676-06032015007513
Resumo: O papa-moscas-de-costas-cinzentas (Polystictus superciliaris) e´ uma espe´cie de Tyrannidae endeˆmica dos topos de montanha do leste do Brasil. Sua populac¸a˜o e a´rea de distribuic¸a˜o esta˜o em declı´nio principalmente devido a` perda de habitat causada pelo uso inadequado da terra. No´s avaliamos os impactos sobre sua distribuic¸a˜o (aumento ou diminuic¸a˜o, deslocamento em latitude e altitude), considerando os possı´veis efeitos causados pelo uso do solo e pelas mudanc¸as clima´ticas. Para esse propo´sito, modelamos a distribuic¸a˜o atual e avaliamos a sobreposic¸a˜o entre a a´rea predita e os cena´rios futuros. Tambe´m avaliamos a eficieˆncia das Unidades de Conservac¸a˜o brasileiras para a protec¸a˜o da espe´cie. A a´rea de distribuic¸a˜o estimada por meio do programa Maxent foi 79,1% menor que a a´rea encontrada na literatura, apresentando uma tendeˆncia a diminuic¸a˜o no futuro. Foi projetada uma contrac¸a˜o de 22,5% a 77,3% da a´rea de distribuic¸a˜o atual para o futuro. O centro da a´rea de distribuic¸a˜o deslocou-se para o sudeste (de 102,5 a 275,4 km) e para a´reas com alta elevac¸a˜o (1.102 m a 1.428 m). Da a´rea projetada, 20% encontra-se sob algum tipo de ocupac¸a˜o humana. As Unidades de Conservac¸a˜o brasileiras protegem parcialmente a espe´cie, com somente 12% de sua distribuic¸a˜o quando o esperado seriam 44,2%. Baseado nas projec¸o˜es e, dependendo das habilidades de dispersa˜o e adaptac¸a˜o da
Biota Neotropica. 15(2): e20130075.
espe´cie, ela pode se tornar vulnera´vel no perı´odo de 2080. Este estudo demonstrou que as a´reas mais importantes para a manutenc¸a˜o deP. superciliarisna atualidade e em perı´odos futuros situam-se no Quadrila´tero Ferrı´fero, especialmente na Serra da Gandarela, onde parte foi recentemente decretada como Parque Nacional da Gandarela. Essa regia˜o deve receber atenc¸a˜o especial por ser altamente ameac¸ada pela explorac¸a˜o do mine´rio de Ferro e por a´reas relevantes continuarem desprotegidas fora da abrangeˆncia do novo Parque.
Palavras-chave: Mudanc¸as clima´ticas, Avaliac¸a˜o da eficieˆncia de Reservas, Cadeia do Espinhac¸o, Modelos
de distribuic¸a˜o de espe´cies.
Introduction
Current climatic models predict global warming during the present century (IPCC 2007b). It is likely that the ranges of many species will change drastically (IPCC 2007a). Recent studies have shown that several species are responding to these changes and this pattern tends to increase in the future (e.g. Hughes 2000, Parmesan & Yohe 2003). Thus, it is expected that these changes will also increase the threat to some species, especially those living at high latitudes and elevations (Millennium Ecosystem Assessment 2005). In this case, largest impacts of climate change are predicted to occur in the high mountain ranges, for example, in the Alps (Beniston et al. 1997, Hughes 2000, Se´rgio 2003). This would occur because species living in mountains tend to be more sensitive to climatic changes and present limited ability to adjust their ranges because of the decreasing of available surface with the increasing of elevation (Thuiller et al. 2005, Rull & Vegas-Vilarru´bia 2006, Pauli et al. 2007).
In this way, it is essential to predict effects and potential management strategies for these species by developing practices aiming to measure how they can be affected by these changes (Jiguet et al. 2010). Aiming the projection of the future suitable range of several species and possible impacts of climatic change on them, several modeling algorithms have been used to define the relationship between the current range of species and the current climatic variables (Thuiller et al. 2005, Heikkinen et al. 2006, Virkkala et al. 2008).
Several authors have assessed the potential impacts of climate change on Neotropical birds (e.g. Ancia˜es & Peterson 2006, Nunes et al. 2007, Marini et al. 2009b, a, Marini et al. 2010).Nevertheless, studies focusing birds endemic to high-altitude areas are very scarce and restricted to the Andean region (e.g. Graham et al. 2010, S¸ekercioglu et al. 2012).
In this respect, eastern Brazilian mountains are located between two important global and highly threatened hotspots: the Atlantic Forest and the Cerrado (Silva & Bates 2002, Mittermeier et al. 2004). These mountains are also considered important centers of diversity and endemism of plants (Giulietti et al. 1997, Safford 1999) and animals (Rodrigues 1988, Stattersfield et al. 1998, Vasconcelos 2008). One of these endemic species is the Gray-backed Tachuri (Polystictus superciliaris), a bird from the family Tyrannidae, which occurs from central Bahia state to northern Sa˜o Paulo state (Vasconcelos et al. 2003, Vasconcelos 2008). This species lives in the ‘campos rupestres’ (rocky fields) and ‘campos de altitude’ (high altitude grasslands), between 950 m and 1,950 m (Sick 1997, Stattersfield et al. 1998, Vasconcelos et al. 2003). Gray-backed Tachuri populations are thought to be declining due to its restricted range associated to habitat loss (Stattersfield et al. 1998, Vasconcelos et al. 2003, BirdLife International 2014). Nevertheless, the species’ known range presented in the basic literature and used to infer its current conservation status (see Ridgely & Tudor 2009) does not
include several localities where it has recent confirmed records (Vasconcelos et al. 2003, Vasconcelos 2008), and includes many areas where conditions are not propitious to its occurrence (e.g., lowlands, forests, and degraded areas), based on our field observations. This is due to the methodology employed by those authors, which basically consists on the union of localities (points) where the species has been recorded, which creates a range. This usually includes deviations of species’ ranges, because it is restricted to mountaintops, without records in adjacent lowlands. For an example in the case of the Gray-backed Tachuri, compare the figure with species’ range presented by Ridgely & Tudor (2009) to figure 5 of Vasconcelos (2008).
For species with restricted ranges, including most of the mountaintops endemics, habitat loss is the main factor influencing populations decline and their vulnerabilities (Davies et al. 2009). Knowledge on the impacts of climatic changes and habitat loss on such species is essential to understand how they may persist in the future, specially in regions facing rapid socio-economic development (Pressey et al. 2007), such as Eastern Brazil. Thus, range assessment is important for endemic species, such as the the Gray-backed Tachuri, for which there is little information and, therefore, is likely to become threatened in the future. Furthermore, this approach is also important to assess its conservation status (Anderson & Martı´nez-Meyer 2004, Hernandez et al. 2006) and also to determine its actual level of threats and protection (Fuller et al. 2006). In this context, such procedures may contribute to the correct management and successful applica-tion of resources for conservaapplica-tion, which are usually scarce.
Under this perspective, we inferred the current and the future ranges with suitable conditions for the Gray-backed Tachuri, in order to assess possible impacts of climatic changes and find new areas with favorable conditions for its occurrence outside its known range, which can be used to guide the application of resources for its conservation. We also evaluated the percentage of its range that coincides with current protected areas (based on available database of reserves decreed until 2011), to determine the need of investments in its protection and to identify possible new areas for its conservation, since it is possible that the species is not fully protected by not occurring in several reserves. Thus, we expect to provide new information for the protection of the Gray-backed Tachuri and its habitat preservation, in order to prevent that this endemic bird will be among the endangered species in the near future.
Materials and Methods
1. Species occurrence locations
In order to determine the localities of occurrence for the Gray-backed Tachuri, we used records obtained by specimens deposited in museums, literature review and our own field
http://www.scielo.br/bn http://dx.doi.org/10.1590/1676-06032015007513
2 Biota Neotrop
Hoffmann, D. et al.
records (see Vasconcelos 2008, Vasconcelos & Rodrigues 2010 for sources). Geographic coordinates from museum specimens were obtained from the collection sites listed in their original labels or based on Paynter Jr. & Traylor Jr. (1991) and Vanzolini (1992). All records with geographic coordinates were plotted within a grid of 30’’ cells (B0.833 x 0.833 km2).
Duplicate records within a single cell were removed.
2. Environmental dataset and climatic change scenarios
We discarded variables highly correlated and used the six remainder bioclimatic variables of temperature and precipita-tion for projecprecipita-tions of current and future ranges with suitable conditions. These variables were: minimum temperature of the coldest month, maximum temperature of the warmest month, mean annual temperature, annual precipitation, precipitation of the driest month and precipitation of the wettest month. The dataset was obtained from WorldClim (Hijmans et al. 2005), based on interpolations of observed data, representative of 1950-2000. We also used three topographic variables (slope, aspect and compound topographic index), obtained from the database of the US Geological Survey’s Hydro1k base ‘http://eros.usgs.gov/’). Soil data was obtained from FAO (1998). Vegetation layers were not included in the models because they are not available for future scenarios. All variables used for species distribution model (current and future periods) were standardized to the resolution of 30’’ over into the Brazilian’s political limits.
For future projections, we used the same variables for each period (2020, 2050 and 2080), by considering three General Circulation Models of gases (GCMs) (CCMA, HADCM3 and CSIRO) and two scenarios of the Special Report Emissions Scenarios (SRES) of the IPCC (2007a) (A2a e B2a), which reflect the potential impacts of different possible demographic, socio-economic and technological developments in the emis-sion of greenhouse gases.
3. Distribution modeling
We used Maxent version 3.2.19 with the default setting (Phillips et al. 2006) to model current and future potential suitable ranges for the Gray-backed Tachuri. The projection of current distribution was generated using 75% of occurrence records randomly selected and evaluated with the remaining 25%. The models were evaluated using an area under the relative operating characteristic curve (AUC/ROC) (Fielding & Bell 1997). The curve considers the rate of failure in relation to the predicted fractional area. The data were divided this way five times and it was calculated the average AUC with a more robust estimate of the predictive performance. We used all available data to obtain the final distribution range projection. For the projection of the suitable range for the Gray-backed Tachuri, in each of the three future periods, we obtained a consensus among six projections (three GCMs x two SRES scenarios), maximizing the accuracy and achieving a central trend. To transform the probabilistic ranges (present and future) in a binary map of presence/absence, we selected a threshold value that would encompass all sites (Pearson et al. 2007). Thus, we considered the possibility of 5% error in the forecast, because, occasionally, some records could represent individuals outside of its optimal niche or in transitional areas. All cells below the threshold value were set to ‘0’ and kept the
probability of occurrence of the above. The area was calculated by summing all pixels that presented the average probability of conditions higher than ‘0’ among the six projections of presence and absence. Finally, we removed from the predicted areas the overlapping lands already converted into intensive agriculture, urban areas and water bodies, using a land cover map presented by Eva et al. (2002).
In order to analyze the responses of the Gray-backed Tachuri to the climatic changes based on its range, we evaluated the extension and central point (centroid of its range) of predicted range in future periods. The distribution range was calculated by summing all pixels above the threshold value. To assess whether there was range shift, we calculated the distance between the centers of current and future ranges. For each period, we estimated the ratio between the size of the future and current range, as a measurement of potential impact of climatic changes. This estimate assumes that the species is able to disperse from its present range to a predicted range in the future, without any environmental or physiological impairment (hypothesis of total dispersion). We also calculated the percentage of overlap of the range of each future period in relation to the present, which assumes that the species is unable to disperse into new areas and may occupy only those areas with favorable current conditions and that are predicted in the future as climatically favorable (hypothesis of null dispersion). To assess whether there was an altitudinal shift, we calculated the difference between the average elevation of the future range projected for each period and the current projection. In this case, the altitude was extracted from all pixels of the predicted range by overlapping a relief map from the US Geological Survey’s Hydro1k base (http://eros.usgs. gov/) for subsequent calculation of its average.
4. Reserves data set and species representation
Data on the distribution of protected areas in Brazil were obtained from the databases available in ICMBio (http:// www4.icmbio.gov.br). This database consists of about 1,000 federal, state and municipal reserves, implemented until 2006 (equivalent to reserves of category II of IUCN) (MMA 2006). We performed gap analyzes, considering the projection of the current suitable range for the Gray-backed Tachuri and projections for future periods. For each period, an analysis was performed with all reserves. The predicted suitable range was overlapped with reserves distribution and we calculated the percentage of this range found in the protected area. We followed the methods proposed by Rodrigues et al. (2004) and Catullo et al. (2008) in order to identify a representation target (Scott et al. 1993), depending on the extent of the predicted suitable range for the species. Representation is the amount of the range of a species within protected areas, a parameter commonly used in conservation plans to evaluate the need for protection. Analyses were performed considering the following representation targets: i) species with restricted range (area of
potential presence less than 1,000 km2), which should be
(Rodrigues et al. 2004). A total gap occurs when a species is not represented in any reserve, a partial gap occurs when a species is represented only partially, and the species is considered
covered when the representation target is fully met
(Catullo et al. 2008). Representation under climate change was evaluated considering total and null capacity of dispersion (for each scenarios, present, 2020, 2050 and 2080).
Results
To model the potential distribution, we used 41 spatially independent points of occurrence of the Gray-backed Tachuri. The accuracy of the distribution model in predicting favorable conditions for the presence of the Gray-backed Tachuri was better than random. The AUC mean, based on test data generated from five models, was 0.993 (SD 0.007) and the selected cumulative threshold was 57. The omission range of the test data was 0.08 (SD 0.11) and the fractional predicted area was 0.003.
1. Current distribution
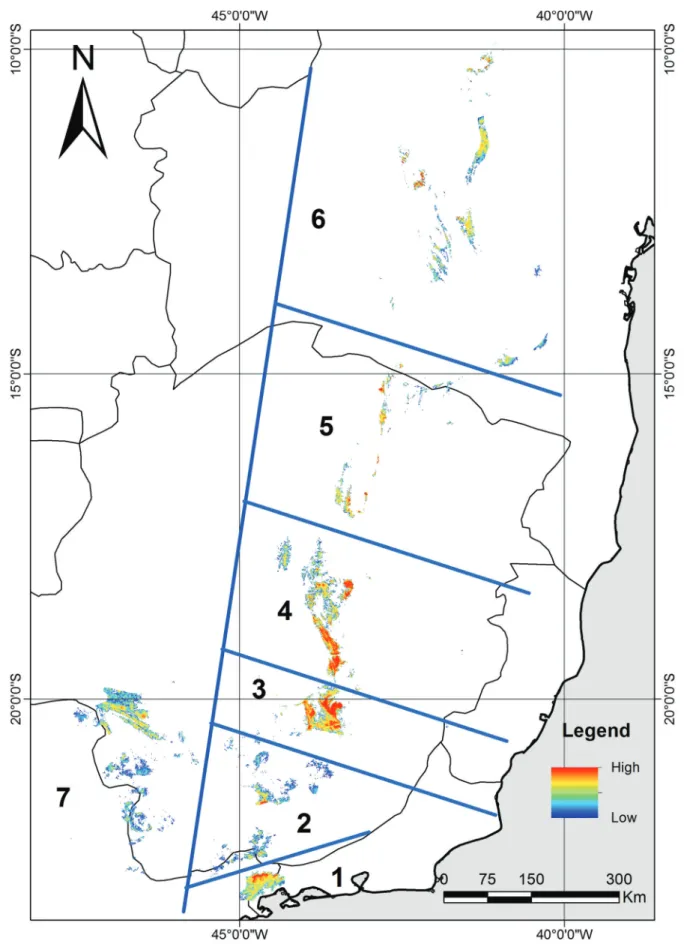
The predicted current distribution of the Gray-backed Tachuri, with favorable conditions, was 30,745 km2(Figure 1). This range was 76.1% lower than that presented by the literature (129,012 km2) (Ridgely & Tudor 2009) (Figure 2a) and 90.2% lower than that used to it conservation status assessment (314,000 km2) (BirdLife International 2014). The range with natural vegetation currently available for the species
was 25,240 km2, not considering those areas converted by
intensive agriculture, urban areas and water bodies (5,505 km2).
2. Distribution in future scenarios
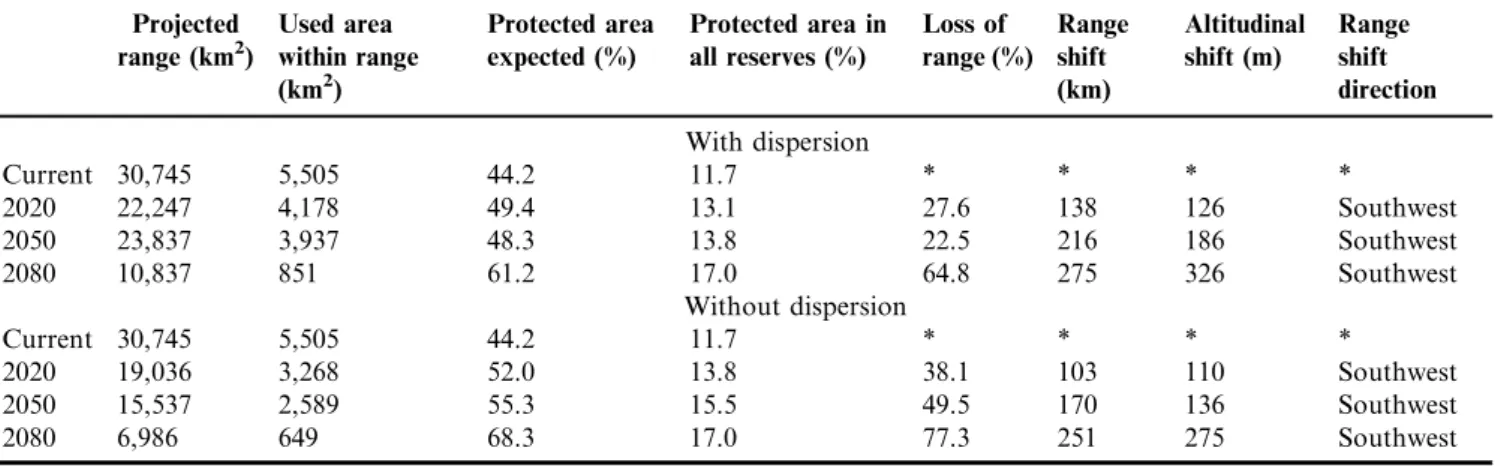
The suitable range for the Gray-backed Tachuri exhibited a contraction for future periods in relation to present range with favorable conditions. Under the null hypothesis of dispersion for the 2080 period, only a fifth of the current range remains (Figures 2b-d). Considering the hypothesis of total dispersion, the decrease in the current distribution for 2080 was of 64.7% (Table 1). Under the null hypothesis of dispersion, the range decrease was of 77.3%.
The range shift in future periods showed a gradual increase until 2080. This displacement was of 275.4 km under the total dispersion hypothesis and of 250.7 km considering the null hypothesis of dispersion. In addition, we obtained an altitudinal shift average of 325.5 m and 275.1 m, considering the two hypotheses, respectively (Table 1). For all future periods, the distribution center showed a shift toward the southwest (Figures 2b-d).
3. Coverage by the National System of Conservation Units (SNUC)
The predicted area with favorable conditions for the presence of the Gray-backed Tachuri reached 27 to 42 reserves (current and future scenarios). Those reserves protect a total area that ranges from 7,248 km2to 9,635 km2, depending on the specific scenario (Table 2). Nevertheless, only 49% of this area presented suitable environments for the species’ occurrence (Table 2) and represented only 11.7% of the predicted current range, from an expected range of at least, 44.2% (Table 1).
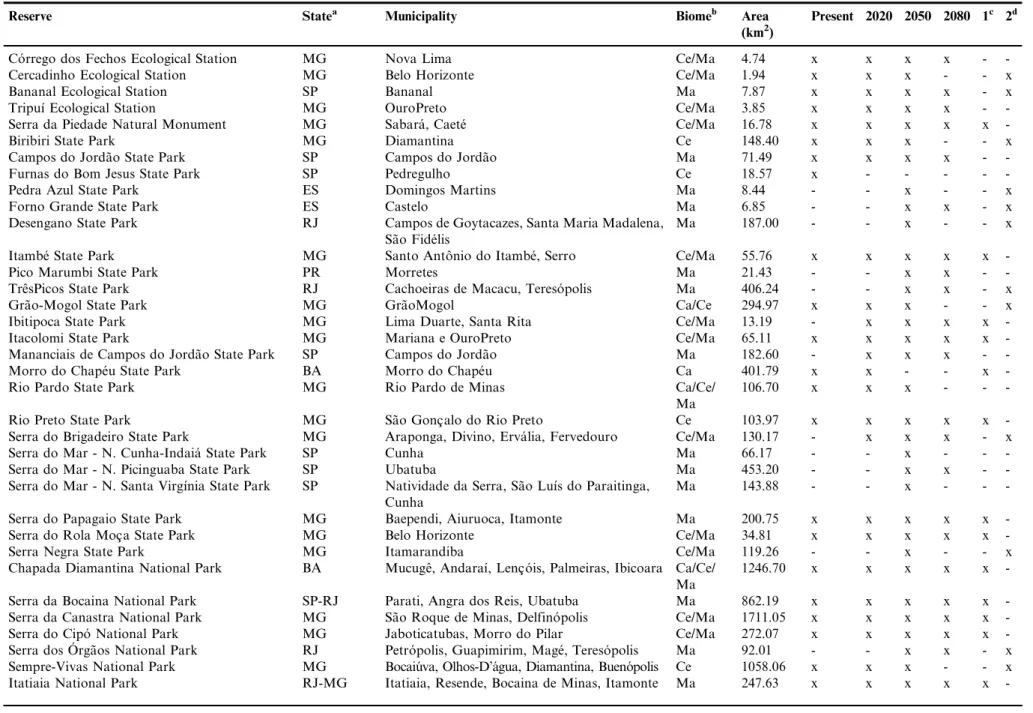
Similarly, in future periods, it was observed the loss of favorable conditions for up to eight reserves, considering the null hypothesis of dispersion, and the addition of up to 17 new reserves, if we consider the hypothesis of total dispersion (Table 2). Among the reserves that had favorable current conditions (27), 19 remained, at least partially, favorable in all future scenarios. Among the 13 reserves predicted by the model that have records for the species, 12 partially remained suitable conditions for all future periods (Table 3). The majority of the reserves showed a decrease in their areas of potential occurrence for the species in relation to the current scenario. Most affected areas in future scenarios are located in the northern Minas Gerais and Bahia, as is the case of the Morro do Chape´u State Park (Bahia), Biribiri State Park and Sempre Vivas National Park (Minas Gerais), which showed extinction conditions for 2080 (Table 3).
Discussion
1. Current predicted distribution
Recents records support our projections of current suitable range for the Gray-backed Tachuri, considering that these new records made on Caparao´ National Park (Costa 2011) and Serra dos O´ rga˜os National Park (Renno´ 2012) were not used in the models, and were predicted by these (Figures 2b-d, fine and isolated areas).
The predicted current suitable range for the Gray-backed Tachuri showed to be 75% lower than that presented by the literature (Ridgely & Tudor 2009) (Figure 2a). Probably the range of this species will prove to be even lower if vegetation is considered. This is because some sites where the soil is deeper and more fertile are covered by forest patches, and because deforestation is a dynamic process that can negatively affect the extent of projected occurrence for future scenarios. This difference may be related to the methods employed by these authors, which are similar to the minimum convex polygon (Odum & Kuenzler 1955), that consists in the union of all points of occurrence in a polygon, not taking into account the habitat preferences of species. Thus, many areas with unfavorable conditions may be considered favorable. Both hatched areas presented in Figure 2a can be explained because there were only two isolated sets of points at the time of delimitation of the specie’s range, which suggested two disjunct populations. Nevertheless, recent surveys have shown that this species is distributed throughout the entire Espinhac¸o Range, from its southern portion ‘Iron Quadrangle’ to its northern end, known as the Chapada Diamantina, and also in the Serra da Canastra, to the west, and part of Serra da Mantiqueira and Serra do Mar Ranges, to the south (Vasconcelos et al. 2003, Vasconcelos & D’Angelo Neto 2007, Vasconcelos 2008, Vasconcelos & Rodrigues 2010). Costa et al. (2010) reported a genetic isolation between specimens of two areas that in current predicted range are isolated by physical barriers corresponding to lowland areas. In this context and based on the current predicted range we were able to identify seven possible populations may be isolated in the eastern Brazilian highlands by lowland barriers (Figure 1). Therefore, further phylogeographic studies and information on the ability of transposition of unfavorable areas by the species are necessary to assess if there is interruption of gene flow by these other possible barriers.
http://www.scielo.br/bn http://dx.doi.org/10.1590/1676-06032015007513
4 Biota Neotrop
Hoffmann, D. et al.
Figure 2.(a) Range of the Gray-backed Tachuri (Polystictus superciliaris) (shaded area) following Ridgely & Tudor (2009) and real distribution based on museum specimens, literature and fieldwork (points); altitudes above 1,000 m are represented in gray; (b-d) area with constant favorable conditions (current and future periods) for the presence of the Gray-backed Tachuri (green), potential area for future occupation/dispersal but not currently (blue), current area with the possibility of loss of favorable conditions (red) in future periods (2020, 2050 and 2080, respectively) and shift of distribution center in relation to the current distribution (black arrows).
http://www.scielo.br/bn http://dx.doi.org/10.1590/1676-06032015007513
6 Biota Neotrop
Hoffmann, D. et al.
2. Projected distribution in future scenarios
Climatic change may be an important driver for range reduction of several species (IPCC 2007a). The conversion of natural vegetation into antropic areas is a dynamic process along time (see Silva et al. 2006), being responsible for the loss of approximately 1/5 of the current range projected. Even with the extinction of these activities, our results predicted a decrease of 38.1-77.3% of the current species range.
The center of distribution of the Gray-backed Tachuri showed a gradual latitudinal shift southwestward. It also presented an altitudinal shift. These results showed that this species responds similarly to other montane species (e.g., Bussche et al. 2008, Popy et al. 2010), which tend to occupy higher areas and/or to move to higher latitudes, with temperature increase. Parmesan & Yohe (2003) considered that each 1 km of latitudinal displacement in the range would be equivalent to the displacement of 1 m in altitude. The model of distribution of the Gray-backed Tachuri partially showed this pattern, or was close to it. The shift of the species’ distribution Center toward southwest coincides with this predictable hypothesis, since displacement vectors were
direc-ted to the highland areas of Espinhac¸o and Mantiqueira
Ranges (Figure 2b-d).
In a recent gap analysis, Marini et al. (2009a) found a larger area for the current distribution (55,000 km2) of the Gray-backed
Tachuri in comparison to that observed in the present study (30,745 km2). Similar discrepancies can also be observed for the extent of the impacted area (13000/5505 km2) and available range (420000/25240 km2). This difference may be related to the fact that Marini et al. (2009a) have used a larger number of algorithms and/or due a coarser resolution (of 4.5 x 4.5 km2), which covers more unfavorable areas that were considered in the present analysis. Despite these methodological differences, a decrease in the range of the Gray-backed Tachuri in future periods is clear in both studies, as the representation of the species range in protected areas, is lower than expected. The response of the species to future climate change will depend on the availability of shrubby environments where it feeds and nests, and from the shrubby vegetation response by climate change (Hoffmann et al. 2007, Hoffmann & Rodrigues 2011) and/or on its ability to adapt to new environmental conditions.
3. Conservation and protection by the Brazilian system of conservation units (SNUC)
Among all reserves where the Gray-backed Tachuri has been recorded (n¼14) (M.F. Vasconcelos, unpublished data),
85% (n¼12) were predicted by the model. Other 15 reserves
were predicted to have favorable conditions in the present and in future periods and they present shrubby vegetation that is Table 1. Estimation of the distribution of the Gray-backed Tachuri (Polystictus superciliaris) for current and future periods; predicted area currently impacted; expected level of effective protection in reserves; variation in size and loss of area; direction and displacement of the area centroid and altitudinal shift in future periods in relation to the present, under the assumptions of the hypothesis of total dispersion and the null hypothesis of dispersion.
Projected range (km2)
Used area within range (km2)
Protected area expected (%)
Protected area in all reserves (%)
Loss of range (%)
Range shift (km)
Altitudinal shift (m)
Range shift direction With dispersion
Current 30,745 5,505 44.2 11.7 * * * *
2020 22,247 4,178 49.4 13.1 27.6 138 126 Southwest
2050 23,837 3,937 48.3 13.8 22.5 216 186 Southwest
2080 10,837 851 61.2 17.0 64.8 275 326 Southwest
Without dispersion
Current 30,745 5,505 44.2 11.7 * * * *
2020 19,036 3,268 52.0 13.8 38.1 103 110 Southwest
2050 15,537 2,589 55.3 15.5 49.5 170 136 Southwest
2080 6,986 649 68.3 17.0 77.3 251 275 Southwest
Table 2.Number of reserves with high suitability for the occurrence of the Gray-backed Tachuri (Polystictus superciliaris) at present and in future periods, considering the variation in the extent of the area, the total area of reserves and percentage of area represented.
Present With dispersion Without dispersion
2020 2050 2080 2020 2050 2080
Number of reserves 27 30 42 30 26 25 19
Reserves with decrease of range 0 16 16 10 16 16 10
Reserves with increase of range 0 5 7 7 5 7 7
Reserves that have lost conditions 0 1 2 8 1 2 8
Reserves added 0 4 17 11 0 0 0
Reserves in which the range remain constant 0 5 2 2 5 2 2
Reserves areas (km2) 7,248 7,558 9,635 7,494 7,230 6,828 5,216
% of suitable areas in the reserves 49% 39% 34% 25% 26% 24% 12%
Table 3.Reserves with favorable conditions predicted for the occurrence ofPolystictus superciliaristoday and in future periods.
Reserve Statea Municipality Biomeb Area
(km2)
Present 2020 2050 2080 1c 2d
Co´rrego dos Fechos Ecological Station MG Nova Lima Ce/Ma 4.74 x x x x -
-Cercadinho Ecological Station MG Belo Horizonte Ce/Ma 1.94 x x x - - x
Bananal Ecological Station SP Bananal Ma 7.87 x x x x - x
Tripuı´ Ecological Station MG OuroPreto Ce/Ma 3.85 x x x x -
-Serra da Piedade Natural Monument MG Sabara´, Caete´ Ce/Ma 16.78 x x x x x
-Biribiri State Park MG Diamantina Ce 148.40 x x x - - x
Campos do Jorda˜o State Park SP Campos do Jorda˜o Ma 71.49 x x x x -
-Furnas do Bom Jesus State Park SP Pedregulho Ce 18.57 x - - - -
-Pedra Azul State Park ES Domingos Martins Ma 8.44 - - x - - x
Forno Grande State Park ES Castelo Ma 6.85 - - x x - x
Desengano State Park RJ Campos de Goytacazes, Santa Maria Madalena,
Sa˜o Fide´lis
Ma 187.00 - - x - - x
Itambe´ State Park MG Santo Antoˆnio do Itambe´, Serro Ce/Ma 55.76 x x x x x
-Pico Marumbi State Park PR Morretes Ma 21.43 - - x x -
-TreˆsPicos State Park RJ Cachoeiras de Macacu, Tereso´polis Ma 406.24 - - x x - x
Gra˜o-Mogol State Park MG Gra˜oMogol Ca/Ce 294.97 x x x - - x
Ibitipoca State Park MG Lima Duarte, Santa Rita Ce/Ma 13.19 - x x x x
-Itacolomi State Park MG Mariana e OuroPreto Ce/Ma 65.11 x x x x x
-Mananciais de Campos do Jorda˜o State Park SP Campos do Jorda˜o Ma 182.60 - x x x -
-Morro do Chape´u State Park BA Morro do Chape´u Ca 401.79 x x - - x
-Rio Pardo State Park MG Rio Pardo de Minas Ca/Ce/
Ma
106.70 x x x - -
-Rio Preto State Park MG Sa˜o Gonc¸alo do Rio Preto Ce 103.97 x x x x x
-Serra do Brigadeiro State Park MG Araponga, Divino, Erva´lia, Fervedouro Ce/Ma 130.17 - x x x - x
Serra do Mar - N. Cunha-Indaia´ State Park SP Cunha Ma 66.17 - - x - -
-Serra do Mar - N. Picinguaba State Park SP Ubatuba Ma 453.20 - - x x -
-Serra do Mar - N. Santa Virgı´nia State Park SP Natividade da Serra, Sa˜o Luı´s do Paraitinga, Cunha
Ma 143.88 - - x - -
-Serra do Papagaio State Park MG Baependi, Aiuruoca, Itamonte Ma 200.75 x x x x x
-Serra do Rola Moc¸a State Park MG Belo Horizonte Ce/Ma 34.81 x x x x x
-Serra Negra State Park MG Itamarandiba Ce/Ma 119.26 - - x - - x
Chapada Diamantina National Park BA Mucugeˆ, Andaraı´, Lenc¸o´is, Palmeiras, Ibicoara Ca/Ce/
Ma
1246.70 x x x x x
-Serra da Bocaina National Park SP-RJ Parati, Angra dos Reis, Ubatuba Ma 862.19 x x x x x
-Serra da Canastra National Park MG Sa˜o Roque de Minas, Delfino´polis Ce/Ma 1711.05 x x x x x
-Serra do Cipo´ National Park MG Jaboticatubas, Morro do Pilar Ce/Ma 272.07 x x x x x
-Serra dos O´ rga˜os National Park RJ Petro´polis, Guapimirim, Mage´, Tereso´polis Ma 92.01 - - x x - x
Sempre-Vivas National Park MG Bocaiu´va, Olhos-D’a´gua, Diamantina, Bueno´polis Ce 1058.06 x x x - - x
Itatiaia National Park RJ-MG Itatiaia, Resende, Bocaina de Minas, Itamonte Ma 247.63 x x x x x
-Continued on next page
ht
tp
:/
/ww
w
.sc
iel
o.b
r/b
n
h
ttp
:/
/dx
.do
i.o
rg
/10
.1
5
90/
167
6-060
3
201
5
00
75
13
8
Bi
ot
a
N
eotr
o
p
Ho
ffm
ann
,
D.
et
a
l.
favorable to the species (M.F. Vasconcelos, unpublished data) (Table 3). However, the species has not been recorded in these locations because of the lack of avifaunal surveys, or even because of its inability to colonize these areas through lowland barriers (Chaves et al. 2014).
Currently, the species is found in reserves with more than
1,000 km2, such as the Serra da Canastra and the Chapada
Diamantina National Parks (1,711 km2 and 1,246 km2,
respectively), but also in small reserves, with less than 20 km2, as in the case of Ibitipoca State Park and Serra da Piedade Natural Monument (13 km2and 16 km2, respectively). However, small reserves may not have enough area to maintain viable populations of the Gray-backed Tachuri, estimated as about 200 km2(Hoffmann 2011). Disregarding the reserve size, the Gray-backed Tachuri appeared to be less abundant in the north of its range (M.F. Vasconcelos, unpublished data), which includes the Chapada Diamantina National Park. Thus, one of the largest reserves with predicted occurrence has a low efficiency for the species’ conservation.
The representation of the Gray-backed Tachuri in reserves is only one-quarter of the expected for the present and tends to decrease gradually in future periods due to range reduction. The percentage of the predicted range represented in the reserves, for considering the species protected, increased gradually in future periods. Thus, there was a decrease of the total predicted range and, consequently, the need for increasing the species’ representation for, at least, 61.2 and 68.3%, considering the hypothesis of total dispersion and the null hypothesis of dispersion, respectively (Table 1). The decrease in the species’ representation indicates that the reserves that currently present suitable habitat will become inefficient and inadequate for the species’ conservation under future scenarios of environmental changes.
The distribution models as those generated by Maxent, could act as important tools for understanding many aspects of current and future predicted suitable ranges for the Gray-backed Tachuri, providing important information to re-evaluate its conservation status and ideas for possible conservation plans, as well as subsidizing important questions about the species, yet to be investigated. An example would be the potential barriers that probably isolate populations, in order to demonstrate the possibility of occupation of new areas in future. Knowledge on the species’ ability to cross these potential barriers would be an important indicator of the possibility of colonization of new areas in the face of possible climatic changes, considering that there are no reports on the viability of translocation and reintroduction programs for small and exclusively insectivorous tyrant-flycatchers (Tyrannidae). The region where the environ-mental suitability for the Gray-backed Tachuri remained constant in future periods, with a great area extension, is located in the ‘Iron Quadrangle’ region, Minas Gerais. This region has been strongly impacted by iron mining with more than 50 ironore opencast mines that totalize c. 2000 ha (DNPM -Departamento Nacional de Produc¸a˜o Mineral 2006, Jacobi et al. 2007), which have caused high destruction of the ‘campos rupestres’ vegetation.
In order to review the species’ conservation status it should be considered, for the estimation of its range, restrictive characteristics of its localities of occurrence (e.g. altitudinal limit and climatic variables), and not only the delineation of an area that incorporates all records of occurrence. The range of the Gray-backed Tachuri used in the assessment of its
conservation status in 2008 was 104,000 km2 and tripled (314,000 km2) for the revaluation in 2011, lowering the species’ status from ‘near-threatened’ to ‘least concern’ (BirdLife International 2014). The present results contradict this new categorization, indicating that the conservation status of many species, mainly based on their ranges, may be influenced by factors not considered limiting of their occurrence. Thus, we consider that the species should remain as ‘near-threatened’ and, if the impacts of climatic changes really occur, the species should be included in the ‘vulnerable’ category according to the B1 criterion (o20,000 km2) of IUCN (2001).
The species had a projected range on the political boundaries of five Brazilian states: Sa˜o Paulo, Minas Gerais, Rio de Janeiro, Espı´rito Santo and Bahia. Nevertheless, it is not endangered in any regional threatened category in the first four states that present regional red lists (Bergallo et al. 2000, Biodiversitas 2007, Passamani & Mendes 2007, Bressan et al. 2009). The northern range of the species is located in Bahia, a state that does not have any red list. Furthermore, the fact that the species is not represented on a list of threatened species at a regional level should be viewed with caution, since the species was recorded in the states of Rio de Janeiro and Espı´rito Santo after the publication of the red lists of those states. In both states there is evidence that populations of Gray-backed Tachuri are very small and present restricted range. On the other hand, in the state of Sa˜o Paulo there are historical records of the species and an absence of recent records. Thus, the extent of occurrence of the species presented in this paper is also important for the assessment and reassessment of the conservation status of the species at regional levels.
Finally, we suggest investing in research on autoecology and natural history of this and other species that are virtually unknown in the Neotropics. This information may help improve the models prediction and are essential for the conservation of the Gray-backed Tachuri and probably the entire highland biota from eastern Brazil.
Acknowledgments
We are grateful to the Coordenac¸a˜o de Aperfeic¸oamento de Pessoal de Nı´vel Superior for the support to D. Hoffmann and M.F. Vasconcelos with PhD grants. M.F. Vasconcelos was also supported by a collection study grant from the American Museum of Natural History. Three anonymous reviewers made important criticism on the original manuscript.
References
ANCIA˜ ES, M. & PETERSON, A.T. 2006. Climate change efects on Neotropical manakin diversity based on ecological niche modeling. Condor 108:778–791.
ANDERSON, R.P. & MARTI´NEZ-MEYER, E. 2004. Modeling species geographic distributions for preliminary conservation assessments: an implementation with the spiny pocket mice (Heteromys) of Ecuador. Biol. Conserv. 116(2):167-179. http://dx. doi.org/10.1016/S0006-3207(03)00187-3.
BENISTON, M., DIAZ, H.F. & BRADLEY, R.S. 1997. Climate change at high elevation sites: an overview. Clim. Change 36: 233–251.
BERGALLO, H.G., ROCHA, C.F.D., ALVES, M.A.S. & VAN SLUYS, M. 2000. A fauna ameac¸ada de extinc¸a˜o do Estado do Rio de Janeiro. Editora Universidade do Estado do Rio de Janeiro, Rio de Janeiro, RJ.
BIODIVERSITAS 2007. Revisa˜o das listas das espe´cies da flora e da fauna ameac¸adas de extinc¸a˜o do estado de Minas Gerais. Biodiversitas, Belo Horizonte.
BIRDLIFE INTERNATIONAL. 2014. Species factsheet:Polystictus superciliaris. www.birdlife.org. (last access in 30/05/2014). BRESSAN, P.M., KIERULFF, M.C.M. & SUGIEDA, A.M. 2009.
Fauna ameac¸ada de extinc¸a˜o no Estado de Sa˜o Paulo: Vertebra-dos. Secretaria do Meio Ambiente, Sa˜o Paulo.
BUSSCHE, J., SPAAR, R., SCHMID, H. & SCHRO¨ DER, B. 2008. Modelling the recent and potential future spatial distribution of the ring ouzel (Turdus torquatus) and blackbird (T. merula) in Switzerland. J. Ornithol. 149:529–544. http://dx.doi.org/10.1007/ s10336-008-0295-9.
CATULLO, G., MASI, M., FALCUCCI, A., MAIORANO, L., RONDININI, C. & BOITANI, L. 2008. A gap analysis of Southeast Asian mammals based on habitat suitability models. Biol. Conserv. 141:2730–2744. http://dx.doi.org/10.1016/j.biocon. 2008.08.019.
CHAVES, A.V., FREITAS, G.H.S., VASCONCELOS, M.F. & SANTOS, F.R. 2014. Biogeographic patterns, origin and specia-tion of the endemic birds from eastern Brazilian mountaintops: a review. Syst. Biodivers. 12:1–16.
COSTA, F.V. 2011. [WA401055,Polystictus superciliaris(Wied, 1831)]. http://www.wikiaves.com/401055. (last access in 31/05/2014). COSTA, L.C., NASCIMENTO, A.C.A., CHAVES, A.V.,
VASCONCELOS, M.F. & SANTOS, F.R. 2010. Filogeografia de Polystictus superciliaris. In 56° Congresso Brasileiro de Gene´tica, (SBG, coord.). SBG, Guaruja´, SP, p. 82.
DAVIES, T.J., PURVIS, A. & GITTLEMAN, J.L. 2009. Quaternary climate change and the geographic range of mammals. Am. Nat. 174:297–307. http://dx.doi.org/10.1086/603614.
DNPM-DEPARTAMENTO NACIONAL DE PRODUC¸A˜ O MINERAL 2006. Ferro. Ministe´rio de Minas e Energia, Brası´lia. EVA, H.D., MIRANDA, E.E., DI BELLA, C.M., GOND, V.,
HUBER, O., SGRENZAROLI, M., JONES, S., COUTINHO, A., DORADO, A., GUIMARA˜ ES, M., ELVIDGE, C., ACHARD, F., BELWARD, A.S., BARTHOLOME´ , E., BARALDI, A., DE GRANDI, G., VOGT, P., FRITZ, S. & HARTLEY, A. 2002. A vegetation map of South America. Office for Official Publica-tions of the European Communities, Luxembourg.
FAO 1998. Soil and terrain database for Latin America and the Caribbean. FAO, Rome.
FIELDING, A.H. & BELL, J.F. 1997. A review of methods for the assessment of prediction errors in conservation presence/absence models. Environ. Conserv. 24(1):38–49. http://dx.doi.org/10.1017/ s0376892997000088.
FULLER, T., MUNGUIA, M., MAYFIELD, M., SA´ NCHEZ-CORDERO, V. & SARKAR, S. 2006. Incorporating connectivity into conservation planning: a multi-criteria case study from Central Mexico. Biol. Conserv. 133:131–142. http://dx.doi.org/10.1016/j. biocon.2006.04.040.
GIULIETTI, A.M., PIRANI, J.R. & HARLEY, R.M. 1997. Espinhac¸o range region, eastern Brazil. In Centers of plant diver-sity: a guide and strategy for their conservation (DAVIS, S.D., Heywood, V.H., Herrera-Macbride, O., Villa-Lobos, J. & Hamilton, A.C. eds). Information Press, Oxford, v. 3, p. 397–404. GRAHAM, C.H., SILVA, N. & VELAZQUEZ TIBATA, J. 2010. Evaluating the potential causes of range limits of birds of the Colombian Andes. J. Biogeogr. 37(10):1863–1875. http://dx.doi. org/10.1111/j.1365-2699.2010.02356.x.
HEIKKINEN, R.K., LUOTO, M., ARAU´ JO, M.B., VIRKKALA, R., THUILLER, W. & SYKES, M.T. 2006. Methods and uncer-tainties in bioclimatic envelope modelling under climate change. Prog. Phys. Geog. 30:751–777.
HERNANDEZ, P.A., GRAHAM, C.H., MASTER, L.L. & ALBERT, D. L. 2006. The effect of sample size and species characteristics on per-formance of different species distribution modeling methods. Eco-graphy 29:773–785. http://dx.doi.org/10.1111/j.0906-7590.2006.04700.x.
http://www.scielo.br/bn http://dx.doi.org/10.1590/1676-06032015007513
10 Biota Neotrop
Hoffmann, D. et al.
HIJMANS, R.J., CAMERON, S.E., PARRA, J.L., JONES, P.G. & JARVIS, A. 2005. Very high resolution interpolated climate sur-faces for global land areas. Int. J. Climatol. 25:1965–1978. http:// dx.doi.org/10.1002/joc.1276.
HOFFMANN, D. 2011. Distribuic¸a˜o potencial e viabilidade de uma populac¸a˜o de Polystictus superciliaris (Aves, Tyrannidae), no sudeste do Brasil. Tese de Doutorado, Universidade Federal de Minas Gerais, Belo Horizonte.
HOFFMANN, D. & RODRIGUES, M. 2011. Breeding biology and reproductive success ofPolystictus superciliaris(Wied, 1831) (Aves: Tyrannidae): an uncommon tyrant-flycatcher endemic to the highlands of eastern Brazil. Zoologia 28(3):305–311. http://dx.doi. org/10.1590/S1984-46702011000300004.
HOFFMANN, D., VASCONCELOS, M.F., LOPES, L.E. & RODRIGUES, M. 2007. Comportamento de forrageamento e dieta dePolystictus superciliaris(Aves, Tyrannidae) no sudeste do Brasil. Iheringia Ser. Zool. 97(3):296–300. http://dx.doi.org/ 10.1590/S0073-47212007000300014.
HUGHES, L. 2000. Biological consequences of global warming: is the signal already. Trends Ecol. Evol. 15:56–61. http://dx.doi.org/ 10.1016/S0169-5347(99)01764-4.
IPCC 2007a. Climate Change 2007: impacts, adaption and vulner-ability, contribution of working group II to the fourth assessment report of the IPCC. Cambridge University Press, Cambridge, UK and New York, USA.
IPCC 2007b.Climate Change 2007: The physical science basis. Con-tributions of working group I to the fourth assesment report of the intergovernmental panel on climate change Cambridge University Press, Cambridge, UK and New York, USA.
IUCN 2001. IUCN Red List Categories and Criteria: Version 3.1. IUCN Species Survival Commission. IUCN, Gland, Switzerland and Cambridge, UK.
JACOBI, C.M., CARMO, F.F., VINCENT, R.C. & STEHMANN, J. R. 2007. Plant communities on ironstone outcrops: a diverse and endangered Brazilian ecosystem. Biodivers. Conserv. 16(7): 2785–2200. http://dx.doi.org/10.1007/s10531-007-9156-8.
JIGUET, F., GREGORY, R.D., DEVICTOR, V., GREEN, R.E., VORISEK, P., VAN STRIEN, A. & COUVET, D. 2010. Population trends of European common birds are predicted by characteristics of their climatic niche. Global Change Biol. 16: 497–505. http://dx.doi.org/10.1111/j.1365-2486.2009.01963.x. MARINI, M.Aˆ ., BARBET-MASSIN, M., LOPES, L.E. & JIGUET,
F. 2009a. Major current and future gaps of Brazilian reserves to protect Neotropical savanna birds. Biol. Conserv. 142(12): 3039-3050. http://dx.doi.org/10.1016/j.biocon.2009.08.002. MARINI, M.Aˆ ., BARBET-MASSIN, M., LOPES, L.E. & JIGUET,
F. 2009b. Predicted climate-driven bird distribution changes and forecasted conservation conflicts in a Neotropical Savanna. Conserv. Biol. 23(6):1558–1567. http://dx.doi.org/10.1111/j.1523-1739.2009.01258.x.
MARINI, M.Aˆ ., BARBET-MASSIN, M., MARTINEZ, J., PRESTES, N.P. & JIGUET, F. 2010. Applying ecological niche modelling to plan conservation actions for the red-spectacled amazon (Amazona pretrei). Biol. Conserv. 143(1):102-112. http://dx.doi.org/10.1016/j.biocon.2009. 09.009.
MILLENNIUM ECOSYSTEM ASSESSMENT. 2005. Ecosystems and human well-being: biodiversity synthesis. World Resources Institute, Washington, DC.
MITTERMEIER, R.A., GIL, P.R., HOFFMANN, M., PILGRIM, J. D., BROOKS, J., MITTERMEIER, C.G., LAMOURUX, J. & FONSECA, G.A.B. 2004. Hotspots revisited: earth’s biologically richest and most endangered terrestrial ecoregions. Cemex, Mexico City, Me´xico.
MMA 2006. Sistema Nacional de Unidades de Conservac¸a˜o da Nat-ureza - SNUC, lei n°9.985, de 18 de julho de 2000; decreto n° 4.340, de 22 de agosto de 2002. MMA/SBF, Brası´lia.
NUNES, M.F.C., GALETTI, M., MARSDEN, S., PEREIRA, R.S. & PETERSON, A.T. 2007. Are large-scale distributional shifts of the
blue-winged macaw (Primolius maracana) related to climate change? J. Biogeogr. 34:816–827. http://dx.doi.org/10.1111/j.1365-2699.2006.01663.x.
ODUM, E.P. & KUENZLER, E.J. 1955. Measurements of territory and home range size in birds. Auk 72:128–137.
PARMESAN, C. & YOHE, G. 2003. A globally coherent fingerprint of climate change impacts across natural systems. Nature 421:37–42. http://dx.doi.org/10.1038/nature01286.
PASSAMANI, M. & MENDES, S.L. 2007. Espe´cies da fauna ameac¸adas de extinc¸a˜o no estado do Espı´rito Santo. Instituto de Pesquisa da Mata Atlaˆntica, Vito´ria, ES.
PAULI, H., GOTTFRIED, M., REITER, K., KLETTNER, C. & GRABHERR, G. 2007. Signals of range expansion and contrac-tions of vascular plants in the high Alps: observationns (1994-2003) at the GLORIA master site Schrankvogel, Tyrol Austria. Global Change Biol. 13:147–156. http://dx.doi.org/10.1111/j.1365-2486. 2006.01282.x.
PAYNTER, JR., R.A. & TRAYLOR, JR., M.A. 1991. Ornithological gazetteer of Brazil. Museum of Comparative Zoology, Cambridge, Massachusetts.
PEARSON, R.G., RAXWORTHY, C.J., NAKAMURA, M. & PETERSON, A.T. 2007. Predicting species distributions from small numbers of occurrence records: a test case using cryptic geckos in Madagascar. J. Biogeogr. 34(1):102-117. http://dx.doi. org/10.1111/j.1365-2699.2006.01594.x.
PHILLIPS, S.J., ANDERSON, R.P. & SCHAPIRE, R.E. 2006. Max-imum entropy modeling of species geographic distributions. Ecol. Model. 190:231–259. http://dx.doi.org/10.1016/j.ecolmodel.2005.03.026. POPY, S., BORDIGNON, L. & PRODON, R. 2010. A weak upward elevational shift in the distributions of breeding birds in the Italian Alps. J. Biogeogr. 37(1):57-67. http://dx.doi.org/10.1111/ j.1365-2699.2009.02197.x.
PRESSEY, R.L., CABEZA, M., WATTS, M.E., COWLING, R.M. & WILSON, K.A. 2007. Conservation planning in a changing world. Trends Ecol. Evol. 22:583–592. http://dx.doi.org/10.1016/j.tree. 2007.10.001.
RENNO´ , B. 2012. [WA650076,Polystictus superciliaris(Wied, 1831)]. http://www.wikiaves.com/650076. (last access in 31/05/2014). RIDGELY, R.S. & TUDOR, G. 2009. Field guide to the songbirds of
South America: the Passerines. University of Texas Press, Austin, TX.
RODRIGUES, A.S.L., AKC¸AKAYA, H.R., ANDELMAN, S.J., BAKARR, M.I., BOITANI, L., BROOKS, T.M., CHANSON, J. S., FISHPOOL, L.D.C., FONSECA, G.A.B., GASTON, K.J., HOFFMANN, M., MARQUET, P.A., PILGRIM, J.D., PRESSEY, R.L., AB’SA´ BER, A.N., SECHREST, W., STUART, S.N., UNDERHILL, L.G., WALLER, R.W., WATTS, M.E., YAN, X., RODRIGUES, A.S.L., AKCAKAYA, H.R., ANDELMAN, S.J., BAKARR, M.I., BOITANI, L., BROOK, B. W., CHANSON, J.S., FISHPOOL, L.D.C., FONSECA, G.A.B., GASTON, K.J., HOFFMANN, M., MARQUET, P.A., PILGRIM, J.D., PRESSEY, R.L., SCHIPPER, J., SECHREST, W., STUART, S.N., UNDERHILL, L.G., WALLER, R.W., WATTS, M.E.J. & YAN, X. 2004. Global gap analysis: priority regions for expanding the global protected-area network. Bioscience 54:1092–1100. http://dx.doi.org/10.1641/0006-3568 (2004)054[1092:GGAPRF]2.0.CO;2.
RODRIGUES, M.T. 1988. Distribution of lizards of the genus
Tropidurus in Brazil (Sauria, Iguanidae). In Proceedings of a workshop on Neotropical distribution patterns, (Vanzolini, P.E, Heyer, W.R, coord.). Academia Brasileira de Cieˆncias, Rio de Janeiro, p. 305–315.
RULL, V. & VEGAS-VILARRU´ BIA, T. 2006. Unexpected biodi-versity loss under global warming in the neotropical Guayana Highlands: a preliminary appraisal. Global Change Biol. 12:1–9. http://dx.doi.org/10.1111/j.1365-2486.2005.01080.x.
J. Biogeogr. 26(4):693-712. http://dx.doi.org/10.1046/j.1365-2699. 1999.00313.x.
SCOTT, J.M., DAVIS, F., CSUTI, B., NOSS, R., BUTTERFIELD, B., GROVES, C., ANDERSON, H., CAICCO, S., D’ERCHIA, F., EDWARDS, JR., T.C., ULLIMAN, J. & WRIGHT, R.G. 1993. Gap analysis: a geographic approach to protection of biological diversity. Wildl. Monogr. 123:1–41.
S¸EKERCIOGLU, C¸.H., PRIMACK, R.B. & WORMWORTH, J. 2012. The effects of climate change on tropical birds. Biol. Conserv. 148(1):1-18. http://dx.doi.org/10.1016/j.biocon.2011.10.019. SE´ RGIO, F. 2003. Relationship between laying dates of black kites
Milvus migransand spring temperatures in Italy: rapid response to climate change? J. Avian Biol. 34:144–149.
SICK, H. 1997. Ornitologia brasileira. Nova Fronteira, Rio de Janeiro. SILVA, J.F., FARIN˜ AS, M.R., FELFILI, J.M. & KLINK, C.A. 2006. Spatial heterogeneity, land use and conservation in the cerrado region of Brazil. J. Biogeogr. 33:536–548.
SILVA, J.M.C. & BATES, J.M. 2002. Biogeographic patterns and conservation in the South American Cerrado: A tropical savanna Hotspot. Bioscience 52(3):225-234.
STATTERSFIELD, A.J., CROSBY, M.J., LONG, A.J. & WEGE, D.C. 1998. Endemic birds areas of the world: Priorities for biodi-versity conservation. BirdLife International, Cambridge, U.K. THUILLER, W., LAVOREL, S., ARAU´ JO, M.B., SYKES,
M.T. & PRENTICE, I.C. 2005. Climate change threats to plant
diversity in Europe. Proc. Natl. Acad. Sci. U. S. A. 102: 8245–8250.
VANZOLINI, P.E. 1992. A Supplement to the Ornithological Gazetteer of Brazil. Museu de Zoologia, Universidade de Sa˜o Paulo, Sa˜o Paulo.
VASCONCELOS, M.F. 2008. Mountaintop endemism in eastern Brazil: why some bird species from campos rupestres of the Espinhac¸o Range are not endemic to the cerrado region? Rev. Bras. Ornitol. 16(4):348–362.
VASCONCELOS, M.F. & D’ANGELO NETO, S. 2007. Padro˜es de distribuic¸a˜o e conservac¸a˜o da avifauna na regia˜o central da Cadeia do Espinhac¸o e a´reas adjacentes, Minas Gerais, Brasil. Cotinga 28:27–44. VASCONCELOS, M.F., MALDONADO-COELHO, M. & BUZZETTI, D.R.C. 2003. Range extension for the gray-backed tachuri (Polystictus superciliaris) and the pale-throated serra-finch (Embernagra long-icauda) with the revision on their geographic distribution. Ornitol. Neotrop. 14(4):477–489.
VASCONCELOS, M.F. & RODRIGUES, M. 2010. Patterns of geo-graphic distribution and conservation of the open-habitat avifauna of southeastern Brazilian mountaintops (Campos rupestres and Campos de altitude). Pap. Avulsos Zool. (Sa˜o Paulo) 50(1):1–29. VIRKKALA, R., HEIKKINEN, R.K., LEIKOLA, N. & LUOTO, M.
2008. Projected large-scale range reductions of norhtern-boreal land bird species de to climate change. Biol. Conserv. 141: 1343–1353. http://dx.doi.org/10.1016/j.biocon.2008.03.007.
Received 27/11/2013 Revised 13/03/2015 Accepted 19/03/2015
http://www.scielo.br/bn http://dx.doi.org/10.1590/1676-06032015007513
12 Biota Neotrop
Hoffmann, D. et al.