HILLSLOPE CURVATURE, CLAY MINERALOGY, AND
PHOSPHORUS ADSORPTION IN AN ALFISOL
CULTIVATED WITH SUGARCANE
Diogo Mazza Barbieri1; José Marques Júnior2*; Luis Reynaldo Ferracciú Alleoni3; Fernando José Garbuio4; Livia Arantes Camargo1
1
UNESP - Programa de Pós-Graduação em Produção Vegetal, Via de Acesso Prof. Paulo Donato Castellane, S/ N - 14884-900 - Jaboticabal, SP - Brasil.
2
UNESP - Depto. de Solos e Adubos. 3
USP/ESALQ - Depto. de Ciência do Solo, Av. Pádua Dias, 11 - 13418-900 - Piracicaba, SP - Brasil. 4
USP/ESALQ - Programa de Pós-Graduação em Solos e Nutrição de Plantas. *Corresponding author <marques@fcav.unesp.br>
ABSTRACT: Hillslope curvatures are associated with specific environments that correlate to chemical and mineralogical attributes of soil, so determining specific management zones. Phosphorus is one of the main limiting factors to the development and longevity of sugarcane. The type and the mineralogical constitution of the clay fraction play an important role in the phosphorus (P) adsorption of soil. High proportion of gibbsite (Gb) in soil may be the major responsible for P adsorption. The relationships among spatial variability as a function of hillslope curvature, the proportion of kaolinite (Kt) and Gb, and phosphorus adsorption were evaluated in an Alfisol cultivated with sugarcane. Two plots of 1 ha of a concave and a convex hillslope area were selected and 121 samples were collected in each area. The maximum P adsorption was determined in six samples taken randomly in each area. Data were submitted to descriptive statistical and geostatistical analysis. The lowest average values of available phosphorus were found in the convex area. In this area, the proportion of gibbsite, expressed by the values of the ratio [Gb/(Gb + Ct)] and the values of maximum adsorption capacity of phosphorus were higher than in the concave area.
Key words: Brazil, gibbsite, kaolinite available phosphorus, geostatistics, soil-landscape relationships
CURVATURAS DE RELEVO, MINERALOGIA DA
ARGILA E ADSORÇÃO DE FÓSFORO EM ARGISSOLO
CULTIVADO COM CANA-DE-AÇÚCAR
RESUMO: As curvaturas do relevo promovem pedoambientes específicos que condicionam os atributos químicos e mineralógicos do solo e podem auxiliar na definição de zonas específicas de manejo. O fósforo (P) é um dos principais elementos limitantes ao desenvolvimento e longevidade do canavial. O teor e a constituição mineralógica da fração argila assumem papel importante na disponibilidade do P, sendo que a gibbsita (Gb), quando presente em altas proporções no solo, pode ser a principal responsável pela sua adsorção e indisponibilidade. Investigaram-se as relações e a variabilidade espacial da adsorção de P e a ocorrência de caulinita (Ct) e gibbsita na fração argila de um Argissolo Vermelho-Amarelo eutrófico originado de rochas areníticas sob diferentes curvaturas do relevo em área sob cultivo de cana-de-açúcar. Duas malhas de 1 ha foram delimitadas numa área côncava e outra área convexa. Foram coletadas 121 amostras em cada área para realização das análises granulométricas, químicas e mineralógicas. A capacidade máxima de adsorção de P foi obtida em seis amostras escolhidas ao acaso em cada área. Os resultados foram submetidos às análises estatísticas descritiva e geoestatística. Os menores valores médios de P disponível encontraram-se na área convexa. Nesta área, a proporção de gibbsita, expressa pelos valores da razão [Gb/(Gb+Ct)] e os valores de capacidade máxima de adsorção de fósforo foram maiores do que na área côncava.
Palavras chave: Brasil, gibbsita, caulinita, fósforo disponível, geoestatística, relação solo-paisagem
INTRODUCTION
The hillslope curvatures and steepness make up a
spe-minerals (Kravchenko & Bullock, 2000; Ghidin et al., 2006). Camargo et al. (2008) verified the influence of small differences of the relief in the crystallinity and distribution of soil clay minerals. Reatto et al. (2008) studied an Oxisols’ toposequence in the central high-lands of Brazil both, under local and regional scale, and observed higher values for the gibbsite / (kaolinite + gibbsite) in hilly areas in comparison to flatter areas at the local scale of the study.
Similarities between the spatial distribution of the soil clay minerals and their chemical properties may explain the cause/effect relationship between these properties and the relief curvature (Franzen et al., 2006). This relationship is important because it can guide farm management decisions, such as the num-ber of soil samples necessary to characterize an area (Souza et al., 2006) and the required amount of fertil-izer.
Reduced P availability in soil is the most common nutritional limitation in agricultural production (Motta et al., 2002; Johnson & Loeppert, 2006), especially in highly weathered soils. Improving the efficiency of phosphate fertilization has been objective of many re-searchers (Francisco et al., 2007; Nogueira & Cardoso, 2007; Galvani et al., 2008). Most crops in Brazil re-spond positively to the application of phosphorus. How-ever, most of the supplementary phosphorus becomes unavailable due to adsorption reactions onto mineral colloids, precipitation reactions, or conversion to or-ganic forms (Busato et al., 2005).
The mineralogical composition and content of the clay fraction assumes an important role in the behav-ior of phosphorus. Al and Fe hydroxides and oxides in the clay fraction of soils are considered primarily responsible for the adsorption of phosphorus (Johnson & Loeppert, 2006; Ulén & Snäll, 2007), and goethite is the most effective form (Motta et al., 2002). Con-versely, Motta et al. (2002) and Mesquita Filho & Tor-rent (1993) pointed out that its contribution to the ad-sorption of phosphorus can be the equal to or higher than that of goethite when in soils with a high amount of gibbsite. Schaefer et al. (2004) observed that the maximum capacity of P adsorption is correlated better with the gibbsite content than with goethite, demonstrat-ing the importance of Al hydroxides in this phenomenon. The objectives of the present study were to evalu-ate: (i) the relationships between phosphorus adsorp-tion and the occurrence of kaolinite and gibbsite in the soil clay fraction from samples of an Alfisol cultivated with sugarcane; and (ii) the spatial variability of sev-eral soil attributes as a function of differences in hillslope curvatures.
Soil samples were collected in Catanduva, state of São Paulo, Brazil. It lies in the Paulista Western Pla-teau (21°05’S; 49°01’W) geomorphic province. The climate of the region is classified as Aw (Köppen’s classification); dry in the winter, with average rainfall of 1,350 mm, and an average annual temperature of 23°C. The primary vegetation of the Catanduva region is savannah seasonal pluvial forest, cultivated with sug-arcane for over 20 years. The soil parent material was identified as a sandstone from the Bauru Group, Adamantina formation (IPT, 1981), and the soil is a Typic Hapludalf (Soil Survey Staff, 1999).
Hillslope curvature were classified according to Troeh (1965). Two areas were delimited: one con-cave and another convex (Figure 1). The agricultural practices of the two areas along the years were iden-tical; both have been cultivated with the sugarcane, cultivar SP80-1842, and the last replanting was in 2003. Fluid fertilization was performed with 700 L ha–1 of 04–12-10 at replanting and 600 L ha–1 10-00-10 in the ratoon. All applications were performed at 20-cm depth. Filter cake and vinasse were not added in these areas.
Two 1-ha plots were delimited: one in the concave hillslope area and the other in the adjacent convex hillslope area. A spacing grid of 10 u 10 m was used in each of the plots, and the grid nodes were georeferenced using a geodesic GPS. Soil samples were collected at the grid nodes at 0.0-0.2 m and 0.2-0.4 m, totaling 121 sites per plot (Figure 1).
The potential acidity (H+Al) and organic matter con-tent (OM) were determined according to Raij et al. (2001). Exchangeable Ca, Mg, K, and available P were extracted with an ionic exchange resin (Raij et al., 2001). Clay cation exchange capacity (CEC) was cal-culated by dividing the soil CEC by the amount of clay (Embrapa, 2006). Particle size analysis was performed by the pipette method (Embrapa, 1997).
Six nodes were chosen from each grid for obtain-ing the P maximum adsorption data accordobtain-ing to the method described by Casagrande & Camargo (1997). Concentrations of phosphorus (100, 200, 400, 800, and 1,600 mg L–1) were added to soils samples, be-yond the control treatment, without the addition of phosphorus. The amount of adsorbed P by the soil was calculated by subtracting the value determined in so-lution from the total amount added. Linearization was performed using Langmuir’s equation to obtain the P maximum sorption capacity.
Chemical and mineralogical soil data were submit-ted to descriptive statistical analysis using the statisti-cal software, SAS (Schlotzhaver & Littell, 1997). Means of the variables were compared by the Student
t test. Next, semivariograms were plotted using geostatistical analysis.
RESULTS AND DISCUSSION
The available contents of phosphorus were differ-ent in the two areas (Table 1). The mean values of the concave and convex areas were 12 and 7 mg dm– 3
at 0-0.2 m, and 11 and 6 mg dm–3 at 0.2-0.4-m depth, respectively. These differences are relevant and may influence the decisions regarding soil use and manage-ment in both areas. The highest clay content was found in the convex area (Table 1), which may be a con-tributing factor to reduce P availability. Rolim Netto et
al. (2004) found that the most significant correlations for the maximum P sorption capacity were associated with the presence of gibbsite and the clay content.
The largest soil CEC values were observed in the convex area, which had the least amount of available P (Table 1). On the other hand, the CEC of the clay fractions of both areas were similar, which suggests that the two areas had the same type of clay, although more clay was found in the convex area. So, the larger CEC values for the convex area are a result of its higher contents of clay and organic matter.
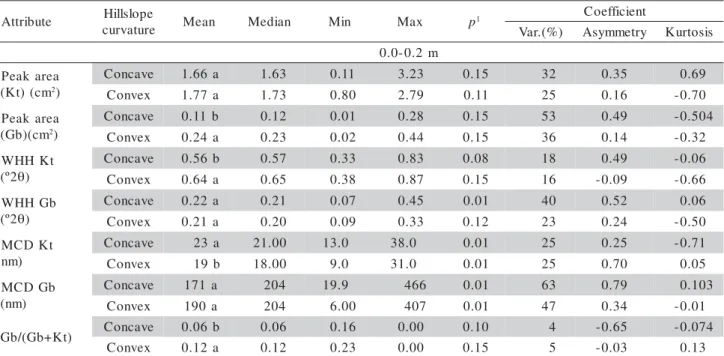
The presence of OM favors P desorption to the soil solution, competing with P for sorption sites (Mesquita Filho & Torrent, 1993; Heredia & Cirelli, 2007). Mesquita Filho & Torrent (1993) pointed out that P adsorption can be predicted based on the min-eralogical characteristics of the soil when the OM content is low. Comparing the mean areas of the diffractogram peaks of Kt and Gb (Table 2), differ-ences were only found for gibbsite. These results demonstrate that the convex area soil has more gibbsite and that both areas have very similar amounts of kaolinite (Table 2). The WHH of kaolinite varied from 0.33 to 0.83 °2T in the concave area, and 0.38 to 0.87 °2T in the convex area. Ghidin et al. (2006) studied a toposequence of Oxisols and found WHH values for kaolinite ranging from 0.55 to 0.85 °2T. The WHH values for gibbsite ranged from 0.07 to 0.45 °2T in the concave area, and from 0.09 to 0.33
°2T in the convex area. Ghidin et al. (2006) found WHH values ranging from 0.28 to 0.39 °2T for gibbsite.
The MCD values of kaolinite for both areas were different, in the same way to the WHH values. On the other hand, those values for gibbsite were not differ-ent. This demonstrates that kaolinite is better crystal-lized in the concave area, that is, the crystals have a smaller specific surface area and smaller P sorption ca-pacity than the crystals in the convex area soil. (Leal & Velloso, 1973; Juo & Fox, 1977; Fontes & Weed, 1996) The mean Gb/(Gb+Kt) ratio of the concave area was 0.06, while that of the convex area was 0.12, and this difference was significant (Student t test). The crystallographic attributes (Table 2) are different for gibbsite, while they are qualitatively different in the two studied areas for kaolinite. Therefore, the convex area has a highest proportion of gibbsite and smaller ka-olinite crystals when compared to the concave area. The convex area favors the formation of gibbsite, dem-onstrating that the relief may indicate the boundaries
between the environments and specific areas for the management and transfer of information (Marques Júnior & Lepsch, 2000; Franzen et al., 2006).
The mean and median values of all of the proper-ties were similar, with symmetrical distributions, as confirmed by the asymmetry values close to zero (Tables 1 and 2). The normality of the data predicts stationarity and shows that the so-called proportional effect was not observed; therefore, the data were suited for geostatistics (Isaaks & Srivastava, 1989). According to the classification proposed by Warrick & Nielsen (1980), low variation coefficients were found for the Gb/(Gb+Kt) ratio in the convex and con-cave areas. The same was observed for the CEC of the convex area at both depth ranges (Tables 1 and 2). The remaining properties presented mean and high coefficients of variation.
All variables presented spatial dependence at the two depth ranges (Table 3). At 0.0-0.2 m, only the convex soil CEC and the clay CEC of the concave area fitted the exponential model. At 0.2-0.4 m, the
e t u b i t t
A Hillslope
e r u t a v r u
c Mean Median Min Max p
1 Coefficient
) % ( . r a
V Asymmetry Kurtosis
m 2 . 0 -0 . 0 m d g m (
P –3) Concave 12a 11 4 25 0.07 41 0.64 -0.23
x e v n o
C 7b 7 1 14 0.15 51 0.01 -0.54
m d g ( M
O –3) Concave 13b 13 9 20 0.15 18 0.44 -0.06
x e v n o
C 15a 14 10 20 0.15 14 0.16 0.11
g k g ( y a l
C –1) Concave 189b 185 80 325 0.15 27 0.35 -0.27
x e v n o
C 230a 229 138 325 0.15 16 0.36 0.33
C E C l i o S m d c l o m m
( –3)
e v a c n o
C 52b 53 35 66 0.15 13 -0.16 -0.54
x e v n o
C 61a 61 47 67 0.15 10 0.40 0.03
C E C y a l C m d c l o m m
( –3)
e v a c n o
C 275a 286 203 437 0.03 39 0.28 0.08
x e v n o
C 265a 266 206 340 0.15 32 0.30 0.11
4 . 0 -2 . 0 m m d g m (
P –3) Concave 11a 10 3 24 0.03 46 0.69 -0.1
x e v n o
C 6b 6.0 1 15 0.15 54 0.20 -0.48
m d g ( M
O –3) Concave 12b 12 6 19 0.15 22 0.19 -0.08
x e v n o
C 14a 14 8 18 0.15 14 0.08 0.004
g k g ( y a l
C –1) Concave 215b 200 101 369 0.01 30 0.47 -0.73
x e v n o
C 255a 250 178 390 0.04 15 0.45 -0.65
C E C l i o S m d c l o m m
( –3)
e v a c n o
C 52b 52 36 70 0.15 13 0.10 0.17
x e v n o
C 61a 61 49 77 0.15 10 0.29 -0.56
C E C y a l C m d c l o m m
( –3)
e v a c n o
C 242a 260 189 356 0.07 41 0.05 1.02
x e v n o
C 239a 244 197 275 0.15 29 0.15 -0.32
1p = minimum level of significance in the Kolmogorov-Smirnov test; Min = minimum, Max = maximum, Var = variation; OM = organic
e t u b i r t t
A Hillslope
e r u t a v r u
c Mean Median Min Max p
1 Coefficient
) % ( . r a
V Asymmetry Kurtosis m 2 . 0 -0 . 0 a e r a k a e P m c ( ) t K
( 2)
e v a c n o
C 1.66a 1.63 0.11 3.23 0.15 32 0.35 0.69
x e v n o
C 1.77a 1.73 0.80 2.79 0.11 25 0.16 -0.70
a e r a k a e P m c ( ) b G
( 2)
e v a c n o
C 0.11 b 0.12 0.01 0.28 0.15 53 0.49 -0.504
x e v n o
C 0.24a 0.23 0.02 0.44 0.15 36 0.14 -0.32
t K H H W º ( 2θ)
e v a c n o
C 0.56b 0.57 0.33 0.83 0.08 18 0.49 -0.06
x e v n o
C 0.64a 0.65 0.38 0.87 0.15 16 -0.09 -0.66
b G H H W º ( 2θ)
e v a c n o
C 0.22a 0.21 0.07 0.45 0.01 40 0.52 0.06
x e v n o
C 0.21a 0.20 0.09 0.33 0.12 23 0.24 -0.50
t K D C M ) m n e v a c n o
C 23a 21.00 13.0 38.0 0.01 25 0.25 -0.71
x e v n o
C 19b 18.00 9.0 31.0 0.01 25 0.70 0.05
b G D C M ) m n ( e v a c n o
C 171a 204 19.9 466 0.01 63 0.79 0.103
x e v n o
C 190a 204 6.00 407 0.01 47 0.34 -0.01
) t K + b G ( / b
G Concave 0.06b 0.06 0.16 0.00 0.10 4 -0.65 -0.074
x e v n o
C 0.12a 0.12 0.23 0.00 0.15 5 -0.03 0.13
1p = minimum significance level in the Kolmogorov-Smirnov test; Min = minimum; Max = maximum; Var = variation; WHH = width at
half height; MCD = mean crystallite dimension; Gb/(Gb+Kt) =gibbsite ratio /(gibbsite+ kaolinite). Means followed by the same letter are not different (Student ttest).
Table 2 - Soil clay mineralogical attributes related to kaolinite (Kt) and gibbsite (Gb) on the concave and the convex hillslope curvatures at 0.2-0.4-m depth.
OM content of both areas and the CEC of the con-vex area fitted the Gaussian model. The CEC values of the soil and clay, the peak area of kaolinite, the MCD of gibbsite, and the Gb/(Gb+Kt) ratio of the concave area fitted the exponential model better. The remain-ing properties fitted the spherical model. Several au-thors obtained spherical model fitting for most of the soil properties (Grego & Vieira, 2005).
The degree of spatial dependence of the variables that were studied (Table 3) was evaluated by using the classification of Cambardella et al. (1994). At 0.0-0.2-m depth in the concave area, the P properties and the soil CEC presented moderate dependence. In the con-cave area, at 0.2-0.4 m, the P, OM, clay properties and the CEC of the soil and the kaolinite peak area of the convex area presented moderate spatial depen-dence. The remaining properties presented strong spa-tial dependence.
Ranges were found to vary with depth from 22 to 101 m at 0.0-0.2 m, and 18 to 89 at 0.2-0.4 m in the concave area. In the convex area, ranges varied from 20 to 26 m at 0.0-0.2 m and from 15 to 30 m at 0.2-0.4 m (Table 3). The properties presented different spatial dependence ranges, and ranges for the concave area were larger for all properties.
The lowest range values and highest spatial variabil-ity of chemical properties were found in the convex area (Table 3), demonstrating the influence of relief on the spatial behavior of these properties (Kravchenko &
Bul-lock, 2000; Souza et al., 2006; Camargo et al., 2008). Mcbratney & Webster (1983) reported that the efficacy of the soil sampling strategy can be improved by using the spatial variability model, which can define specific management zones when associated to the relief forms (Marques Júnior & Lepsch, 2000).
The maximum sorption capacity of phosphorus in the soil from the concave area varied from 416 to 526 mg kg–1
, while the soil from the convex area ranged from 454 to 588 mg kg–1, with mean values of 461 and 539 mg kg–1
, respectively (Table 4). This confirms that gibbsite extensively affect P adsorption and is more effective than OM (Mesquita Filho & Torrent, 1993). Motta et al. (2002) found that the maximum capacity of sorption of phosphorus varied from 676 to 1,233 mg kg–1 when the Gb/(Gb+Kt) ratio varied from 0.47 to 0.54, respectively.
Based in the maximum sorption capacity of phos-phorus (Table 4) and the amount of available phospho-rus (Table 1), one can suggest that gibbsite is prima-rily responsible for higher P adsorption and lower P availability in the convex than in the concave area be-cause it has greater proportion and better crystalliza-tion in this area (Table 2).
CONCLUSIONS
con-cave areas. Thus, hillslope curvatures can be used to define the boundaries of the more homogenous areas. Gibbsite is a determining factor in the maximum sorption capacity of phosphorus and in its smaller availability in the soil of the convex area.
The soil in the hillside area presented greater spa-tial variability for all of the properties studied as com-pared to the concave area, indicating that the sam-pling strategy used in the two areas must be differ-ent. e t u b i r t t
A Hillslope
e r u t a v r u
c Model Range(m)
1Co 2C 0+C1
) 1 C + o C ( / o C % r 2 m 2 . 0 -0 . 0 m d g m (
P –3) Concave Spherical 101 11.57 23.49 49 0.9
x e v n o
C Spherical 26 0.01 11.4 0.1 0.8
m d g ( M
O –3) Concave Spherical 22 0.08 3.71 2 0.8
x e v n o
C Spherical 22 0.16 3.89 4 0.9
g k g ( y a l
C –1) Concave Spherical 95 567 2523 22 0.9
x e v n o
C Spherical 23 27 1204 2 0.8
C E C l i o S m d c l o m m
( –3)
e v a c n o
C Spherical 86 18.94 45.95 41 0.9
x e v n o
C Exponential 25 4.8 36.65 13 0.7
C E C y a l C m d c l o m m
( –3)
e v a c n o
C Exponential 33 108 1474 7 0.9
x e v n o
C Spherical 20 38 1052 4 0.7
m 4 . 0 -2 . 0 m d g m (
P –3) Concave Spherical 89 9.2 23.21 39 0.9
x e v n o
C Spherical 23 0.4 10.01 4 0.8
m d g ( M
O –3) Concave Gaussian 28 1.68 3.37 49 0.8
x e v n o
C Gaussian 19 0.5 3.67 13 0.9
g k g ( y a l
C –1) Concave Spherical 85 1972 3945 50 0.9
x e v n o
C Spherical 28 41 1203 3 0.9
C E C l i o S m d c l o m m
( –3)
e v a c n o
C Exponential 80 15.9 61.11 26 0.9
x e v n o
C Gaussian 24 20.7 47.37 43 0.8
C E C y a l C m d c l o m m
( –3)
e v a c n o
C Exponential 35 105 1082 10 0.8
x e v n o
C Spherical 30 16 622 3 0.8
a e r a k a e P m c ( ) t K
( 2)
e v a c n o
C Exponential 36 0.021 0.1404 15 0.6
x e v n o
C Spherical 18 0.0058 0.194 30 0.7
a e r a k a e P m c ( ) b G
( 2)
e v a c n o
C Spherical 18 0.000014 0.00247 2 0.8
x e v n o
C Spherical 17 0.00015 0.00672 0.2 0.7
2 º ( t K H H
W θ) Concave Spherical 22 0.00001 0.0059 0.3 0.7
x e v n o
C Spherical 18 0.000027 0.00944 8 0.8
2 º ( b G H H
W θ) Concave Exponential 28 0.00046 0.005570 3 0.9
x e v n o
C Spherical 18 0.00005 0.00192 4 0.9
) m n ( t K D C
M Concave Spherical 19 0.01 26.24 0.03 0.7
x e v n o
C Spherical 15 0.94 19.54 5 0.7
) m n ( b G D C
M Concave Exponential 29 1120 9240 12 0.5
x e v n o
C Spherical 16 1400 64990 2 0.5
t K + b G / b
G Concave Exponential 28 0.000181 0.0013 14 0.7
x e v n o
C Spherical 18 0.00005 0.00179 3 0.9
1C
0= nugget effect; 2C
0+C1= sill; 5 C
0/(C0+C1 ) = degree of spatial dependence; OM = organic matter; CEC = cation exchange capacity;
REFERENCES
BUSATO, J.G.; CANELLAS, L.P.; VELLOSO, A.C.X. Fósforo num Cambissolo cultivado com cana-de-açúcar por longo tempo. I. Fracionamento sequencial. Revista Brasileira de Ciência do Solo, v.29, p.935-945, 2005.
CAMARGO, O.A.; MONIZ, A.C.; JORGE, J.A.; VALADARES, J.M.A.S. Métodos de análise química, mineralógica e física de solos do IAC. Campinas: Instituto Agronômico de Campinas, 1986. 94p. (Boletim Técnico, 106).
CAMARGO, L.A.; MARQUES JUNIOR, J.; PEREIRA, G.T.; HORVAT, R.A. Variabilidade espacial de atributos mineralógicos de um Latossolo sob diferentes formas do relevo: I - mineralogia da fração argila. Revista Brasileira de Ciência do Solo, v.32, p.2269-2277, 2008.
CAMBARDELLA, C.A.; MOOMAN, T.B.; NOVAK, J.M.; PARKIN, T.B.; KARLEM, D.L.; TURVO, R.F.; KONOPA, A.E. Field scale variability of soil properties in Central Iowa soil. Soil Science Society of America Journal, v.58, p.1501-1511, 1994.
CASAGRANDE, J.C.; CAMARGO, O.A. Adsorção de fosfato em solos com caráter ácrico validada por um modelo de complexação de superfície. Revista Brasileira de Ciência do Solo, v.21, p.353-360, 1997.
EMPRESA BRASILEIRA DE PESQUISA AGROPECUÁRIA -EMBRAPA. Sistema Brasileiro de Classificação de Solos. 2.ed. Rio de Janeiro: Embrapa, 2006. 412p.
EMPRESA BRASILEIRA DE PESQUISA AGROPECUÁRIA – EMBRAPA. Manual de métodos de análise de solo. 2 ed. Rio de Janeiro: Ministério da Agricultura, 1997. 212p.
FONTES, M.P.F.; WEED, S.B. Phosphate adsorption by clays from Brazilian Oxisols: relationships with specific surface area and mineralogy. Geoderma, v.72, p.37-51, 1996.
FRANCISCO, E.A.B.; PROCHNOW, L.I.; TOLEDO, M.C.M.; FERRARI, V.C.; JESUS, S.L. Thermal treatment of aluminous phosphates of the crandallite group and its effect on phosphorus solubility. Scientia Agricola, v.64, p.269-274, 2007. FRANZEN, D.W.; NANNA, T.; NORVELL, W.A. A survey of soil
attributes in North Dakota by landscape position. Agronomy Journal, v.98, p.1015-1022, 2006.
GALVANI, R.; HOTTA, L.F.K.; ROSOLEM, C.A. Phosphorus sources and fractions in an Oxisol under no-tilled soybean. Scientia Agricola, v.65, p.415-421, 2008.
GHIDIN, A.A.; MELO, V.F.; LIMA, V.C.; LIMA, J.M.J.C. Topossequência de latossolos originados de rochas basálticas no Paraná. I. Mineralogia da fração argila. Revista Brasileira de Ciência do Solo, v.30, p.293-306, 2006.
GREGO, C.R.; VIEIRA, S.R. Variabilidade espacial de propriedades físicas do solo em uma parcela experimental. Revista Brasileira de Ciência do Solo, v.29, p.169-177, 2005.
Table 4 - Maximum sorption capacity of phosphorus in the two studied areas.
Means followed by the same letter are not different (Student t test).
e t i
S Concave Hillslope Area ConvexHillslopeArea g
k g m
-- –1-----------------
-1 435 555
2 526 588
3 500 588
4 435 526
5 454 526
6 416 454
-a e M
n 461a 539b
HEREDIA, O.S.; CIRELLI, A.F. Environmental risks of increasing phosphorus addition in relation to soil sorption capacity. Geoderma, v.137, p.426-431, 2007.
INSTITUTO DE PESQUISAS TECNOLOGICAS DO ESTADO DE SÃO PAULO - IPT. Mapa geomorfológico do Estado de São Paulo. Escala - 1:1.000.000. São Paulo, IPT, 1981. v.1, 9 4 p .
ISAAKS, E.H.; SRIVASTAVA, R.M. An introduction to applied geoestatistics. New York: Oxford University Press, 1989. 561p.
JOHNSON, S.E.; LOEPPERT R.H. Role of organic acids in phosphate mobilization from iron oxide. Soil Science Society of America Journal, v.7, p.222-234, 2006.
JUO, A.S.R.; FOX, R.L. Phosphate sorption characteristics of some bench-mark soils of West Africa. Soil Science, v.124, p.370– 376, 1977.
KRAVCHENKO, A.N.; BULLOCK, D.G. Correlation of corn and soybean grain yield with topography and soil properties. Agronomy Journal, v.92, p.75-83, 2000.
LEAL, J.R.; VELOSO, A.C.X. Phosphate adsorption in latosols under Cerrado vegetation. Pesquisa Agropecuária Brasileira, v.8, p.81-88, 1973.
MARQUES JÚNIOR, J.; LEPSCH, I.F. Depósitos superficiais neocenozóicos, superfícies geomórficas e solos em Monte Alto, SP. Geociência, v.19, p.226-231, 2000.
McBRATNEY, A.B.; WEBSTER, R. How many observations are needed for regional estimation of soil properties? Soil Science, v.135, p.177-183, 1983.
MEHRA, O.P.; JACKSON, M.L. Iron oxide removal from soils and clay by a dithionite-citrate system bulfered with sodium bicarbonate.Clays and Clay Minerals, v.7, p.317-327, 1960. MESQUITA FILHO, M.V.; TORRENT, J. Phosphate sorption as related to mineralogy of a hydrosequence of soils from Cerrado Region (Brazil). Geoderma, v.58, p.107-123, 1993. MOTTA, P.E.F. Adsorção e formas de fósforo em Latossolos:
influencia da mineralogia e histórico de uso. Revista Brasileira de Ciência do Solo, v.26, p.349-359, 2002.
NOGUEIRA, M.A.; CARDOSO, E.J.B.N. Phosphorus availability changes the internal and external endomycorrhizal colonization and affects symbiotic effectiveness. Scientia Agricola, v.64, p.295-300, 2007.
REATTO, A.; BRUAND, A.; MARTINS, E.S.; MULLER, F.; SILVA, E.M.; CARVALHO JR, O.A.; BROSSARD, M. Variation of the kaolinite and gibbsite content at regional and local scale in Latosols of the Brazilian Central Plateau. Comptes Rendus Geoscience, v.340, p.741-748, 2008.
RAIJ, B. van. Análise química para avaliação da fertilidade de solos tropicais. Campinas, Instituto Agronômico, 2001. 285p.
ROLIM NETO, F.C.; SCHAEFER, C.E.G.R.; COSTA, L.M.; CORRÊA, M.M.; FERNANDES FILHO, E.I.; IBRAIMO, M.M Adsorção de fósforo, superfície específica atributos mineralógicos em solos desenvolvidos de rochas vulcânicas do Alto Paranaíba (MG).Revista Brasileira de Ciência do Solo, v.28, p.953-964, 2004.
SCHAEFER, C.E.G.R.; GILKES, R.J.; FERNANDES, R.B.A. EDS/ SEM study on microaggregates of Brazilian Latosols in relation to P adsorption and clay fraction attributes. Geoderma, v.123, p.1-33, 2004.
SCHLOTZHAVER, S.D.; LITTELL, R.C. SAS: system for elementary statistical analysis. 2 ed. Cary: SAS, Institute, 1997. 905p.
SCHULZE, D.G. The influence of aluminium on iron oxides VIII. Unit-cel dimension of Al-substituted of goethites and estimation of Al from them. Clays and Clay Minerals, v.32, p.36-44, 1984.
Oxisol cultivated with sugar cane. Scientia Agricola, v.63, p.161-168, 2006.
TROEH, F.R. Landform equations fitted to contour maps. American Journal of Science, v.263, p.616-627, 1965. ULÉN, B.; SNÄLL, S. Forms and retention of phosphorus in an
illite-clay soil profile with a history of fertilisation with pig manure and mineral fertilizers. Geoderma, v.137, p.455–465, 2007.
Applications of soil physics. New York: Academic Press, 1980. chap.2, p.319-344.