*e-mail: [email protected]
1. Introduction
Alternating current (AC) induced corrosion is subject of scientiic research since it has been observed that the soil corrosion of buried metallic structures under certain circumstances is accelerated by the influence of AC signals1-4. It had been formerly assumed that only the direct current (DC) component of an alternating signal could cause corrosion damage. However, a growing number of corrosion cases was observed at buried pipelines, which were installed in short distance and parallel to high voltage AC transmission lines or to electriied railways1-3. Damage
could obviously occur even when the pipeline was provided with a cathodic protection system. Some researchers attributed the AC inluence on corrosion to a rectiication current, which can be expected as the result of an asymmetric Tafel behavior5-6.
According to Goidanich et al.7, AC signals have
inluence on the kinetic parameters of anodic and cathodic reactions and lead to modiication of corrosion potential (Ecorr) and corrosion current density (icorr) values. In most cases, a shift of Ecorr to more negative values and a higher icorr are reported7-8. The results, however, depend on the
electrode material, the electrolyte and the height of the AC signal. Even a decrease of icorr under AC inluence was found in one case7. Laboratory tests in simulated soil
medium showed that the current eficiency with respect to weight loss is much lower in the case of AC than in the case
of DC.7 According to the literature the current eficiency is below 5% and depends on the amplitude of the AC signal9.
Nevertheless, some authors attributed corrosion rates as high as 1mm/y to AC-corrosion during the irst year of exposure5, probably diminishing during further exposure. An important point of discussion is the question in which way weight loss is related to AC and if other parameters must be taken into account in order to deine safe operational conditions for buried constructions10. In this context, the interaction of AC with imposed cathodic protection currents was discussed10. At cathodic current densities oxygen reduction leads to alkalinization of the metal surface. High cathodic protection currents combined with high AC component can cause the formation of soluble iron hydrates. Dissolution of one monolayer during one AC cycle would mean a corrosion rate of 70mm/y11. Redox reactions between Fe2+ and Fe3+
in the iron oxide ilms take place during the positive and negative half wave and lead to the formation and reductive dissolution of protective passive ilms and non-protective rust ilms11. Goidanich et al.7 conirmed that AC leads to
the growth of thick but non-adherent ilms of corrosion products on the metal surface and that, in this way, AC enhances localized corrosion. The authors found that nature, thickness and adhesion of the ilm changes with AC density, type of metal and solution composition. Brenna12 suggested that AC causes the electro-mechanical breakdown of the passive ilm formed on the metal surface under cathodic protection conditions and corrosion occurs after passive ilm
Soil Corrosion of the AISI1020 Steel Buried Near Electrical
Power Transmission Line Towers
Anderson de Oliveira Fragaa, Marcos Antonio Klunka, Adriano Agnoletto de Oliveirab,
Gilnei Gonçalves Furtadob, Gerhard Knörnschilda, Luís Frederico Pinheiro Dicka*
aLaboratório de Processos Eletroquímicos & Corrosão – ELETROCORR, Departamento de Metalurgia,
Universidade Federal do Rio Grande do Sul – UFRGS. Av. Bento Gonçalves, 9500, Bloco 4, Prédio 75, CEP 91501-970, Porto Alegre, RS, Brasil
bCompanhia de Energia Elétrica Estadual – CEEE, Av. Joaquim Porto Villanova, 201,
Prédio F, sala 205, Porto Alegre, RS, Brasil
Received: July 1, 2014; Revised: November 16, 2014
Soil corrosion of carbon steel samples buried up to hundred days close to a high voltage power transmission line tower was examined by weight loss vs. time. A higher weight loss was observed if the samples were electrically connected to the tower than if they were not. This was attributed to the inluence of alternating current (AC) signals induced in the soil by the transmission line. This ield study showed for the irst time the inluence of the AC power line on the buried structure of the tower, while other studies so far were focused only on AC corrosion of cathodically protected coated pipelines, running parallel to the transmission line. An improved method was used to measure weight loss by descaling in Clark solution. The new method substitutes discontinuous measurements, proposed in the ASTM-G1-90 standard, by in situ measurements of the weight loss during descaling, using a
computer controlled microbalance.
breakdown if the pH at the metal-to-electrolyte interface is close to 14. Based on the possible interaction of AC with DC for cathodic protection authors suggested a new potential values for cathodic protection, which would depend on the AC signal to which the structure is exposed13. Others
believe that cathodic protection is dificult in these cases and that mitigation of the AC inluence would be a better approach14-15.
AC induced corrosion of buried coated steel pipelines under cathodic protection to prevent corrosion at coating failures has attracted attention due to its economic importance, while other buried metal structures, which also might be subject to AC induced corrosion damage, have been much less studied16. Among them are the
metallic structures of the high voltage transmission lines itself. The buried base of the power line towers consists of galvanized carbon steel and soil corrosion of this part might be accelerated by signals induced from the power line. Electric ields due to uncompensated AC phases at the ground between two towers are estimated to values around 4 kV/m beneath lines with voltages from 110kV to 380kV.17
Moreover, inluence can originate from stray currents and from atmospheric discharges. Wojcicki18 suggested that stray currents originate in the lightning rod cables of the power line towers and low through the ground to close the loop to the neighboring tower. Potential measurements of the tower versus a buried Cu/CuSO4 reference electrode, made between the lightning rod and the neighboring tower showed in many cases that the potential becomes more negative towards the tower. This shows that an anodic current lows off the tower surface, indicating its corrosion18. To our best
knowledge, studies dedicated to determine the rate of this corrosion and a possible inluence on it of AC signals from the transmission line do not exist so far.
Therefore, in the present work, soil corrosion of carbon steel was examined by ield studies with samples buried near a high voltage power transmission line tower. To evaluate the inluence of induced AC signals, the electrical potential of one part of the samples was equalized to the potential of the tower by electrically connecting sample and tower. The weight loss of samples electrically connected to the tower was measured vs. time and compared with samples without electric contact.
2. Experimental Procedures
Studies of soil corrosion were performed with AISI 1020 (UNS G10200)19 carbon steel coupons with the dimensions
of 70 × 20 × 2 mm and provided with a hole of 2mm diameter at the upper part. These samples were sequentially ground on all sides with emery papers of granulometry up to 4000 mesh. The studies were performed near a power transmission tower located in Porto Alegre, Brazil, at
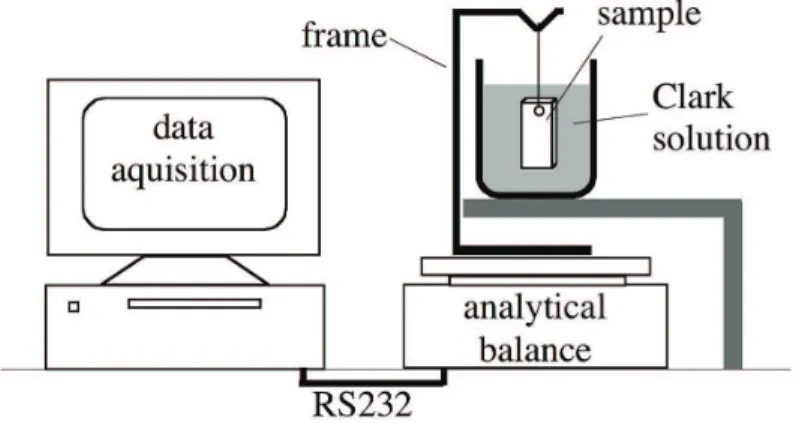
the area of the Rio Grande do Sul Electric Energy State Company (CEEE). The transmission tower was chosen for tests because of its protected location with access restricted to company employees. The soil to which the steel samples were exposed had a chloride concentration of 7.0mg/kg, a sulfate concentration of 3.0mg/kg and a pH value of 6.4 and a mean resistivity around 10kΩ.cm. Half of the samples was electrically connected to the transmission tower by an isolated copper wire, while the other half was not connected to the tower. Connected and unconnected samples were buried close to each other (≈ 1m) at 25 cm below the surface and tests were performed in parallel. The samples remained exposed to the soil for periods ranging from nine to one hundred days during the winter (June-September). The mean relative humidity, which is rather constant in Porto Alegre varied during the exposure time between 78 and 82%, the mean daily temperature between 14.7 to 16.8 °C, and the pluviometric precipitation between 110 and 180 mm/ month. After withdrawal of the samples, loosely adherent particles were removed and weight loss was determined by immersion of samples in Clark solution, as described in the ASTM G1-90 standard20. Weight loss by dissolution of the corrosion products was monitored in situ, while the samples
were immersed in Clark solution. For this purpose, samples were hanged on a frame connected to an analytical balance with a resolution of 100µg provided with a RS232 interface for data acquisition and calculation of weight loss during dissolution of oxides (Figure 1). DC and AC components of the samples´ potentials were measured against a saturated CuSO4/Cu electrode in contact with the soil by a lat sponge soaked with saturated CuSO4 solution, using a voltmeter and a Rigol OS1025 oscilloscope. Potentials were measured for connected and unconnected samples positioned close to the tower, as well as for samples distant from the tower.
The Raman spectra of the corrosion products were examined with a Dilor–Jobin Yvon spectrophotometer attached to an Olympus BX60M optical microscope. The laser power on the samples was 9mW, using the 632.82nm line of a He–Ne laser. All spectra were recorded using a pinhole with a diameter of 1000µm, resulting from three accumulations of 5s without ilters.
3. Results and Discussion
Figure 2 shows a weight loss versus time curve obtained
during immersion of corroded samples in Clark solution. Purpose of this solution, deined by ASTM G1-90 standard20, is the dissolution of solid corrosion products formed during exposure to the soil. Clark solution according to ASTM G1-90 consists of HCl, Sb2O3 and SnCl2. Singh et al.
21 describe
the function of its ingredients as follows: Sb2O3 acts as inhibitor for acid corrosion of steel and has an eficiency of 98%. Oxides are dissolved by HCl, according to:
Fe2O3 + 6HCl aq → 2 FeCl3 aq + 3H2O (1)
SnCl2 is thought to accelerate oxide dissolution by reduction of Fe3+, thus shifting the equilibrium of Equation (1) to the right side, according to Equation (2):
2Fe3+ aq + Sn
2+ aq → 2Fe
2+ aq + Sn
4+
aq (2)
The initially faster weight loss in Figure 2 can be attributed to the chemical dissolution of corrosion products. When uncovered, bare metal surface is exposed, the dissolution rate slows down due to inhibition of the acid corrosion and also oscillates. Evolution and detachment of adhered H2 bubbles were observed at this phase and explains the weight oscillation during an electrochemical process of metal dissolution. A self-developed computer program itted in real-time the acquired weight data during dissolution
in the Clark solution with two straight lines, one for the processes of chemical dissolution of corrosion products and another of the acid corrosion of the steel substrate, respectively. The oxide-weight loss was determined from the intersection of these two lines, as shown in Figure 2 and corrected for the buoyancy due to solution displacement by Equation (3a) and converted into metal loss by Equation (3b) as explained below.
The weight loss measured during dissolution in the Clark solution must be corrected by discounting the buoyancy due to solution displacement. For the case that only oxide is dissolved it can be shown that the actual weight loss ∆POx is given by:
∆POx = ∆Pmeas · ρOx /(ρOx - ρSol) = k · ∆Pmeas (3a)
where ∆Pmeas is the measured weight loss during dissolution, ρSol, the speciic weight of the Clark solution (1.26 g·cm
3)20,
ρOx, the speciic weight of the oxide and k, a coeficient as
deined in Equation (3a). Assuming that only lepidocrocite (γ-FeOOH) is formed as corrosion product with a speciic weight ρlepidocrocite = 4.09 ± 0.04 g·cm
–3[22] the constant k in
Equation (3) would be 1.45, while for the formation of goethite (α-FeOOH, ρgoethite = 4.28 ± 0.05 g·cm–3)23 k would change to 1.42. The α/γ relation reported for the corrosion products formed by the atmospheric corrosion of carbon steel ranges from 0.74 to 0.97, besides the formation of amorphous FeOOH[24]. Assuming a α/γ ratio ≈ 1 and that the density of amorphous FeOOH is close to that of α and
γ, a mean value of k = 1.435 can be assumed with an error lower than 2%.
From the weight gain of Fe-oxide formation, as determined using Equation (3a) for the oxide dissolution in Clark solution, the weight loss of Fe due to soil corrosion, ∆PFe, can be calculated as follows:
∆PFe = (MFe/MFeOOH)·∆Pmeas · ρOx /(ρOx - ρSol) = 0,902·∆Pmeas (3b)
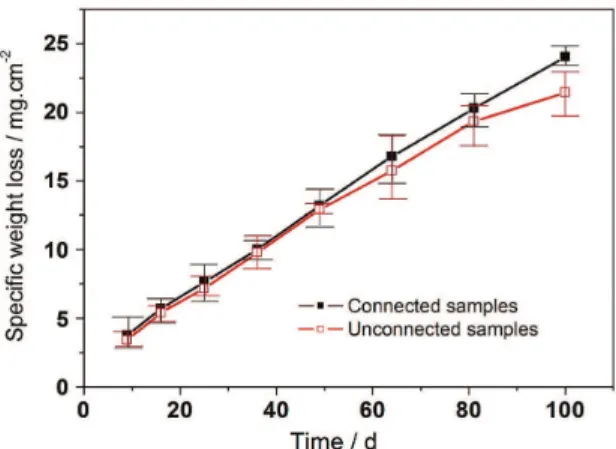
where MFe and MFeOOH are the molar masses of Fe and FeOOH. If only Fe is being dissolved by the Clark solution, as expected for the second part of the dissolution curve of Figure 2, then k in Equation (3a) will assume a value of 0.83. Figure 3 shows the weight loss of samples exposed during a period up to 100 days in the soil. Each point of the diagram represents the average of three measurements. The weight gain of samples connected to the transmission tower is higher than the one shown by unconnected ones. Weight loss by oxide formation of both, connected and unconnected samples follows a time law of exponent lower than one. This becomes more evident in the comparison of corrosion rates in Figure 4, calculated from the slopes (∆M/A)/ Dt at each time interval in Figure 3. The diagram shows that the differences between connected and unconnected samples are higher for short exposure times. Nevertheless, the corrosion rate of the samples connected to the tower remains higher during the whole period of test, revealing a possible inluence of AC signals induced by the transmission tower. The corrosion attack at the buried samples is not uniform. When only the attacked area determined by optical inspection is considered for the weight loss per area, the
Figure 3. Speciic weight loss per geometric area versus exposure time.
Figure 4. Corrosion rate during exposure time of buried samples related to the geometric surface area.
Figure 5. Speciic weight loss per attacked area versus exposure time.
Figure 6. Mean corrosion rate during exposure time per attacked surface and percentage of attacked surface versus total exposure time.
differences between connected and unconnected samples become higher for short exposure periods, as seen in Figure 5. This means that initially a smaller area is attacked at the connected samples. During the entire exposure period of 100 days the corrosion attack spreads laterally over nearly the whole surface (Figure 6, right side). The mean corrosion rate related to the attacked area decreases with the exposure time (Figure 6, left side), thus diminishing the differences between weight losses per geometric (Figure 3) and per attacked area (Figure 5). This behavior is in agreement with the results of other authors, which reported a tendency to more localized corrosion attack in cases of AC corrosion24.
buried in a similar soil at approximately 1km far from transmission lines, were –0.280V (SHE) and –0.200V(SHE), respectively. In comparison with these potentials, which can be considered as reference values for samples not inluenced by AC-corrosion, the corrosion potentials were higher when the sample was buried close to the tower, and still higher when it was electrically connected to the tower. It is evident in the case of the connected samples that under the inluence of the AC-signal the galvanized steel base of the tower has no protective effect on the sample. According to the rectiication model5,6 the AC inluence on the corrosion potential depends on whether the ratio of cathodic to anodic Tafel slopes ba/ bc is >1 or <1. Measurements from Goidanich et al.7 with carbon steel in soil-simulating electrolyte showed ba/bc < 1, which is plausible for a partially transport controlled cathodic reaction and an anodic attack with localized character. For the case ba/bc <1, the theory predicts a shift of the corrosion potential to more negative values under the inluence of AC. However, as in the present ield study
of soil corrosion, Goidanich et al.7 found under laboratory conditions for samples immersed in simulated soil solution a shift of the corrosion potential to more positive values. In accordance with our results, weight loss tests from Goidanich et al.25 confirmed that the higher corrosion
potential under AC inluence led to a higher corrosion rate. The authors mentioned that other results of their work, like independence of current eficiency from experimental conditions are also in conlict with a simple rectiication theory of AC corrosion7,25.
While Goidanich et al.7,25 made tests in well-deined soil simulating electrolytes, soil corrosion in the present study is determined by the combination of a variety of soil parameters and additionally by the climate conditions the soil is exposed to during the corrosion tests. In ield tests, local inhomogeneities of the soil and varying climate conditions can lead to the scattering of the results. In the present study, the error caused by soil inhomogeneities was kept small by burying connected and unconnected samples
Table 1. In-situ AC/DC measurements in the soil.
Sample connected to the tower
Sample beneath the tower, unconnected
Sample at 30m from the tower
Sample at very long distance in similar soil
Frequency 60.2Hz 62.5Hz ~102kHz range
---AC-Amplitude 3.64V 0.20V (spikes 2.2V) < 10mV
---DC-Corrosion Potential
–0.050V(SHE) –0.165V(SHE) -0.280V(SHE) -0.200V(SHE)
Figure 7. Raman spectrum of the corrosion products for AISI 1020 exposed during 64 days connected to the power line tower. Insert:
close to each other. By performing the tests with the two types of samples simultaneously the weather conditions were the same for both types. The measurement of weight loss was made with a computer controlled in situ method. It can be expected that this method gives better results than descaling analysis based on optical inspection with naked eye. Singh et al.21 reported that a weak point of weight loss determinations described by-ASTM G1-9020 is that different types of steel show different rates of acid corrosion in the Sb2O3 inhibited solution. Since in our work all measurements were performed with the same steel, errors are expected to have the same effect on connected and on unconnected samples. The same statement can be made with respect to the inluence of the weather conditions. It can therefore be assumed that the measured differences between connected and unconnected samples are due to the inluence of an induced AC signal.
Although pH, chloride and sulfate concentration and the resulting resistivity of the soil at the test location are considered between mildly and very mildly corrosive, according to ASTM G187-1226, the mean corrosion rate
during 100 days is nearly one order of magnitude above the value considered acceptable for buried pipelines under cathodic protection (0,01mm/year). The measured values are in reasonable agreement with weight loss measurements from Barbalat et al.27, who found a corrosion
rate around 0,1mm/year during 75 days in a soil with similar characteristics.
Figure 7 shows the Raman shift spectra acquired on the AISI 1020 after an exposure time of 64 days connected to the power line tower. Normalized schematic Raman spectra of possible corrosion products were extracted from the literature28 and plotted schematically on the insert of Figure 7. Similarly to what is observed for other cases of corrosion of carbon steel, such as corrosion in humid atmospheres24, in aerated solutions29, as well as soil corrosion of unpolarized buried steel30, the main corrosion
product observed in the present work was lepidocrocite
(γ-FeOOH) followed by goethite (a-FeOOH) and in a lower intensity also magnetite (α-Fe3O4). No signiicant differences could be observed between Raman spectra of connected and unconnected samples under the inluence of induced AC signal.
4. Conclusions
It is today generally accepted in the scientiic community that AC signals from high voltage power lines can inluence the corrosion of nearby installed protected metallic structures like pipelines. In these cases locally high current densities might pass through small defects of the protective coatings. While it seems to be consolidated that the rate of AC corrosion increases with the increase of the amplitude of AC density, thus predicting risks for damaged coatings, the existence of a safe lower limit of the amplitude is still in question. Equivalent studies of the AC inluence on the metallic structure of the transmission towers itself had not been reported so far in the literature. Our ield studies have qualitatively shown that the AC signal can also inluence the corrosion of the buried metallic structure of the transmission tower, although the AC is not conined to coating defects and might have, therefore, a much lower amplitude.
The tests with AISI1020 steel samples simulate a situation when the buried galvanized steel structure of the tower has already lost its zinc protection and accelerated corrosion of the ferrous base material takes place. Corrosion rates, measured by weight loss, were above the acceptable lower limit for buried metal structures. To quantify the real risks that emanate from the AC inluence, the local signal has to be monitored and controlled lab tests with similar conditions have to be performed.
Acknowledgments
The authors are grateful for inancial support by CEEE – Companhia Estadual de Energia Elétrica, Porto Alegre,
Brazil and ANEEL-Angência Nacional de Energia Elétrica.
References
1. Heim G, Peez G. Wechselstrombeeinflussung einer kathodisch
geschützten Erdgashochdruckleitung. 3R International. 1988; 27:345-351.
2. Helm G, Heim Th, Heinzen H, Schwenk W. Investigation of
corrosion of cathodically protected steel subjected to alternating currents. 3R International. 1993; 32(5):246-250.
3. Bindschedler D, Stalder F. Wechselstrominduzierte
Korrosionsangriffe auf eine Erdgasleitung. Gas, Wasser, Abwasser: GWA. 1991; 71:307-313.
4. Kirkpatrick EL. Basic concepts of induced alternating current
voltages on pipelines. Materials Performance. 1995; 34:14-18. 5. Bertocci U. AC induced corrosion: the effect of an alternating
voltage on electrodes under charge-transfer control. Corrosion. 1979; 35(5):211-215. http://dx.doi.org/10.5006/0010-9312-35.5.211.
6. Lalvani SB and Lin X. A revised model for predicting corrosion of materials induced by alternating voltages. Corrosion Science. 1996; 38(10):1709-1719. http://dx.doi.org/10.1016/
S0010-938X(96)00065-0.
7. Goidanich S, Lazzari L and Ormellese MAC. Corrosion. Part 1: effects on overpotentials of anodic and cathodic processes.
Corrosion Science. 2010; 52(2):491-497. http://dx.doi. org/10.1016/j.corsci.2009.10.005.
8. Jones DA. Effect of alternating current on corrosion of low
alloy and carbon steels. Corrosion. 1978; 34(12):428-433. http://dx.doi.org/10.5006/0010-9312-34.12.428.
9. Pourbaix A, Carpentiers P and Gregor R. Detection of AC corrosion. In: Eurocorr 2001; 2001; Riva del Garda, Italy.
2001. Paper 228.
10. Büchler M, Schöneich H-G and Stalder F. Discussion of criteria
to assess the alternating current corrosion risk of cathodically
protected pipelines. In: Proceedings of the 15th Joint Technical Meeting on Pipeline Research; 2005; Orlando, USA. Pipeline
Research Council International; 2005. Paper 26.
11. Büchler M, Voûte C-H and Joos D. Effect of variation of cathodic protection level over time on the a.c. corrosion process. In: CEOCOR International Congress; 2012; Luzerne,
Switzerland. 2012. Paper 19.
12. Brenna A, Lazzari L and Ormellese M. AC interference
a two-steps-mechanism. In: Eurocorr 2013; 2013; Estoril,
Portugal. 2013. Paper O-1672.
13. Fu AQ and Cheng YF. Effect of alternating current on corrosion
and effectiveness of cathodic protection of pipelines. Canadian Metallurgical Quarterly. 2012; 51(1):81-90. http://dx.doi.org/ 10.1179/1879139511Y.0000000021.
14. Pourbaix A, Tribollet B and Nogueira R. Interpretation of
instantaneous true potentials in ac induced corrosion. In:
Eurocorr 2013; 2013; Estoril, Portugal. 2013. Paper O-1293. 15. Sibila J. Mitigation of alternating current interference on buried
steel pipeline. In: Eurocorr 2013; 2013; Estoril, Portugal. 2013.
Paper O-1488.
16. Collet E, Delores B, Gabillard M and Ragault I. C Corrosion due to AC influence of very high voltage power lines on polyethylene-coated steel pipelines: evaluation of risks: preventive measures. Anti-Corrosion Methods and Materials. 2001; 48(4):221-226. http://dx.doi.org/10.1108/ EUM0000000005629.
17. Wigdor M. Electric ields under power lines: supplement
to an examination of electric field under EHV overhead power transmission lines. Silver Spring: Office of Radiation
Programm, US Environmental Protection Agency; 1980. 18. Wojcicki FR, Negrisoli MEM, Franco CV. Stray current
induced corrosion in lightning rod cables of 525 kV power lines towers: a case study. Revista de Metalurgia. 2003; 39:124-128.
19. American Iron and Steel Institute – AISI. AISI 1020 (UNS G10200) specification. In: Society of Automotive
Engineers, editor. SAE Handbook. Warrendale; 1986.
20. American Society for Testing and Materials – ASTM. ASTM G1-90: standard practice for preparing, cleaning and evaluation corrosion test specimens. Philadelphia; 1992.
21. Singh DDN and Kumar A. A Fresh look at ASTM G1-90 Solution Recommended for Cleaning of Corrosion Products Formed on Iron and Steels. Corrosion. 2003; 59(11):1029-1036. http://dx.doi.org/10.5006/1.3277521.
22. Mindat. Lepidocrocite. Available from: <http://www.mindat.
org/min-2379.html>. Access in: 31/05/ 2014.
23. Mindat. Goethite. Available from: <http://www.mindat.org/
min-1719.html>. Access in: 31/05/ 2014.
24. Katsuhiko A. Characterization of rust layers on a plain-carbon steel and weathering steels exposed to industrial and coastal
atmosphere for years. In: Waseda Y and Suzuki S, editors.
Advances in materials research: characterization of corrosion products on steel surfaces. Berlin: Springer; 2006.
25. Goidanich S, Lazzari L and Ormellese MAC. Corrosion.
Part 2: parameters influencing corrosion rate. Corrosion Science. 2010; 52(3):916-922. http://dx.doi.org/10.1016/j. corsci.2009.11.012.
26. American Society for Testing and Materials – ASTM. ASTM G187-12a: standard test method for measurement of soil resistivity using the two-electrode soil box method. West Conshohocken; 2012.
27. Barbalat M, Lanarde L, Caron D, Meyer M, Vittonato J, Castillon F, et al. Electrochemical study of the corrosion rate of carbon steel in soil: Evolution with time and determination
of residual corrosion rates under cathodic protection. Corrosion Science. 2012; 55:246-253. http://dx.doi.org/10.1016/j. corsci.2011.10.031.
28. Downs RT. The RRUFF Project: an integrated study of the
chemistry, crystallography, Raman and infrared spectroscopy
of minerals. In: Program and Abstracts of the 19th General Meeting of the International Mineralogical Association; 2006;
Kobe, Japan. 2006. O03-13.
29. Misawa T, Hashimoto K and Shimodaira S. The mechanism of
formation of iron oxide and oxyhydroxides in aqueous solutions at room temperature. Corrosion Science. 1974; 14(2):131-149.
http://dx.doi.org/10.1016/S0010-938X(74)80051-X. 30. Córdoba vc, Mejía MA, Echeverría F, Morales M and
Calderón JA. Corrosion mitigation of buried structures by soils