Key words: metric complementary, DNL, airport noise.
Palavras-Chave: métrica complementar, DNL, ruído aeroportuário.
Recommended Citation
This paper is downloadable at dx.doi.org/10.1590/2238-1031.jtl.v8n4a12
■JTL|RELIT is a fully electronic, peer-reviewed, open access, international journal focused on emerging transport markets and published by BPTS - Brazilian Transport Planning Society. Website www.journal-of-transport-literature.org. ISSN 2238-1031.
* Email: [email protected].
Research Directory
Submitted 6 Jul 2013; received in revised form 14 Apr 2014; accepted 8 Jun 2014
A complementary metric to define
a buffer zone in Brazilian airports
[Uma métrica complementar para definir uma zona tampão em aeroporotos brasileiros]
Federal University of Rio de Janeiro - Brazil
Resumo
A legislação sobre o ruído de aeronaves no Brasil reconhece a métrica DNL como a única ferramenta para implementar zoneamento de ruído em aeroportos. Este artigo analisa a importância da adoção de uma métrica auxiliar para caracterizar os impactos do ruído das aeronaves em construções específicas sensíveis ao ruído, especialmente na análise de interferência na fala e nos distúrbios do sono. Foi utilizado neste trabalho uma métrica complementar, LAeq, associada a norma brasileira de controle da poluição sonora, NBR 10151 (Avaliação do ruído em áreas habitadas para o conforto da Comunidade). Uma curva de controle baseada no LAeq e na norma foi criada e a área tampão entre a curva de controle e o DNL 65dB(A) foi o objeto de estudo deste trabalho. Os resultados mostraram um número elevado de pessoas que são atingidas pelo ruído aeronáutico e são desprezadas pelas autoridades públicas, só no aeroporto de Congonhas este número atinge a marca de 596.808 pessoas. A adoção da métrica complementar tem o intuito de auxiliar os tomadores de decisão na identificação das pessoas altamente incomodadas pelo ruído aeronáutico, permitindo a criação de medidas de mitigação nas áreas afetadas.
Carvalho, L. A., Slama, J. G. and Nassi, C. D. (2014) A complementary metric to define a buffer zone in Brazilian airports. Journal of Transport Literature, vol. 8, n. 4, pp. 316-328.
Luiz André de Carvalho*, Jules Ghislain Slama, Carlos David Nassi
Abstract
The legislation on aircraft noise in Brazil recognizes the DNL metric as the only tool to perform noise airport zoning. This paper examines the importance of adopting an auxiliary metric to characterize the impacts of aircraft noise at a specific building sensitive to noise, especially in analysis of speech interference and sleep disturbance. A complementary measure, LAeq, associated with the Brazilian standard for controlling noise pollution, NBR 10151 (Assessment of noise in inhabited areas, for Community comfort), was used in this work. A control curve based the LAeq and on the standart was created and the buffer area between the control curve and DNL 65dB (A) was the object of study of this work. The results showed a high number of people who are affected by aircraft noise and are despised by the public authorities, only at Congonhas airport this number reaches the mark of 596,808 people. The adoption of complementary metric is intended to assist decision makers in identifying people highly annoyed by aircraft noise, allowing the creation of mitigation measures in the affected areas.
ISSN 2238-1031
Introduction
This paper seeks to clarify the importance of using additional metrics, particularly those
describing the noise impacts in places or situations sensitive to specific noises. The history of
aircraft noise is intimately linked to the rise of aviation, however only from the 50s, with the
emergence of large commercial jet aircraft and the increase the number of movements, this
impact has been considered as critical. This rationale explains the reasons that motivated the
National Civil Aviation Agency - ANAC - to propose the Brazilian Civil Aviation Regulation
- standard RBAC 161, "Zoning Plan Noise - PZR".
The proposal RBAC161 replaces Ordinance No.1.141/GM5 of December 8, 1987, which
describe Noise Zoning Plans – PZR which can be Basic (PBZR) or Specific (PEZR).
The PBZR is developed based on operational profiles standardized and it consists of simplified
geometric curves to facilitate the implementation of the Plan to small aerodromes, with fewer
aircraft movements and don't have the resources to prepare PEZR.
The PEZR is drawn using INM© (Integrated Noise Model) software from specific operating
profiles in order to better represent the physical and operational characteristics of each airport.
It defines more precisely in the Zoning limits the land uses which are compatible and
incompatible with aircraft noise levels, with consequent less harm to society.
The DNL metric, or "day and night noise level", was chosen for the preparation of PEZR noise
curves for possessing several advantages, such as: being widely used for aircraft noise issues;
correlated with Highly Annoyed People Percentage (Shultz, 1978); DNL based Airport Zoning
Protection of the airport from encroachment.
However, one of the major problems of forecasting models DNL is that they tend to degrade in
accuracy at great distances from airports. At the airport zoning, areas sensitive to noise are
prohibited to level noise exceeding 65dB(A), but in practice, lower levels can cause annoyance
too, it can’t be considered as the only boundary between residential and non-residential areas
(Slama, 2008).
The DNL metric is not compatible with the sensitivity to noise that is observed at ground level
(as is the NBR 10151) in the vicinity of airports, but with the noise of aviation. This detail is
usually only realized after insertion of the curve DNL noise 65dB (A) at the airport, where
experts note (and are surprised) that millions of people that living outside the proposed curve
have some level of discomfort (usually high) in relation to airport noise.
Much of the criticism of the use of DNL to measure the nuisance of communities (U.S. EPA,
1978) and the compatibility of land use around airports stems from the inability to understand
the basis for the measurement or calculation of this metric.
Metrics derived from the Brazilian standard NBR 10151 - the LaeqD (Day Equivalent Sound
Level) and LAeqN (Night Equivalent Sound Level) provide a sound average for each period of
the day, unlike the DNL, used in PEZR (specific plan zoning noise ) that calculates curves for
a 24 hour period.
To obtain the auxiliary proposal curve to the DNL , were made correlations in the INM© with
standard NBR 10151, LaeqD and LAeqN, generating new values compatible with the standard
that can be used by regulatory agencies and municipalities as a tool for the study of noise airport
around airports.
It is expected that the results obtained may be useful in the planning of Brazilian airports,
regarding nuisance that people feel in relation to aircraft noise. And they can also assist in
expanding and modernizing them.
In the next topic will be addressed in more detail the relationship between complementary
metric chosen and the NBR 10151. Then, the methodology of this study will be displayed,
showing the calculations for obtaining the control curve and the respective LaeqD and LaeqN
curves from airport to be studied. Soon after, a case study would be presented, defining: the
choice of the airport studied; the definition of critical points; the localization of critical points
within the proposed curve and analysis of results. Finally, the conclusion, interpreting the
results and extolling the scientific contribution of this work.
1. Adoption of a Supplementary Metric X from NBR10151 Brazilian
standard
Some land uses sensitive to noise, referred in this article as critical points (schools, churches,
hospitals and the like) are within or adjacent regions defined by the interior of the curves DNL
noise 65dB(A), for an accurate analysis is helpful to adopt auxiliary metrics (additional) to
determine the impacts of aircraft noise cause in these specific sites.
Slama et al. apud Revoredo (2011) mentions that besides the feeling of discomfort, the airport
noise has many adverse effects of which the most important are: the interference in
communication during the day and sleep disturbance during the night.
In Brazil, urban regulations for the control of noise pollution are based on the criteria shown in
standard ABNT1 NBR 10151 for daytime and night-timeperiods, see Table 1. The columns 2
and 3 represent the standard evaluation noise criteria levels for daytime and night time periods
in each area.
Table 1 - Level Assessment Criteria (NCA) for outdoors, in dB(A)2
Types areas NCA
Diurnal
NCA Nightly
Areas of farms and ranches 40 35
Strictly residential area or hospitals or schools 50 45
Area mixed, predominantly residential 55 50
Mixed area, a commercial and administrative 60 55
Mixed area with recreational vocation 65 60
Predominantly industrial area 70 65
This paper will propose a new curve using a complementary metric, compatible with the
Brazilian Standard NBR 10151 seen in Table 1. It is not intended to create a new zoning with
this curve, but a simple alternative of monitoring of aircraft noise on the part of municipalities,
since that they adopt that standard, and easy to understand for the general public.
It was decided in this study to use the complementary metric LAeq, divided into LAeqD (for
the period Daytime) and LAeqN (for nighttime) as the instrument for obtaining this new
1Brazilian Association of Standart Techniques
2 #Source: NBR ABNT 10151.
proposed curve. It should be noted that this article will only concern the critical points (schools,
hospitals, churches, etc.) and not residential areas, since the problem of encroachment in Brazil
be considerable.
Dinato et al (2014) cited the LAeq and the SEL as complementary standards to the DNL to
make the simulation of the acoustic noise in the vicinity of Ribeirão Preto airport but decided
to apply the DNL in accordance with the regulations of RBAC161 of ANAC. Júnior et al
(2012) used the SEL, the LAeq and the Lmax to measure the effect of aircraft noise on people
around the Congonhas airport, not as a supplementary measure to the DNL. This paper, instead,
the complementary curve will become an additional tool for decision makers in time to propose
measures to mitigate noise around airports.
The encroachment or illegal occupation, besides generate environmental damage by dumping
of solid and liquid waste, interferes with airport operations and with routines and operational
aspects and safety (flight procedures), being a cause of constant surveillance (CAEP, 2003).
This problem exists in most airports managed by Infraero3, mainly in Congonhas airport, a
major Brazilian airports.
2. Methodology
This study is divided into 4 parts. The first is the use of additional metrics chosen, the LAeq, to
calculate the control curve proposed in this article. For the purpose of calculation the noise level
at a critical receiver using LAeq, it is necessary to determine the period of time that is
considered for the calculations. In this article was used the LaeqD (in order to consider the
entire daytime period, from 7am to 22pm) and LaeqN (in order to consider the night period,
from 22h to 7am the next day). The main purpose for the adoption of this metric is that it along
with the DNL would assist local authorities in decisions about managing land use and zoning
around the airport, due to its compatibility with urban Brasilian Legislation on Noise Pollution
control.
3 Airport Infrastructure Brazilian Company
Considering the characteristics of noise and according to Table 1 was adopted in place of
(daytime) NCA (Assessment Noise Criteria) the value of LAeqD and in place (night time) NCA
the value of LAeqN.
The fundamental relationship between DNL, LAeqD and LAeqN for noise at a critical receptor
located in the vicinity of an airport can be described according to the following equation:
��� = log 4[ 5� �����+ 9 � �����] (1)
Whereby:
LAeqD = Equivalent sound level for daytime;
LAeqN = Equivalent sound level for the night time;
DNL = level day-night average sound.
Considering the Table 1 of standard ABNTNBR10151, from the values of LAeqD and
LAeqN it is possible to determine the value of DNL for each area from equation 1, the results
can be seen in Table 2.
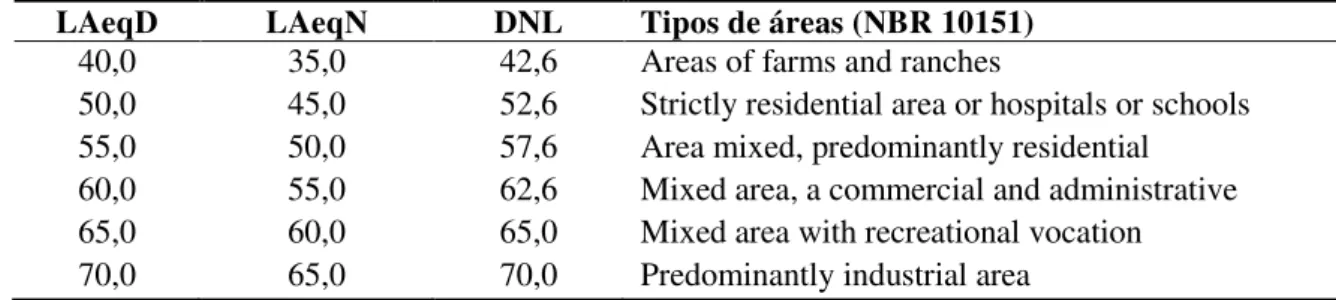
Table 2 - Results in DNL from equation1 of Table 1, dB(A)
LAeqD LAeqN DNL Tipos de áreas (NBR 10151)
40,0 35,0 42,6 Areas of farms and ranches
50,0 45,0 52,6 Strictly residential area or hospitals or schools 55,0 50,0 57,6 Area mixed, predominantly residential 60,0 55,0 62,6 Mixed area, a commercial and administrative 65,0 60,0 65,0 Mixed area with recreational vocation 70,0 65,0 70,0 Predominantly industrial area
It can be observed that the level DNL 52.6dB(A) in the NBR 10151 corresponds to the upper
limit for the strictly urban residential areas or hospitals or schools. Having this curve DNL
52.6dB(A) as a limit of a control area, noise mitigation measures would be adopted. Another
great advantage is that it would define a buffer zone between DNL 52.6dB(A) and DNL
65dB(A), where the critical receptors would be identified and monitored providing adequate
acoustical treatments, without the need to create a new PZR. Below the DNL 52.6dB(A) there
is no restrictions for the installation of noise sensitive activities.
The airport chosen for the study is Congonhas International Airport, located in São Paulo which
is Brazil’s largest city, being historically considered the primary airport in the region. The main feature of this airport is its population concentrated unduly around. In Figure 1 it is possible to
identify the three curves of the study.
Figure 1 - DNL= 52.6dB(A), LAeqD=50dB(A) and LAeqN=45dB(A)
on the Congonhas airport4
2.1 Congonhas Airport
In the second part, was chosen the airport being studied, the Congonhas Airport. Created in
1936, today has numerous restrictions of operations at various levels ranging from the operating
hours limit until run up motors testing, completely invalidating its expansion.
Table 3 - Congonhas Airport5
Airport Site 1.647.000 m2
Aircraft Site 77.321 m2
Runway Dimensions (1) 1640 x 45 m
Auxiliary Runway Dimensions (2) 1345 x 45 m Passenger Capacity (2012) 16.775.785
Passenger Terminal Area 64.579 m2
Aircraft Parking Positions 29 positions
4 # Source: Study Group in Airport Noise – GERA (2013) 5# Source: Infraero (2013)
2.2 Definition of Critical Points
The third part of the study, sought to identify the critical points. The critical points mentioned
were the "chosen" because they are considered noise sensitive buildings. For this paper were
selected nine spots, as can be seen in Table 4, selected from educational and health institutions.
For these points, noise levels at the metrics DNL, LAeqD and LAeqN, were calculated, with
the help of software INM©6.
INM© is used to evaluate the noise impact resulting from the expansion or construction of new
runways to landing and takeoff, new traffic demands and composition of the fleet of aircraft,
routes and revision of aerospace structures, alternative flight profiles and changes in other
operating procedures (FAA, 1996).
The justification for adoption of INM© is by its wide use in studies of noise from the airport
activity and is widely recommended by the FAA.
2.3 Insertion of Critical Points on the proposed Curve
The fourth part of the study was to insert the critical points in the proposed curve. Selected
points provide important information on how behave critical points and how curve DNL
65dB(A), defined by the ANAC7 and the FAA how limit for installation of critical points and
residential, has no sufficient to characterize the noise situation in Brazil. Figure 2 below,
illustrates the information that has been discussed above, it contains the following information:
the smaller curve is the curve DNL 65dB(A) suggested by the Administrator and the FAA, the
larger curve is the curve DNL 52.6dB(A), suggested by this article as a new reference for local
governments and for aeronautics for the acoustic treatment of buildings at critical points and
the black dots represent the respective critical points chosen for this study.
6INM© is a computer model developed by the Federal Aviation Administration (FAA) that evaluates aircraft noise
impacts in the vicinity of airports. It is based on an algorithm from the Society of Automotive Engineers e Aerospace Information Report 1845 standard (Procedure for the Calculation of Airplane Noise in the Vicinity of Airports).
7National Agency of Civil Aviation.
Figure 2 - Curves noise of 65 and 52.6dB(A) and critical points
on the Congonhas airport8
The tool chosen for obtaining satellite information about land uses was Google Earth©9, with
satellite information it becomes possible to identify places, buildings, cities, landscapes, among
other elements. In Table 4it is possible to identify the nine critical points chosen, seen in Figure
2, georeferenced by this tool.
Table 4 - Geographic coordinates of critical points chosen
8 # Source: Study Group in Airport Noise – GERA (2013)
9Computer program developed and distributed by the American company Google. Google Earth© displays a three
dimensional model of the globe, constructed from mosaics of satellite images obtained from different sources, aerial images (photographed aircraft) and 3D GIS. The program can be used simply as a generator of two-dimensional maps and satellite images or as a simulate or of these diverse landscapes on Earth. This makes it possible to identify places, buildings, cities, landscapes, among other elements.
Critical Points Latitude Longitude
College Paulicéia -23.625051 -46.665013
College Maria Montessori -23.608879 -46.661807
University Ibirapuera -23.610175 -46.664051
College Augusto Laranja -23.612482 -46.66915
College Linus Pauling Ed.Inf. -23.637923 -46.654451
Hospital N.S. de Lourdes -23.644006 -46.643381
CMI medical clinic -23.64448 -46.643608
Hospital Centenário -23.609795 -46.665012
HCI medical clinic -23.608529 -46.666718
3. Results
3.1 Analysis of results
The results of Figure 2show that the area in the interior of the curve DNL 65dB(A) does not
adequately cover all the critical points. Proposal curve DNL 52.5 dB(A), based on NBR 10151,
thus becomes an excellent tool for decision makers because the area of your curve is greater
and is covering all critical points selected, another big advantage is that it approaches the area
where are located almost all complaints about aircraft noise. The residents of the city of
Diadema, for example, located in the south of Congonhas Airport were not covered by the curve
DNL 65dB(A), now with the curve DNL 52.6dB(A) which provides a more realistic situation,
are covered in a extensive area of their municipality by curve proposal, as seen in Figure 3.
Figure 3 - Curves noise of 65 and 52.6dB(A) and critical points on the right Congonhas
airport. City of Diadema inserted curve DNL 52.6dB(A) to the left10
It is Importantly to remember that article deals only with critical points mentioned above, but
as is knowledge to all, the greater the population density in a region the greater be the amount
of services it, and consequently of critical points. In Table 5 it is possible to identify what has
10 # Source: Study Group in Airport Noise – GERA (2013)
been explained above, the results were obtained with the aid of INM© and of a tool SIG.
(TransCAD©11).
Table 5 - Relationship area versus estimated population
in relation to the DNL values in dB(A)
Population within the risk area
City DNL Estimated Population AreaCurve
São Paulo 65dB(A) 54.732 7,55km2
São Paulo 52,6dB(A) 566.897 56,28km2
52,6dB(A) ∩ 65dB(A) 512.165 48,73km2
Diadema 52,6dB(A) 84.643 7,89km2
At the intersection of In the region between the two curves it is possible to verify the existence
of a significant amount of people suffering from the direct influence of airport in their lives
and that they are ignored by the authorities, this number is nearly 10 times the number of people
inside the curve DNL 65dB(A). It may also be noted that only the curve DNL 52.6dB(A)
provides data for the city of Diadema, in which one can identify a considerable number of
people in risk areas.
Conclusions
This paper showed the importance that an additional metric to the DNL presents in defining
areas of risk. With the choice of LAeq, a metric compatible with NBR 10151, was possible to
identify a considerable number of people within the area of risk between the control curve DNL
65dB (A) and curve proposed DNL 52.6 dB (A). And where there are people, there are critical
points (schools, hospitals, churches etc.), this article allows the responsible authorities identify
and if necessary remove the critical points to areas outside of hazardous areas, adopting
mitigation measures noise if necessary.
It is extremely positive the need for constant monitoring of aircraft noise around airports,
including dissemination of results, so that they can forward solutions to the problems
concerning the acoustic comfort of buildings. Also, assisting in the evaluation of chronic
11Transcad© works in vector form, enabling the use of various layered files provided by the Brazilian Institute of
Geography and Statistics (2013) and can befreely accessed.
exposure in the elderly, children and adolescents, and their possible effects, such as: speech
intelligibility, sleep interference and disorders in school activities.
It is observed that the constructive pattern of most critical points, in general, is the same used
in other areas of the city that are not located in the flight path of aircraft from Congonhas airport,
in other words, have no acoustic quality to soften the effect of aircraft noise.
According to ANAC the reference american DNL 65dB(A) was adopted by RBAC by reason
of being successfully employed for longer and provide better conditions for suitability to the
national urban context and be more compatible with the constructive characteristics of the
buildings present in the Brazilian environment. The article cites the importance of adopting
additional measures for critical points in Brazil, showing that the Brazilian reality differs U.S.,
mainly because ofencroachment.
The ANAC should propose policies to help the federal and state governments to establish
policies and practices to minimize noise sensitive around airports, including areas outside of
the curve DNL 65dB(A). The uses of additional metrics along with the DNL, provide benefits
in relation to what is practiced today, such as: better describe the noise exposure for the general
public can easily understand, facilitate a better public participation process to consider
alternatives that lead to a consensus and allow authorities to select and implement a more
effective noise reduction with mitigation measures.
This article proposes that only receive acoustic critical points inserted in the interior of the
proposed curve, since there is no interest of the authorities to solve totally the problem of
encroachment around airports.
Acknowledgments
We appreciate the collaboration of GERA (Airport Noise) Study Group/COPPE/UFRJ, and the support
given by CNPq (Scientific and Technological Development National Council) and by CAPES
(Coordination of Improvement of Higher Education Personnel).
References
Associação Brasileira de Normas Técnicas - ABNT, NBR 10151. (2002) Avaliação do ruído em áreas habitadas, visando o conforto da comunidade - Procedimento. Associação Brasileira de Normas Técnicas, Rio de Janeiro, Brasil.
Agência Nacional de Aviação Civil - ANAC. (2011) Regulamento Brasileiro da Aviação Civil, RBAC no 161, EMENDA no 00. Planos de Zoneamento de Ruído de Aeródromos – PZR, Brasil.
Brasil. Portaria MAer. N. 1141/GM5 (1987) – Dispõe sobre zonas de proteção e aprova o Plano Básico de Zona de Proteção de Aeródromos, o Plano Básico de Zoneamento de Ruído, o Plano Básico de Proteção de Helipontos e o Plano de Proteção de Auxílios à Navegação Aérea e dá outras providências. Ministério do Estado da Aeronáutica.
Caliper (2007) TransCAD transportation GIS software: User’s guide. Version 4.8. Massachusetts: Academic License, Newton.
CAEP. (2003) Methodology for Encroachment calculation: an application to Brazilian airports.
Committee on Aviation Environmental Protection. Working Group 2: Airports and Operations.
Bern, Switzerland.
Dinato, A. C., Schaal, R. E. (2014) Simulation of aircraft noise in the surroundings of the Ribeirão Preto airport. Journal of Transport Literature, vol. 8, n. 1, pp. 285-303.
Empresa Brasileira de Infraestrutura Aeroportuária – INFRAERO (2013) Normas e regulamentos. Rio de Janeiro: INFRAERO. Disponível em: < www.infraero.com.br>.
FAA. (1996) Integrated Noise Model, User’s Guide versão 5.1. Federal Aviation Administration. Washington DC, USA.
FAA. (1985) Aviation Noise Effects. US Department of Transportation, Office of Environmental and Energy. Washington DC, USA.
Fernandes, J. C. (2002) Acústica e Ruídos. Apostila do curso básico de Pós-Graduação em engenharia mecânica da faculdade de engenharia da Unesp. Bauru, Brasil.
ICAO. (2004) Final draft of Guidance on the Balanced Approach to Aircraft Noise Management.
Montreal, Canada.
Júnior, E. B. C., Garavelli, S. L., Maroja, A. M. (2012) Análise dos efeitos do ruído aeronáutico em zonas residenciais circunvizinhas ao Aeroporto Internacional de Brasília. Journal of Transport Literature, vol. 6, n. 4, pp. 59-81.
Nussenzveig, H. M. (2004) Curso de Física Básica. vol. 2. São Paulo, Brasil.
Schultz, T. J. (1978) Synthesis of social surveys on noise annoyance. Journal of the Acoustical Society of America, vol. 64, n. 2, pp. 377-405.
Slama, J. G., Mora-Camino, F. A. C. and Revoredo, T. C. (2008) Is DNL appropriate for airport noise zoning. In: European conference on Noise Control. Paris, French.
Revoredo, T. C. (2011) Estimação dinâmica do ruído aeronáutico utilizando sistemas diferencialmente planos e redes neurais artificiais. Tese (Doutorado em Engenharia Mecânica), Universidade Federal do Rio de Janeiro. Rio de Janeiro, Brasil.
U.S. EPA. (1978) Information on Levels of Environmental Noise Abatement and Control.
Environmental Protection Agency Report 550/9-79-100. Washington DC, USA.