ORIGINAL ARTICLE
DOI: 10.1590/1516-3180.2013.1314451Obstructive sleep apnea syndrome: complaints and
housing characteristics in a population in the United States
Síndrome de apneia obstrutiva do sono: queixas e características
da habitação em uma população dos Estados Unidos da América
Khalil Ansarin
I, Leyla Sahebi
II, Siamak Sabur
IIITuberculosis and Lung Disease Research Center, Tabriz University of Medical Sciences, Tabriz, Iran
ABSTRACT
CONTEXT AND OBJECTIVE: Obstructive sleep apnea syndrome (OSAS) is one of the leading causes of morbidity and mortality in adults. Early detection of the disorder and discovery of risk factors through standardized questionnaires will lead to reduction of the OSAS burden. The main aim of this study was to estimate the prevalence of OSAS symptoms and examine their association with housing characteristics.
DESIGN AND SETTING: Cross-sectional study at a medical school.
METHODS: Demographic, housing and body measurement data on 5,545 individuals aged 16 years and over of various races were selected from the National Health and Nutrition Examination Survey. We ana-lyzed the probability of OSAS based on habitual snoring combined with daytime sleepiness and/or wit-nessed apnea. Univariate and multiple linear regression were used.
RESULTS: 9.8% of the men and 6.9% of the women reported symptoms suggestive of OSAS (habitual snor-ing, daytime sleepiness and/or apnea). The following prevalences of symptoms were found among males and females respectively: frequent snoring 35.1%, 22.3%, excessive daytime sleepiness 6.4%, 3.4% and fre-quent apnea 14.9%, 20.6%. Using multiple linear regression, OSAS symptoms were correlated with gender, age, body mass index (BMI), marital status and education. Regarding housing characteristics, mildew or musty smell and pets in the environment were associated with a high probability of OSAS.
CONCLUSION: OSAS symptoms were more prevalent than in developing countries. The environment was an important risk factor, but environmental factors are easier to control and manage than other variables like BMI or socioeconomic status.
RESUMO
CONTEXTO E OBJETIVO: Síndrome de apneia obstrutiva do sono (SAOS) é uma das principais causas de morbidade e mortalidade em adultos. Detecção precoce da doença e descoberta de fatores de risco com questionários padronizados levarão a redução dos danos por SAOS. O principal objetivo deste estudo foi estimar a prevalência de sintomas de SAOS e examinar sua associação com características da habitação.
TIPO DE ESTUDO E LOCAL: Estudo transversal em faculdade de medicina.
MÉTODOS: Dados demográicos, habitacionais e de medidas corporais sobre 5.545 indivíduos de 16 anos ou mais, de diversas raças, foram selecionados do National Health and Nutrition Examination Survey. Ana-lisamos a probabilidade de SAOS com base no ronco habitual combinada com sonolência diurna e/ou apneia testemunhada. Análise univariada e regressão linear múltipla foram usadas.
RESULTADOS: 9,8% dos homens e 6,9% das mulheres relataram sintomas sugestivos de SAOS (ronco habi-tual, sonolência diurna e/ou apneia). A prevalência de sintomas em homens e mulheres, respectivamente, foi: ronco frequente 35,1%, 22,3%, sonolência excessiva diurna 6,4%, 3,4% e apneia frequente 14,9%, 20,6%. Através de regressão linear múltipla, sintomas de SAOS foram relacionados com gênero, idade, índice de massa corpórea (IMC), estado civil e educação. Das características da habitação, mofo ou cheiro de mofo e animais de estimação no ambiente foram associados com alta probabilidade de SAOS.
CONCLUSÃO: Sintomas de SAOS foram mais prevalentes do que nos países em desenvolvimento. O meio ambiente foi um fator de risco importante, porém é mais fácil controlar e manejar fatores ambientais do que outras variáveis, como IMC ou status socioeconômico.
IMD. Internist, Pulmonologist and Chairman of
Tuberculosis and Lung Disease Research Center, Tabriz University of Medical Sciences, Tabriz, Iran.
IIMSc. Doctoral Student of Epidemiology,
Tuberculosis and Lung Disease Research Center, Tabriz University of Medical Science, Tabriz, Iran.
IIIMD, PhD. Assistant Professor of Clinical
Epidemiology and Medicine, Department of Clinical Epidemiology, School of Dentistry, Shahid Beheshti University of Medical Sciences, Tehran, Iran.
KEY WORDS:
Sleep apnea, obstructive. Housing.
Nutrition surveys. Snoring. United States.
PALAVRAS-CHAVE:
Apnéia do sono tipo obstrutiva. Habitação.
Inquéritos nutricionais. Ronco.
INTRODUCTION
Obstructive sleep apnea syndrome (OSAS) is a considerable issue in public health. It is a highly prevalent disorder among middle-aged adults1 and is independently associated with certain risk factors. It is also related to many medical conditions such as hypertension, cardiovascular morbidity and mortality, coronary insuiciency, stroke, type 2 diabetes and pulmonary disease.2-5 Untreated OSAS can cause road accidents,1 loss of work produc-tivity,5 occupational injuries1 and even sudden death.4 herefore, this disorder may lead to a huge multilateral problem unless proper control and management is implemented. he prevalence of obstructive sleep apnea among adults in the Western world ranges from 3% to 28%,5 and in the United States of America (USA), the prevalence is currently estimated to be 5% to 10%.6,7
he prevalence of OSAS in some studies based on various questionnaires has been reported as follows: based on the Berlin Criteria, in New Zealand (2009) 2.8%,2 Iran (2011) 4.9%8 and USA (2006) 26%;5 based on a self-reported questionnaire, in France (2007) 3.5%1 and Hong Kong (2001) 2.1%;9 and based on the Epworth Sleepiness Scale (ESS), in Nigeria (2008) 1.2%10 and India (2004) 3.6%.11 It is noteworthy that in some regions only 10% of the population has been adequately screened for appro-priate diagnosis.4 Discrepancies in observed prevalence and underreporting may be due to non-standardized deinitions and variation between diagnostic methods.1
OSAS screening, diagnosis and treatment entails some chal-lenges. Polysomnography or respiratory polygraphy is a pre-cise method for diagnosing OSAS, but this method has its dis-advantages, such as expensiveness, inaccessibility and diiculty to perform. hus, in some cases, these disorders are not diag-nosed and only a few cases are properly treated.1 Another diag-nostic method is to screen by means of a questionnaire based on three symptoms: reported habitual snoring, daytime sleepiness and witnessed apnea.
Early detection of OSAS not only reduces the morbidity risk but also leads to signiicant reduction in the cost of care for other conditions.2,10 Many studies have been published in relation to weight and demographic variables, which all have strong rela-tionships with OSAS.1-3,8,11-13
Information on environmental factors afecting this outcome is unavailable. Housing characteristics are an important envi-ronmental variable; adverse conditions are preventable and can be dealt with cost-efectively, and thus may be a determinant in decreasing the burden of disease.
OBJECTIVE
he purpose of this study was to assess the prevalence of symp-toms of OSAS in a population in the USA and analyze housing characteristic risks in relation to demographic and body mass
index (BMI) variables, using the National Health and Nutrition Examination Survey (NHANES) Sleep Disorders Questionnaire and dataset.14
METHODS
We usedthe NHANES dataset (2005 to 2006), publicly available from: www.cdc.gov/nchs/nhanes.htm. NHANES was a major program that was implemented by the United States National Center for Health Statistics (NCHS). NCHS is part of the Centers for Disease Control and Prevention (CDC) and is responsible for producing vital and health statistics for the United States. NHANES was conducted in all 50 states of the USA.
NHANES data were not obtained using a simple random sam-ple. Rather, a complex, multistage, probability sampling design was used to select participants such that they would be representative of the civilian of the civilian, non-institutionalized US population. Oversampling of certain population subgroups was done to increase the reliability and precision of the health status indicator estimates for these groups. he NCHS used four questionnaires: demographic variables, housing characteristics, body measurements and OSAS. Ater the datasets for demographic variables, housing characteris-tics, OSAS and body measurements had been merged, inconsisten-cies relating to 594 sequence numbers led these individuals to be excluded from the study. hus, 5,545 individuals aged 16 years and over were selected, from several racial groups in the United States: Mexican American, Other Hispanic, Hispanic White, Non-Hispanic Black and Other Race Including Multiracial.
Demographic variables
he population for the demographics questionnaire was inter-viewed directly in the subjects’ homes and a proxy was provided for individuals who could not answer the questions themselves. he variables selected for this evaluation included age, gender, marital status, education status, pregnancy status, household size and family size.
Housing characteristics
One study participant in each family responded for the entire family and these responses were released for all members of the same family. he housing characteristics provided family-level interview data on the type of home, number of apartments in the building, age of home, number of rooms in home, time lived in home, whether home was owned or rented, water source and treatment, and allergy component-related questions about the presence of furry animals.
Sleeping characteristics
ORIGINAL ARTICLE | Ansarin K, Sahebi L, Sabur S
from the Functional Outcomes of Sleep Questionnaire, was also included.14 Variables pertaining to OSAS were selected in order to analyze the probability of OSAS based on habitual snoring (oten or almost every night), combined with daytime sleepiness (oten or almost always) and/or witnessed apnea (oten or almost every night, as conirmed by self-reports).
BODY MASS INDEx (BMI)
All survey participants were eligible for the body measurement component. here were no medical, safety or other exclusions for the body measurement protocol. he body measurement data were collected by trained health technicians, who were accom-panied by a recorder during each body measurement examina-tion. he health technicians used their discretion to obtain as many measurements as practical for individuals who were using a wheelchair. Body weight data for individuals who had had limb amputations and also those from pregnant women were excluded from the analysis. Height was measured using a Seca electronic stadiometer, in an upright standing position, with head and heels against the stadiometer before taking the height, unless this posi-tion was anatomically impossible. Before the measurement, the participants took a deep breath and held it while the headboard was positioned. If the individuals were unable to stand with the head and heels against the stadiometer, the trunk needed to be vertical above the waist and the arms and shoulders needed to be relaxed.14
Weight was measured on a Toledo digital scale, in pounds with automatic conversion to kilograms. The participants were weighed in their underwear. They were instructed to stand still at the center of the scale platform facing the recorder, with their hands at their sides, and to look straight ahead. After they had been properly positioned and the digital readout was stable, the recorder clicked on the capture button on the screen. The weight, length and height measurements were entered directly into the computer system by clicking on the “Get” buttons.14 In accordance with the World Health Organization (WHO) definitions, BMI (kg/m2) less than 18.5 was considered to be underweight, BMI greater than 25 was considered to be overweight and greater than 30 was consid-ered to be obese.15
Analysis
Ater assessment to check that the data presented normal distri-bution, all the continuous variables were summarized in terms of mean ± standard deviation (SD) and categorical variables were expressed as percentages. All signiicance tests were two-sided, and P values less than 0.05 were considered to be statistically sig-niicant. Univariate and multiple linear regression were used for the analysis. Variables showing associations with P values less
than 0.10 in univariate analyses were considered to be candidate risk factors to be used in multiple analysis.
RESULTS
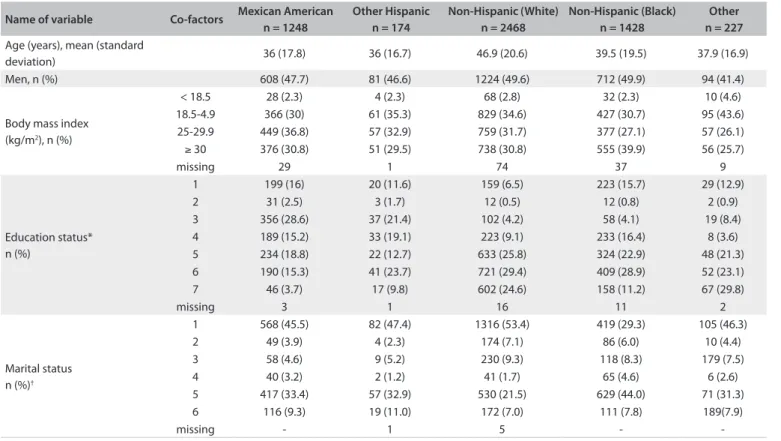
he participants’ mean age was 41.8 ± 20 years. Among this sample of individuals ≥ 16 years of age from the USA, 2,826 (51%) were women and 2,719 were men (49%) and consisted of the following: Mexican Americans (1,248 cases, 22.5%), Other Hispanics (174 cases, 3.1%), Non-Hispanic Whites (2,468 cases, 44.5%), Non-Hispanic Blacks (1,428 cases, 22.5%) and Other Race Including Multiracial (227 cases, 4.1%). he frequency dis-tribution among the study participants is shown in Table 1.
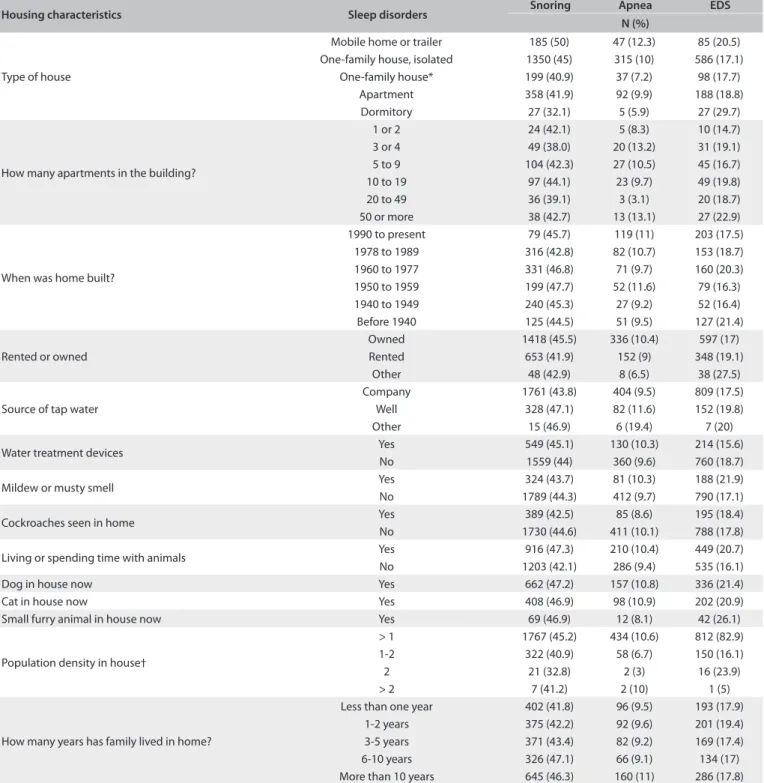
he prevalence of habitual snoring (≥ 5 nights/week) was 28.7% (conidence interval, 95% CI: 27.6-29.8); habitual apnea (≥ 5 nights/week) was 4.8% (95% CI: 4.6-5.0) and habitual exces-sive daytime sleepiness (EDS) (≥ 5 times a month) was 17.9% (95% CI: 17.15-18.65). he prevalences of habitual snoring, apnea and EDS were 35.1% (849 subjects; 95% CI: 33.2-36.8), 6.4% (160 subjects; 95% CI: 6.0-6.8) and 14.9% (405 cases; 95% CI: 19.4-20.6) among the men and 22.3% (539 subjects; 95% CI: 20.95-23.36), 3.4% (87 subjects; 95% CI: 3.2-3.7) and 20.6% (584 subjects; 95% CI: 19.4-21.8) among the women, respectively. he OSAS symptoms had strong correlations (snoring/apnea: P < 0.0001 and ß = 0.39; snoring/EDS: P < 0.0001 and ß = 0.09; and EDS/apnea: P < 0.001 and ß = 0.12). he estimated preva-lence of OSAS was 8.3% (463 subjects; 95% CI: 7.6-9.0). he prev-alence of symptoms associated with OSAS is shown in Graph 1. he prevalence of symptoms associated with OSAS according to house characteristics is presented in Table 2.
In order to investigate variables relating to OSAS, univari-ate and multiple linear regression tests were performed. Variables with more than two categories were analyzed in the form of a dummy variable. hese variables included race, education status, marital status and type of house.
In the univariate linear regression, BMI, age, gender, race, education status, marital status, type of house, age of home, rented or owned home, source of water, presence of mildew or musty smell, living or spending time with pets and ratio of pop-ulation density in the home were variables that had signiicant relationships with OSAS.
he details the of analysis were as follows: the probability of OSAS increased linearly with increasing age and BMI respec-tively (ß = 0.087, P < 0.0001; ß = 0.026, P < 0.0001); the probabil-ity among the women was less than among the men (ß = -0.026, P = 0.0008); the probability among the Mexicans was greater than among other races (ß = 0.43, P < 0.0001); the probability was less among Non-Hispanic Blacks (ß = - 0.43, P < 0.0001).
examinations and thus never had to repeat the school year) was less than among others (ß = 1.43, P < 0.0001), while university students without a certii cate and university graduates had higher probability of disorders (ß = -0.36, P < 0.0001). Regarding mari-tal status, married (ß = -0.3, P < 0.0001), widowed (ß = -0.59, P < 0.0001, 95% CI: -0.94-0.23), divorced (ß = -0.94, P < 0.0001) and separated participants (ß = -1.19, P < 0.0001) presented higher probability of OSAS, while participants who had never married (ß =1.03, P < 0.0001) had lower probability of OSAS.
From examining the associations shown between the home environment and the disorder, the following results could be inferred: living in a mobile home or trailer produced a higher probability of OSAS than shown by other types of home (ß = 0.79, P = 0.005). In addition, a direct linear relationship was found between duration of living in a house and probability of the disease.
Homes with a well as the water source (rather than from a water supply company) and those with mildew or a musty smell had higher probability of disorders (ß = 0.79, P = 0.005) and (ß = -0.34, P = 0.003).
Living with pets was also associated with greater possibility of OSAS (ß = - 0.33, P < 0.0001), but population density presented an inverse relationship with OSAS (ß = -0.63, P < 0.0001). h e variables
Table 1. Distribution of participants according to demographic characteristics
*Education status. 1: school student for more than 4 years without any failure in end-of-year examinations and thus no repetition of the school year; 2: school student for more than 4 years with failure in end-of-year examinations and the need to repeat the school year; 3: less than 9th grade, 4: 9-11th grade; 5: high
school graduate; 6: university student without a certii cate; and 7: university graduate.
†Marital status. 1: married; 2: widowed; 3: divorced; 4: separated; 5: never married; and 6: living with parent.
Graph 1. Prevalence of obstructive sleep apnea syndrome-related symptoms based on intensity
Almostalw ays
Occasionally Frequenc
y
Rarely Nev er 0 500 1000 1500 2000 2500 3000 3500 4000 4500 snoring apnea EDS Other n = 227 Non-Hispanic (Black)
n = 1428 Non-Hispanic (White)
n = 2468 Other Hispanic
n = 174 Mexican American
n = 1248 Co-factors
Name of variable
37.9 (16.9) 39.5 (19.5)
46.9 (20.6) 36 (16.7)
36 (17.8) Age (years), mean (standard
deviation) 94 (41.4) 712 (49.9) 1224 (49.6) 81 (46.6) 608 (47.7) Men, n (%)
10 (4.6) 32 (2.3) 68 (2.8) 4 (2.3) 28 (2.3) < 18.5
Body mass index (kg/m2), n (%)
95 (43.6) 427 (30.7) 829 (34.6) 61 (35.3) 366 (30) 18.5-4.9 57 (26.1) 377 (27.1) 759 (31.7) 57 (32.9) 449 (36.8) 25-29.9 56 (25.7) 555 (39.9) 738 (30.8) 51 (29.5) 376 (30.8)
≥ 30
9 37 74 1 29 missing 29 (12.9) 223 (15.7) 159 (6.5) 20 (11.6) 199 (16) 1 Education status* n (%) 2 (0.9) 12 (0.8) 12 (0.5) 3 (1.7) 31 (2.5) 2 19 (8.4) 58 (4.1) 102 (4.2) 37 (21.4) 356 (28.6) 3 8 (3.6) 233 (16.4) 223 (9.1) 33 (19.1) 189 (15.2) 4 48 (21.3) 324 (22.9) 633 (25.8) 22 (12.7) 234 (18.8) 5 52 (23.1) 409 (28.9) 721 (29.4) 41 (23.7) 190 (15.3) 6 67 (29.8) 158 (11.2) 602 (24.6) 17 (9.8) 46 (3.7) 7 2 11 16 1 3 missing 105 (46.3) 419 (29.3) 1316 (53.4) 82 (47.4) 568 (45.5) 1 Marital status n (%)†
10 (4.4) 86 (6.0) 174 (7.1) 4 (2.3) 49 (3.9) 2 179 (7.5) 118 (8.3) 230 (9.3) 9 (5.2) 58 (4.6) 3 6 (2.6) 65 (4.6) 41 (1.7) 2 (1.2) 40 (3.2) 4 71 (31.3) 629 (44.0) 530 (21.5) 57 (32.9) 417 (33.4) 5 189(7.9) 111 (7.8) 172 (7.0) 19 (11.0) 116 (9.3) 6 -5 1 -missing
ORIGINAL ARTICLE | Ansarin K, Sahebi L, Sabur S
of number of apartments in the building, home age and having cockroaches in the home did not show any association with OSAS.
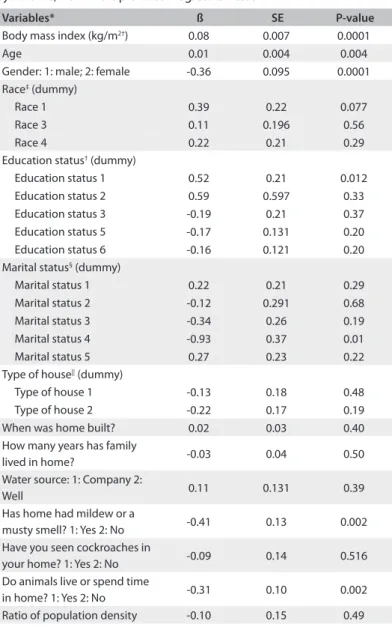
In multiple linear regression analysis, the variables of age, gen-der, BMI, education status, marital status, mildew or musty smell, and animals living or spending time in the home presented signii-cant relationships with OSAS. he test results are shown in Table 3.
DISCUSSION
To the best of our knowledge, this study is the irst broad study on data from the USA to contain valuable information about sleep disorders and risk factors relating to housing characteristics in the presence of important variables like weight and demographic variables. he prevalence of symptoms of OSAS was 8.3%.
Housing characteristics Sleep disorders Snoring Apnea EDS
N (%)
Type of house
Mobile home or trailer 185 (50) 47 (12.3) 85 (20.5) One-family house, isolated 1350 (45) 315 (10) 586 (17.1)
One-family house* 199 (40.9) 37 (7.2) 98 (17.7) Apartment 358 (41.9) 92 (9.9) 188 (18.8) Dormitory 27 (32.1) 5 (5.9) 27 (29.7)
How many apartments in the building?
1 or 2 24 (42.1) 5 (8.3) 10 (14.7) 3 or 4 49 (38.0) 20 (13.2) 31 (19.1) 5 to 9 104 (42.3) 27 (10.5) 45 (16.7) 10 to 19 97 (44.1) 23 (9.7) 49 (19.8) 20 to 49 36 (39.1) 3 (3.1) 20 (18.7) 50 or more 38 (42.7) 13 (13.1) 27 (22.9)
When was home built?
1990 to present 79 (45.7) 119 (11) 203 (17.5) 1978 to 1989 316 (42.8) 82 (10.7) 153 (18.7) 1960 to 1977 331 (46.8) 71 (9.7) 160 (20.3) 1950 to 1959 199 (47.7) 52 (11.6) 79 (16.3) 1940 to 1949 240 (45.3) 27 (9.2) 52 (16.4) Before 1940 125 (44.5) 51 (9.5) 127 (21.4) Rented or owned
Owned 1418 (45.5) 336 (10.4) 597 (17) Rented 653 (41.9) 152 (9) 348 (19.1)
Other 48 (42.9) 8 (6.5) 38 (27.5) Source of tap water
Company 1761 (43.8) 404 (9.5) 809 (17.5) Well 328 (47.1) 82 (11.6) 152 (19.8) Other 15 (46.9) 6 (19.4) 7 (20) Water treatment devices Yes 549 (45.1) 130 (10.3) 214 (15.6)
No 1559 (44) 360 (9.6) 760 (18.7) Mildew or musty smell Yes 324 (43.7) 81 (10.3) 188 (21.9) No 1789 (44.3) 412 (9.7) 790 (17.1) Cockroaches seen in home Yes 389 (42.5) 85 (8.6) 195 (18.4) No 1730 (44.6) 411 (10.1) 788 (17.8) Living or spending time with animals Yes 916 (47.3) 210 (10.4) 449 (20.7) No 1203 (42.1) 286 (9.4) 535 (16.1) Dog in house now Yes 662 (47.2) 157 (10.8) 336 (21.4) Cat in house now Yes 408 (46.9) 98 (10.9) 202 (20.9) Small furry animal in house now Yes 69 (46.9) 12 (8.1) 42 (26.1)
Population density in house†
> 1 1767 (45.2) 434 (10.6) 812 (82.9) 1-2 322 (40.9) 58 (6.7) 150 (16.1) 2 21 (32.8) 2 (3) 16 (23.9) > 2 7 (41.2) 2 (10) 1 (5)
How many years has family lived in home?
Less than one year 402 (41.8) 96 (9.5) 193 (17.9) 1-2 years 375 (42.2) 92 (9.6) 201 (19.4) 3-5 years 371 (43.4) 82 (9.2) 169 (17.4) 6-10 years 326 (47.1) 66 (9.1) 134 (17) More than 10 years 645 (46.3) 160 (11) 286 (17.8)
Table 2. Prevalence of the symptoms of obstructive sleep apnea syndrome (OSAS) according to house characteristics
We compared several studies conducted among adult in dif-ferent countries using questionnaire instruments. he prev-alence of OSAS was 1% in Nigeria10 (0.5% among women and 1.9% among men), 3.6% in India,16 3.1% in Hong Kong9 and 5% in Iran;8 however, it was 7.4% in France1 and 26% in the USA.5 OSAS in the United States, like in other Western countries, is more common than in developing countries. Obesity and aging are probably crucial factors in the United States, and the ris-ing trend of these two factors requires more attention to this context.17,18
Although the prevalence of risky apnea in the present study was similar to indings in Pakistan (10-12%),19 it was more com-mon in Malaysia (15.2%).20 On the other hand, rates if 3.5% and 6.1% were reported in France and Turkey, respectively.1,12 Nevertheless, it should be noted that 90% of individuals with sleep apnea are undiagnosed.21
he prevalence of habitual snoring was similar to ind-ings from studies conducted in the USA (46%) and Malaysia (47.3%).5,20 he prevalence observed in our study was higher than in the following other regions: Nigeria 31.6%,10 São Paulo 31%22 and France 22%.1
he rate of excessive daytime sleepiness in the present study (15%) was similar to indings from France (16%) and Malaysia (14.8%).1,20 On the other hand, the reported prevalence was 6.5% in the USA (2005).5
Consistent with a study conducted in France,1 habitual snor-ing and apnea were more prevalent among men (35.1 and 6.4%) than among women (22.3 and 3.4%). However, EDS was more prevalent among women (20.6 versus 14.9%). he prevalence of symptoms in the French study was consistently lower (61%, 7% and 24%).1
OSAS was less common among women, and this was similar to other studies; for instance in France, Japan, New Zealand1,2,4 and also in Nigeria, India, and Hong Kong.9,10 Epidemiological studies have conirmed that the gender ratio of OSAS is 2 to
3.1,10,20,21 and this ratio was 1.42 in our study. In addition to cases
of more prevalent OSAS disorders among men, these diferences were statistically signiicant in our study and some other
stud-ies1,2,4,8,23 although a study conducted in Iran did not reach any
signiicant variation.8
BMI has been an important modiiable risk factor in rela-tion to occurrences of OSAS.24-26 his has been conirmed in several studies.1,8,10-13,17 For example, obese individuals pre-sented a risk of OSAS that was 10 times higher in the study by Salvador et al.27 here was also a strong relationship between these in the presence of confounding variables. On the basis of several studies, increased body weight can alter the normal upper airway mechanics during sleep through a variety of dis-tinct mechanisms.28
Variables* ß SE P-value
Body mass index (kg/m2†) 0.08 0.007 0.0001
Age 0.01 0.004 0.004 Gender: 1: male; 2: female -0.36 0.095 0.0001 Race‡ (dummy)
Race 1 0.39 0.22 0.077 Race 3 0.11 0.196 0.56 Race 4 0.22 0.21 0.29 Education status† (dummy)
Education status 1 0.52 0.21 0.012 Education status 2 0.59 0.597 0.33 Education status 3 -0.19 0.21 0.37 Education status 5 -0.17 0.131 0.20 Education status 6 -0.16 0.121 0.20 Marital status§ (dummy)
Marital status 1 0.22 0.21 0.29 Marital status 2 -0.12 0.291 0.68 Marital status 3 -0.34 0.26 0.19 Marital status 4 -0.93 0.37 0.01 Marital status 5 0.27 0.23 0.22 Type of house|| (dummy)
Type of house 1 -0.13 0.18 0.48 Type of house 2 -0.22 0.17 0.19 When was home built? 0.02 0.03 0.40 How many years has family
lived in home? -0.03 0.04 0.50 Water source: 1: Company 2:
Well 0.11 0.131 0.39 Has home had mildew or a
musty smell? 1: Yes 2: No -0.41 0.13 0.002 Have you seen cockroaches in
your home? 1: Yes 2: No -0.09 0.14 0.516 Do animals live or spend time
in home? 1: Yes 2: No -0.31 0.10 0.002 Ratio of population density -0.10 0.15 0.49
Table 3. Analytical statistics on the status of obstructive sleep apnea syndrome, from multiple linear regression test
*Variables with P < 0.1 are entered in the model; †Education status 1: school
student for more than 4 years without any failure in end-of-year examinations and thus no repetition of the school year; 2: school student for more than 4 years with failure in end-of-year examinations and the need to repeat the school year; 3: less than 9th grade, 4: 9-11 grade; 5: high school graduate; 6: university student without
certiicate; 7: university graduate; ‡Race: 1: Mexican American; 2: other Hispanic; 3:
non-Hispanic (white); 4: other; §Marital status: 1: married; 2: widowed; 3: divorced;
4: separated; 5: never married; 6: living with parent; ||Type of house: 1: mobile
home or trailer; 2: one-family house, detached from any other house; 3: one-family house, attached to one or more houses; 4: apartment; 5: dormitory.
SE = standard error.
ORIGINAL ARTICLE | Ansarin K, Sahebi L, Sabur S
Education was another variable signiicantly associated with OSAS, with regard to confounding variables. It was found that high school students who never failed in the end-of-year examinations and thus never had to repeat the school year pre-sented lower probability of OSAS. here was a direct association between education status and OSAS.8
Participants whose marital status was “separated” showed less possibility of OSAS than shown by other marital statuses. In a report from Nigeria, being married was a risk factor for OSAS.10
Although Mexican Americans presented a high risk in uni-variate regression, multiple regressions did not support this result. In other studies, Asian, African-American and Hispanic racial groups presented higher risk.13
One main goal in the present study was to investigate the association between housing characteristics and OSAS. Although the home environment has been reported as a factor in people’s health,29 its role in relation to sleep status had not been particu-larly studied.
Although the variables of type of house, population density in the home, water source and the age of the house were signii-cant in the test, their relationship did not maintain signiicance in the multiple model.
An odor of mildew or a musty smell and living or spending time with animals had strong relationships with OSAS both in univariate and in multiple linear regression.
Our results are new in terms of exposure factors associated with OSAS. Whether the mechanisms through which housing characteristics correlate with OSAS are pathological mechanisms (e.g. through the activity of some fungi such as Aspergillum in damp environments or microorganisms found in the saliva of wool or animal), or are autoimmune mechanisms (e.g. through immune reactions against allergens such as wool and animal hair), or are physiological (e.g. through afecting concentration due to moisture and the air pressure in the home environment), these can be evaluated and thus, eventually, efective manage-ment of OSAS may be achieved.
Housing characteristics should be taken into account for pub-lic health purposes for better management of OSAS in the US, as well as in clinical decision-making relating to this syndrome.
CONCLUSION
Symptoms of OSAS were more prevalent in the USA (8.3%) than in developing countries. Moreover, the environment was an important factor for OSAS.
REFERENCES
1. Meslier N, Vol S, Balkau B, et al. Prévalence des symptômes du
syndrome d’apnées du sommeil. Etude dans une population française d’âge moyen. [Prevalence of symptoms of sleep apnea
syndrome. Study of a French middle-aged population]. Rev Mal Respire. 2007;24(3 Pt 1):305-13.
2. Mihaere KM, Harris R, Gander PH, et al. Obstructive sleep apnea in
New Zealand adults: prevalence and risk factors among Māori and non-Māori. Sleep. 2009;32(7):949-56.
3. Adewole O, Adeyemo H, Ayeni F, et al. Prevalence and correlates of snoring among adults in Nigeria. Afr Health Sci. 2008;8(2):108-13. 4. Kayukawa Y, Shirakawa S, Hayakawa T, et al. Habitual snoring
in an outpatient population in Japan. Psychiatr Clin Neurosci. 2000;54(4):385-91.
5. Hiestand DM, Britz P, Goldman M, Phillips B. Prevalence of symptoms and risk of sleep apnea in the US population: Results
from the national sleep foundation sleep in America 2005 poll. Chest. 2006;130(3): 780-6.
6. de la Hoz RE, Aurora RN, Landsbergis P, et al. Snoring and obstructive sleep apnea among former World Trade Center rescue workers and
volunteers. J Occup Environ Med. 2010;52(1):29-32.
7. Tishler PV, Larkin EK, Schluchter MD, Redline S. Incidence of sleep-disordered breathing in an urban adult population: the relative importance of risk factors in the development of sleep-disordered
breathing. JAMA. 2003;289(17):2230-7.
8. Amra B, Farajzadegan Z, Golshan M, Fietze I, Penzel T. Prevalence of sleep apnea-related symptoms in a Persian population. Sleep Breath. 2011;15(3):425-9.
9. Ip MS, Lam B, Lauder IJ, et al. A community study of sleep-disordered breathing in middle-aged Chinese men in Hong Kong. Chest. 2001;119(1):62-9.
10. Adewole OO, Hakeem A, Fola A, et al. Obstructive sleep apnea among
adults in Nigeria. J Natl Med Assoc. 2009;101(7):720-5.
11. Sharma SK, Kumpawat S, Banga A, Goel A. Prevalence and risk factors of obstructive sleep apnea syndrome in a population of Delhi, India. Chest. 2006;130(1):149-56.
12. Onat A, Hergenç G, Uyarel H, et al. Obstructive sleep apnea syndrome is associated with metabolic syndrome rather than insulin resistance. Sleep Breath. 2007;11(1):23-30.
13. Nieto FJ, Young TB, Lind BK, et al. Association of sleep-disordered
breathing, sleep apnea, and hypertension in a large community-based study. Sleep Heart Health Study. JAMA. 2000;283(14): 1829-36. 14. Centers for Disease Control and Prevention. National Health and
Nutrition Examination Survey. NHANES 2005-2006. U.S. department
of health and human services centers for disease control and prevention national center for health statistics overview. Available from: http://www.cdc.gov/nchs/nhanes/nhanes2005-2006/ nhanes05_06.htm. Accessed in 2012 (Aug 16).
15. World Health Organization. Physical status: the use and interpretation of anthropometry. Report of a WHO Expert Committee. Technical Report Series No.854. Available from: http://www.who.int/ childgrowth/publications/physical_status/en/index.html. Accessed
16. Sharma SK, Ahluwalia G. Epidemiology of adult obstructive sleep apnoea syndrome in India. Indian J Med Res. 2010;131:171-5. 17. Yim-Yeh S, Rahangdale S, Nguyen AT, et al. Obstructive sleep apnea
and aging efects on macrovascular and microcirculatory function. Sleep. 2010;33(9):1177-83.
18. Graw-Panzer KD, Muzumdar H, Jambhekar S, Goldstein NA, Rao M. Efect of increasing body mass index on obstructive sleep apnea in
children. The Open Sleep Journal. 2010;3:19-23. Available from: http:// www.benthamscience.com/open/toslpj/articles/V003/19TOSLPJ. pdf. Accessed in 2012 (Aug 16).
19. Taj F, Aly Z, Arif O, Khealani B, Ahmed M. Risk for sleep apnea syndrome in Pakistan: a cross-sectional survey utilizing the Berlin questionnaire.
Sleep Breath. 2009;13(1):103-6.
20. Kamil MA, Teng CL, Hassan SA. Snoring and breathing pauses during sleep in the Malaysian population. Respirology. 2007;12(3):375-80. 21. Lancaster LH, Mason WR, Parnell JA, et al. Obstructive sleep apnea is
common in idiopathic pulmonary ibrosis. Chest. 2009;136(3):772–8. 22. Tuik S, Santos-Silva R, Taddei JA, Bittencourt LR. Obstructive sleep
apnea syndrome in the Sao Paulo Epidemiologic Sleep Study. Sleep Med. 2010;11(5):441-6.
23. Mezick EJ, Matthews KA, Hall M, et al. Inluence of race and socioeconomic status on sleep: Pittsburgh SleepSCORE project. Psychosom Med. 2008;70(4):410-6.
24. Kent BD, Ryan S, McNicholas WT. The genetics of obstructive sleep
apnoea. Curr Opin Pulm Med. 2010;16(6):536-42.
25. Villaneuva AT, Buchanan PR, Yee BJ, Grunstein RR. Ethnicity and obstructive sleep apnoea. Sleep Med Rev. 2005;9(6):419-36.
26. Kapsimalis F, Kryger MH. Gender and obstructive sleep apnea
syndrome, part 1: Clinical features. Sleep. 2002;25(4):412-9.
27. Salvador J, Iriarte J, Silva C, et al. El síndrome de apneas obstructivas del sueño en la obesidad: un conspirador en la sombra [The obstructive sleep apnoea syndrome in obesity: a conspirator in the shadow]. Rev
Med Univ Navarra. 2004;48(2):55-62.
28. Fogel RB, Malhotra A, White DP. Sleep 2: pathophysiology of obstructive sleep apnoea/hypopnoea syndrome. Thorax. 2004;59(2):159-63.
29. Evans GW, Kantrowitz E. Socioeconomic status and health: the potential role of environmental risk exposure. Annu Rev Public Health. 2002;23:303-31.
Sources of funding: None
Conlict of interest: None
Date of irst submission: January 16, 2012
Last received: September 8, 2012
Accepted: October 19, 2012
Address for correspondence: Leyla Sahebi
Tuberculosis and Lung Disease Research Center, Tabriz University of Medical Sciences
Pashmineh, Daneshgah street, Tabriz, Iran Tel. 098-0411-3378093 or 098 9143094167 Fax. 098-0411-3378093