Silvia Cristina KonnoI
Maria Helena D’ Aquino BenicioII
Aluísio J. D. BarrosIII
I Programa de Pós-Graduação em Nutrição. Faculdade de Saúde Pública (FSP). Universidade de São Paulo (USP). São Paulo, SP, Brasil
II Departamento de Nutrição. FSP-USP. São Paulo, SP, Brasil
III Centro de Pesquisas Epidemiológicas. Universidade Federal de Pelotas. Pelotas, RS, Brasil
Correspondence: Silvia Cristina Konno Av. Dr. Arnaldo, 715 Cerqueira César São Paulo, SP Cep: 01246-904 Tel 3061-7701 ramal 219 E-mail: [email protected] Received: 2/28/2007 Reviewed: 6/26/2007 Approved: 7/13/2007
Factors associated to the
evolution of gestational
weight of pregnant women: a
multilevel analysis
ABSTRACT
OBJECTIVE: To assess the infl uence of socioeconomic, reproductive, and behavioral factors on the evolution of weight during pregnancy.
METHODS: Body weight was measured prospectively in a cohort of 215 healthy pregnant women attended to by a public prenatal service in the city of São Paulo, between 1997 and 1998. The criteria for inclusion were the following: aged 18 or older and with the beginning of prenatal care at a gestational age ≤ 16 weeks. The relation between the independent variables and the evolution of weight during pregnancy was assessed by means of the multilevel hierarchical linear analysis, and subsequently analyzed by the maximum likelihood test.
RESULTS: In the multilevel analysis, the factors that were signifi cantly associated to gestational weight gain were the following: initial BMI, level of education, marital status and parity. The equations thus obtained enabled to identify the individual effect of each of these characteristics: eutrophic initial BMI, level of education ≥ 4 years, lack of partner, and primiparity cause increases of 3.0 kg, 1.9 kg, 2.3 kg and 2.4 kg in the total weight gain during pregnancy, respectively.
CONCLUSIONS: Initial BMI, level of education and parity are the maternal characteristics that, along with the marital status, must be taken into consideration in the development of strategies to promote adequate weight gain during pregnancy.
KEY WORDS: Pregnant women. Weight gain. Obesity. Body measures and weights, utilization. Risk factors. Socio-economic factors.
INTRODUCTION
Obesity is currently one of the major public health problems in developed countries. For some developing countries, the increase in the prevalence of obesity represents an emerging problem. Brazil shows high obesity rates (Body Mass Index – BMI≥30.0 kg/m2), especially in the female population, at 13.1%;
whereas in the male population it is at 8.9%.14,*
Regarding the epidemiology of weight gain during pregnancy, recent systematic literature review4 indicates that both excessive weight gain during pregnancy
and change of lifestyle after the birth of the baby raise the risk of obesity
among women of fertile age. There is evidence that pregnancy may increase postpartum body weight in some subgroups of women, mainly those with high gestational weight gain.4 High pre-gestational BMI
is equally associated with accelerating, persistent in-creases in postpartum weight.3
Gestational weight gain expresses the rise in maternal fat and nutrient storage, fetal growth, expansion of maternal tissues (placenta, fatty tissue and uterus), breasts, increase in extracellular fluid and blood volume, and amniotic fl uid formation.17 The major
variations in gestational weight gain among healthy, single pregnancy women seem to be determined by differences in maternal characteristics, such as pre-gestational nutritional status, age, parity, ethnic origin, socioeconomic condition, drug use, physical activity, and psychosocial factors.7,9
The World Health Organization (WHO) and the In-stitute of Medicine (IOM-US) recommend different gestational weight gains according to the pre-gesta-tional nutripre-gesta-tional status, recommendations that are also adopted in Brazil by the Ministério da Saúde (Ministry of Health). Pregnant women who are low weight must have a weight gain between 12.5 kg and 18.0 kg; women with adequate weight, between 11.5 kg and 16.0 kg; overweight women, between 7.0 kg and 11.0 kg; and obese women ≤7.0 kg.3,4,7,18
Studies performed among American women show that approximately 35% of those who were pregnant showed gains above the ones recommended by the IOM, especially the eutrophic ones and the overweight ones.13 In Brazil, a retrospective cohort study among
pregnant women in six Brazilian capitals showed that 23.3% of women with low weight, 29.5% of those with adequate weight, 52.7% of the overweight ones, and 39.2% of the obese ones showed gains above those recommended by the IOM.11
According to the WHO, weight gain monitoring during pregnancy is a low-cost, highly useful procedure to establish nutritional interventions aiming at reducing maternal and fetal risks. Nutritional guidance can enable an adequate weight gain, preventing exces-sive gain and, as a result, causing a reduction in the incidence of gestational diabetes, pre-eclampsia, ec-lampsia, and arterial hypertension. The same is true as regards insuffi cient weight gain, one of the determin-ing factors in intrauterine growth restriction.18
The objective of the present study was to assess the socioeconomic, reproductive and behavioral factors that infl uence weight gain during pregnancy.
METHODS
Clinically healthy women, enrolled in the low-risk prenatal service of a charity maternity in the city of São Paulo took part in the study. The criteria for inclusion
were the following: aged 18 or older and with the beginning of prenatal care at a gestational age ≤ 16 weeks. Women with multiple pregnancy, those who were HIV positive and those whose pregnancy ended in fetal death were excluded.
In the period between March of 1997 and March of 1998, a total of 260 women were recruited: 33 were considered not eligible and two women refused to participate in the study, totaling a fi nal sample of 225 pregnant women.
Information referring to the pregnant women’s identi-fi cation, level of education, marital status, socio-eco-nomic characteristics, obstetric history, smoking habit and morbidity were obtained in three different moments of the pregnancy, from interviews with the women, by applying pre-tested questionnaires. Anthropometric measurements (height and weight) were performed according to the technique described in Lohman et al9
(1988). The three anthropometrists were standardized, following the procedure recommended by Habicht5
(1974).
The initial nutritional status (until the 16th week of
pregnancy) was assessed by means of the BMI cutoff point (BMI = weight/height2) for the gestational age
proposed by Atalah1 (1997). The gestational age was
obtained from the date of the last menstruation, con-fi rmed by ultrasound scan performed before the 20th
week of pregnancy by a single doctor from the prenatal service staff.
The infl uence of the study factors on the evolution of gestational weight was assessed by means of the multilevel analysis.2 This type of analysis was adopted
because of the study design (longitudinal with multiple observations of pregnant women’s body weight) and the fact that there was no need for a complete follow-up of the women, permitting a reduced number of losses when analyzing the data.
Considering the multilevel model, two hierarchical levels were observed: measurement occasion (level 1 units) and pregnant women (level 2 units). The program utilized for the statistical analysis of the multilevel linear regression model was the MLwiN.19
The predictors for the pregnant women level (level 2) – initial BMI, height, level of education, marital status, parity and smoking – can infl uence both: 1) the model intercept, that is, the variable affects the initial body weight (7th week of pregnancy); 2) and the magnitude
was added. The interaction of the variables with the gestational age’s quadratic and cubic terms was also tested. Only the interaction with the gestational age’s simple term was left due to the small effect shown by the other interactions.
Evolution of weight during pregnancy = weight in the 7th week of pregnancy + gestational age +
predictive variable of level 2 + predictive variable of level 2 x gestational age
For the construction of the multilevel linear regression model, the strategy based on the hierarchical conceptual model proposed by Victora et al15 (1997) was utilized.
The variables were grouped in fi ve hierarchical blocks following the time precedence of their determination: 1) BMI in the beginning of pregnancy and height; 2) level of education; 3) marital status; 4) age and parity; 5) smoking habit. The variables BMI in the beginning of pregnancy and height were included in the fi rst block, as the expected weight gain during pregnancy varies according to the initial nutritional status and height.18
The variables level of education and marital status (blocks 2 and 3), subsequently included, apart from directly infl uencing the response variable, would also have an infl uence on the variables of the subsequent blocks and so on successively.
The statistical signifi cance of each variable in the mul-tilevel model was analyzed by the maximum likelihood test. A critical level of 5% was adopted for the study factors and of 20% for the identifi cation of confounding variables. The variables of each block that showed these p-values were maintained in the subsequent model, which includes the most proximal block.
The study was carried out in conformity with the Reso-lution 196/96 by the Brazilian Ministry of Health and was approved by the Ethics Committee of Faculdade de Saúde Pública da Universidade de São Paulo. As part of the service routine, whenever necessary, the pregnant women were referred to the nutritionist or the high risk prenatal service.
RESULTS
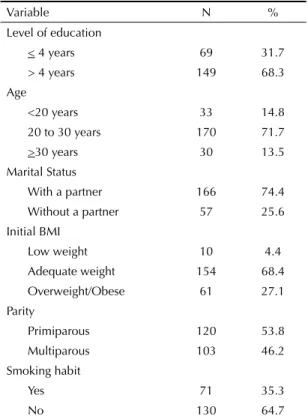
The characteristics of the pregnant women’s cohort are found on Table 1. This cohort was mostly constituted by young women (20 to 29 years of age), with fi ve or more years of formal education, primiparous, with a partner, and non-smoking.
For the multilevel analysis, pregnant women with low weight at the beginning of pregnancy (N=20) were excluded as they were not the objective of the study. Only the measurements within the 7th and 40th weeks
of pregnancy were utilized.
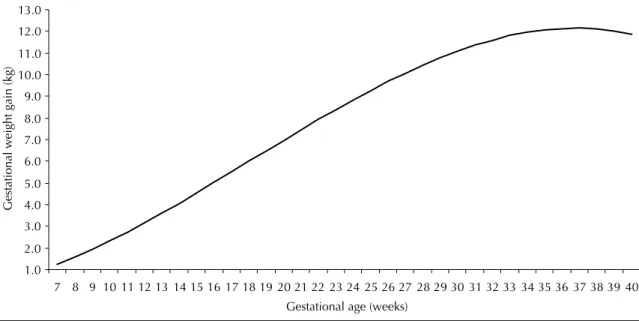
The gestational age (level 1) and its quadratic (p<0.001) and cubic terms (p<0.001) were associated with the response variable, pointing to the fact that during
pregnancy the body weight gain is not constant, that is, in the fi rst trimester the speed of weight gain is low, whereas in the second trimester major increases in weight are observed, and in the last trimester the speed slows down (Figure).
The study factor – nutritional status in the beginning of pregnancy – showed descriptive p level below 0.001 as an independent term in the model. The other factors did not infl uence the weight in the 7th week of
preg-nancy, the initial weight of the model. The interaction of the study factors – initial nutritional status, level of education, presence of partner and parity – with the variable gestational age showed descriptive p levels equal to 0.004, 0.05, 0.03, 0.01 respectively, indicating that these characteristics have an effect on the speed of weight gain.
Table 2 shows that, in the fi rst hierarchical block, women with adequate initial nutritional status began their pregnancy with a difference of 16 kg less in their body weight (p<0.001), when compared to women who were overweight or obese. However, the former gained an average of 0.075 kg per week (p=0.004) more than those who were overweight/obese.
In block 2, it is observed that the level of education showed a direct association with the body weight during
Table 1. Distribution of cohort pregnant women according to
socioeconomic and demographic characteristics, nutritional status, gestational age, reproductive history, and smoking habit. São Paulo, Southeastern Brazil, 1997-1998.
Variable N %
Level of education
< 4 years 69 31.7
> 4 years 149 68.3 Age
<20 years 33 14.8
20 to 30 years 170 71.7
>30 years 30 13.5
Marital Status
With a partner 166 74.4 Without a partner 57 25.6 Initial BMI
Low weight 10 4.4
Adequate weight 154 68.4 Overweight/Obese 61 27.1 Parity
Primiparous 120 53.8
Multiparous 103 46.2
Smoking habit
Yes 71 35.3
No 130 64.7
pregnancy. Thus, pregnant women with fi ve or more years of formal education showed positive weekly increases of 0.048 kg (p=0.05) in average, when com-pared to those who had lower level of education. It was observed that the absence of a partner infl uenced the weight gain during pregnancy positively, adding 0.058 kg per week (p=0.03) in average in relation to women who lived with their partners.
Primiparity was positively associated with the evolu-tion of body weight in pregnant women. Primiparous women showed weekly gains of 0.060 kg (p=0.01) in average, when compared to the multiparous ones. Interactions between age/parity and level of educa-tion/marital status were tested in relation to gestational weight gain. However, statistical signifi cance for these interactions was not detected.
Table 2. Multilevel hierarchical linear regression analysis to predict the evolution of weight during pregnancy. São Paulo,
Southeastern Brazil, 1997-1998.
Variable Estimate Standard-error 95% CI p
Intercept 58.8950 0.7798
Level 1: Measurement
Gestational age (months) 0.0245 0.0359 -0.0459 ; 0.3154 0.49
Gestational age to the square (months) 0.0256 0.0022 0.0207 ; 0.0293 <0.001
Gestational age to the cube (months) -0.0005 0.00004 0.0004 ; 0.0006 <0.001
Level 2: Pregnant woman Hierarchical block 1
Initial BMI
Adequate weight -16.1703 1.2469 -18.614 ;-13.726 <0.001
Overweight and obesity - -
-BMI and gestational age interaction
Adequate weight and Gestational age 0.0755 0.0263 0.0239 ; 0.1270 0.004
Overweight/obesity and Gestational age - -
-Hierarchical block 2 Level of education
< 4 years -
-> 4 years 1.0276 1.2106 1.3452 ; 3.4004 0.10
Level of education and gestational age interaction
< 4 years and Gestational age - -
-> 4 years and Gestational age 0.0485 0.0249 -0.0003 ; 0.0973 0.05
Hierarchical block 3
Marital status
Lives with a partner -
-Does not live with a partner 0.02832 1.2852 -2.4907 ; 2.5473 0.80
Marital status and gestational age interaction
Lives with a partner and gestational age - -
-Does not live with a partner and gestational age 0.0577 0.0263 0.0062 ; 0.1092 0.03
Hierarchical block 5
Parity
Primiparous 0.7274 1.1922 -1.6093 ; 3.0641 0.5
Multiparous - -
-Parity and gestational age interaction
Primiparous and gestational age 0.0596 0.0240 0.0126 ; 0.1066 0.01
Multiparous and gestational age - -
-Hierarchical block 1: variables level 1 + initial BMI
Hierarchical block 2: hierarchical block 1 + level of education
Hierarchical block 3: hierarchical block 1 + hierarchical block 2 + marital status
For the random part of the model, the variance on level 2 was adopted, depending on the gestational age, a procedure that gives the model the best adjustment and uniform dispersion of residues throughout pregnancy, according to residue analysis.
Table 3 shows the gestational weight gain due to the individualized effect of the variables that were associ-ated with weight evolution during pregnancy. These values were obtained by means of substitutions in the multilevel analysis equations corresponding to the respective hierarchical blocks, considering the fi nal (40 weeks) and initial gestational ages (seven weeks).
It was observed that beginning pregnancy with an adequate BMI increases in 3 kg the total weight gain (7th to 40th week of pregnancy). Regardless of the initial
nutritional status, to have at least fi ve years of formal education leads to an additional gain of 1.9 kg during pregnancy. Lack of a partner causes gestational weight to increase 2.3 kg in average. Primiparity enables aver-age increases of 2.4 kg in the fi nal gestational weight.
DISCUSSION
The weight gain pattern observed in the present study – lower gains in the fi rst trimester, sharp increase in the second trimester, and slower increase in the third trimester – is in accordance with what is described in the literature about evolution of weight gain during pregnancy.7,16
In the fi rst and second trimesters, the weight gain during pregnancy mostly refl ects the fat deposition that will be later utilized to meet the increased energetic demand caused by pregnancy itself. The fetal development begins to contribute substantially to the maternal body weight in the last trimester.16,10
According to what was expected, eutrophic pregnant women in the beginning of pregnancy showed higher weight increases, when compared to those who were overweight/obese. This result is in accordance with those presented by Lederman et al8 (1997), Nucci et
al11 (2001) and Olson & Strawderman12 (2003). These
studies show that the weight gain tends to be lower in the group with the highest BMI, when compared to the groups with adequate and low BMI.7 At the end
of pregnancy, women with adequate initial nutritional status showed higher average gains than those who were overweight/obese.
Table 3. Average increase in gestational weight gain,
estima-ted according to initial nutritional status, individual effect of level of education, marital status and parity. São Paulo, Southeastern Brazil, 1997-1998.
Variable
Difference in estimated weight gain among selected
subgroups (kg) Initial BMI
Adequate weight 3.0
Overweight/Obesity
-Level of education
< 4 years
-> 4 years 1.9
Marital status
Lives with a partner -Does not live with a partner 2.3
Parity
Primiparous 2.4
Multiparous
-Figure. Evolution of gestational weight gain according to gestational age. São Paulo, Southeastern Brazil, 1997-1998.
1.0 2.0 3.0 4.0 5.0 6.0 7.0 8.0 9.0 10.0 11.0 12.0 13.0
7 8 9 10 11 12 13 14 15 16 17 18 19 20 21 22 23 24 25 26 27 28 29 30 31 32 33 34 35 36 37 38 39 40 Gestational age (weeks)
Gestatio
nal weight gai
By comparing pregnant women with higher level of education (≥4 years) to those with lower level of edu-cation (<4 years), it is observed that the former gain 1.9 kg more at the end of pregnancy, indicating that, in the population studied, the level of education is possibly a marker of food access. Hickey6 (2003), while
review-ing the literature on demographic and psychosocial factors associated with weight gain during pregnancy, concluded that there exists a direct relation between the level of education and gestational weight gain.
Pregnant women who did not have a partner gained an average of 2.3 kg more than those who lived with their partners. One possible explanation for this result in the present study is the fact that the lack of a partner indicates inadequate psychosocial support. In a study with 547 pregnant women, the effect of inadequate psychosocial support on gestational weight gain was observed.12
Primiparous women showed higher weight gain than the multiparous ones (an average of 2.4 kg more), a result that was also found by Olson & Strawderman12 (2003).
For the purpose of illustration, the average weight gain among pregnant women with adequate initial BMI and medium height (158.5 cm) was estimated. The average value found was 14.9 kg for the period that goes from the 7th to the 40th week of pregnancy. For the women
with fi ve or more years of formal education, the aver-age gain for the same period was 16.8 kg. If, apart from this, the women were primiparous, the average weight gain became 19.2 kg. Pregnant women with
these characteristics and without a partner show average weight gain of 21.5 kg. Thus, the estimated average gain in these three last situations is above the WHO’s weight gain recommendation for eutrophic pregnant women (11.5 a 16.0 kg). Studies have pointed to the fact that pregnant women with gestational gain above the IOM’s recommendation show a better chance of postpartum weight retention and future obesity.4
In the present study, the frequency of pregnant women who showed characteristics that were positively as-sociated with weight gain was high: eutrophic initial nutritional status (68.4%), fi ve years or more of formal education (68.3%), primiparity (53.8%) and lack of partner (26.6%). The combination of these character-istics with the effect of the pregnancy itself (gestational age) resulted in weight gains that were higher than the current recommendation.
1. Atalah ES, Castillo CL, Castro R, Aldea A. Propuesta de un nuevo estándar de evaluación nutricional en embarazadas. Rev Med Chil. 1997;125(12):1429-36.
2. Davis CS. Statistical methods for the analysis of repeated measurements. New York: Springer; 2002.
3. Feig DS, Naylor CD. Eating for two: are guidelines for weight gain during pregnancy too liberal? Lancet.
1998;351(9108):1054-5.
4. Gunderson EP, Abrams B. Epidemiology of gestational weight gain and body weight changes after pregnancy.
Epidemiol Rev. 1999;21(2):261-74.
5. Habitch JP. Estandarizacion de metodos
epidemiologicos cuantitativos sobre el terreno. Bol
Ofi cina Sanit Panam. 1974;76(5):375-84.
6. Hickey CA. Sociocultural and behavioral infl uences on weight gain during pregnancy. Am J Clin Nutr.
2000;71(5 Supl):1364S-70S.
7. National Academy of Sciences. Institute of Medicine. Nutrition during pregnancy. Washington: National Academy Press; 1990.
8. Lederman SA, Paxton A, Heymsfi eld SB, Wang J, Thornton J, Pierson RN Jr. Body fat and water changes during pregnancy in pregnancy in women with different body weight and weight gain. Obstet
Gynecol. 1997;90(4 Pt 1):483-8.
9. Lohman TG, Roche AF, Martorell R. Anthropometric standardization reference manual. Champaign: Human Kinetics Books; 1988.
10. Muscati SK, Gray-Donald K, Koski KG. Timing of weight gain during pregnancy: promoting fetal growth and minimizing maternal weight retention. Int J Obes
Relat Metab Disord. 1996;20(6):526-32.
11. Bertoldi Nucci L, Bartholow Duncan B, Serrate Mengue S, Branchtein L, Schmidt MI, Fleck ET. Assessment of weight gain during pregnancy in general prenatal care services in Brazil. Cad Saude Publica.
2001;17(6):1367-74.
12. Olson CM, Strawderman MS. Modifi able behavioral factors in a biopsychosocial model predict inadequate and excessive gestational weight gain. J Am Diet
Assoc. 2003;103(1):48-54.
13. Parker JD, Abrams B. Differences in postpartum weight retention between black and white mothers.Obstet
Gynecol. 1993;81(5 ( Pt 1)):768-74.
14. Popkin BM. The nutrition transition in low-income countries: an emerging crisis. Nutr Ver.
1994;52(9):285-98.
15. Victora CG, Huttly SR, Fuchs SC, Olinto MT. The role conceptual frameworks in epidemiological analysis: a hierarchical approach. Int J Epidemiol. 1997;26(1):224-7.
16. Villar MD, Cogswell M, Kestler E, Castillo P, Menendez R, Repke JT. Effect of fat and fat-free mass deposition during pregnancy on birth weight. Am J Obstet
Gynecol. 1992;167(5):1344-52.
17. World Health Organization. Division of
Noncommunicable Diseases. Programme of Nutrition Family and Reproductive Health. Obesity, preventing and managing the global epidemic. Report of a WHO Consultation on obesity. Geneva; 1998.
18. World Health Organization. Physical status: the use and interpretation of anthropometry. Report of a WHO Expert Committee. Geneva; 1995. (Technical Report Series, 854).
19. Yang M, Rasbash J, Goldstein H, Barbosa M. MlwiN macros for advanced multilevel modeling. Version 2.0. London: University of London; 1999.