Children: Implications for Community Interventions
Paul Bangirana1,2*, Chandy C. John3, Richard Idro4, Robert O. Opoka4, Justus Byarugaba4, Anne M. Jurek3, Michael J. Boivin5,6
1Department of Psychiatry, Makerere University School of Medicine, Kampala, Uganda,2Department of Public Health Sciences, Karolinska Institutet, Stockholm, Sweden, 3Department of Pediatrics, University of Minnesota Medical School, Minneapolis, Minnesota, United States of America,4Department of Paediatrics and Child Health, Mulago Hospital/Makerere University School of Medicine, Kampala, Uganda,5International Neurologic and Psychiatric Epidemiology Program (INPEP), Michigan State University, East Lansing, Michigan, United States of America,6Neuropsychology Section, Department of Psychiatry, University of Michigan, Ann Arbor, Michigan, United States of America
Abstract
Background:Several interventions to improve cognition in at risk children have been suggested. Identification of key variables predicting cognition is necessary to guide these interventions. This study was conducted to identify these variables in Ugandan children and guide such interventions.
Methods:A cohort of 89 healthy children (45 females) aged 5 to 12 years old were followed over 24 months and had cognitive tests measuring visual spatial processing, memory, attention and spatial learning administered at baseline, 6 months and 24 months. Nutritional status, child’s educational level, maternal education, socioeconomic status and quality of the home environment were also measured at baseline. A multivariate, longitudinal model was then used to identify predictors of cognition over the 24 months.
Results:A higher child’s education level was associated with better memory (p= 0.03), attention (p= 0.005) and spatial learning scores over the 24 months (p= 0.05); higher nutrition scores predicted better visual spatial processing (p= 0.002) and spatial learning scores (p= 0.008); and a higher home environment score predicted a better memory score (p= 0.03).
Conclusion:Cognition in Ugandan children is predicted by child’s education, nutritional status and the home environment. Community interventions to improve cognition may be effective if they target multiple socioeconomic variables.
Citation:Bangirana P, John CC, Idro R, Opoka RO, Byarugaba J, et al. (2009) Socioeconomic Predictors of Cognition in Ugandan Children: Implications for Community Interventions. PLoS ONE 4(11): e7898. doi:10.1371/journal.pone.0007898
Editor:Enrico Scalas, University of East Piedmont, Italy
ReceivedJune 22, 2009;AcceptedOctober 27, 2009;PublishedNovember 19, 2009
Copyright:ß2009 Bangirana et al. This is an open-access article distributed under the terms of the Creative Commons Attribution License, which permits unrestricted use, distribution, and reproduction in any medium, provided the original author and source are credited.
Funding:This research was supported the National Institutes of Health (NIH) grants R21 TW006794 and 5R01NS055349 to CCJ, a Fulbright African Regional Research Award to MJB, and a SIDA/Sarec grant to PB for the Joint Makerere University/Karolinska Institutet PhD Program. The funders had no role in study design, data collection and analysis, decision to publish, or preparation of the manuscript.
Competing Interests:The authors have declared that no competing interests exist.
* E-mail: [email protected]
Introduction
Children in low income countries are exposed to several diseases and adverse conditions that affect brain development and cognition either through direct injury to the brain or lack of stimulating conditions [1,2]. Recent estimates put the number of children under five years in low income countries who fail to reach their full cognitive potential because of poverty, poor health and nutrition and deficient care at over 200 million [3]. In light of the above, interventions targeting the environment in which these children live have been suggested [2,4,5]. Examples of these interventions are improving child nutrition, early child education, providing a stimulating environment, parenting training and adult education [6,7,8,9,10].
However, before their implementation, identification of key variables within the child’s environment that affect cognition is necessary so as to have focused and effective interventions. Earlier studies have identified nutritional resources, physical development, duration of schooling, parental education, parental occupation,
family income, quality of the home environment indicators (e.g. parental interaction, provision of stimulation) and early education enrichment as affecting cognition in African children [8,9,10,11,12,13,14,15,16,17]. These variables differ in the way in which they influence cognition and are thus categorised into proximal and distal variables [18]. Proximal variables are those that the child experiences directly like parental interaction and nutrition while distal variables are those that are experienced indirectly such as family income and parental education [19]. Proximal variables have been reported to influence cognition more than distal variables [13,19].
which variables are predictive of specific cognitive abilities. This is especially important since new evidence shows African children perform differently on dynamic and static assessments of cognition [20]. Static assessment is the measurement of pre-existing cognitive skills while the emphasis of dynamic testing is the psychological processes involved in learning and change [20]. These assessments therefore measure different abilities which may be affected by different socioeconomic factors.
Assessment of different cognitive abilities using both dynamic and static tests, rather than a single cognitive score, is therefore necessary to determine which socioeconomic factors predict different cognitive abilities. We present results of a study of healthy Ugandan children who were followed up for 24 months and had different cognitive abilities tested at different points. In addition, both proximal and distal variables including parental education, nutritional status, child’s education, socioeconomic indicators and quality of the home environment were measured.
Methods
Study Population and Recruitment
The present study was conducted at Mulago Hospital, Kampala, Uganda. Participants were children aged 5 to 12 years recruited as healthy community controls for children with cerebral malaria and uncomplicated malaria taking part in prospective studies looking at the cognitive sequelae of cerebral malaria [21,22]. They were recruited from the homes or neighbourhoods of children with cerebral malaria and uncomplicated malaria. All children had a medical history and physical examination done to ensure they were healthy at the time of recruitment. Children with a positive smear for malaria were treated with chloroquine and sulfadoxine/ pyrimethamine (the first line antimalarial treatment at that time) while those with intestinal parasites were given appropriate antihelminthic medication as per the national health guidelines.
Inclusion criteria were age 5–12 years with no acute illness and signed informed consent from the parent/guardian. Exclusion criteria were (1) a history of meningitis, encephalitis, or any brain disorder, including cerebral malaria; (2) a history of developmental delay; (3) prior admission to the hospital for malnutrition; (4) a history of chronic illness; (5) treatment for an acute illness during the preceding month and (6) admission for malaria during the preceding 6 months.
Ethical approval for the study was granted by the Institutional Review Boards for Human Studies at Makerere University Faculty of Medicine, University Hospitals of Cleveland, Case Western Reserve University, Indiana Wesleyan University, University of Minnesota and the Uganda National Council for Science and Technology.
Cognitive Assessments
Cognitive testing was done at baseline after physical examina-tion with follow up testing at 6 months and 24 months by testers trained in the administration of the tests. Tests instructions from the test manuals were administered in the local language for children who did not understand English. Instructions were repeated when necessary in cases where the children failed to understand them. In some instances where the child still had difficultly comprehending, the mother or caretaker was asked to explain to the child. Visual spatial processing and memory were measured by the Kaufmann Assessment Battery for Children (KABC) [23] while spatial learning and attention were measured by the Tactual Performance Test (TPT) [24] and the Test of Variables of Attention (TOVA) [25] respectively. These tests have been validated in previous studies with children in Africa and South East Asia [12,14,16].
The two scales of the KABC that were administered were the Sequential Processing Scale where problems are solved by arranging the input in sequential order and the Simultaneous Processing Scale where problems are spatial, analogic or organisational and are solved by integrating the input simulta-neously [23].
The TPT was administered to the blindfolded child who was required to place six wooden blocks into corresponding holes in a board. The child was first given the blocks to feel their shapes, then feel the holes in the board and their location. The child was given three trials lasting ten minutes each to place the blocks into the holes, the first trial was with the preferred hand, then the non preferred hand and finally with both hands.
The TOVA was administered on a laptop where the child was asked to press a switch whenever the target stimulus (a small black box in the top position) appeared and not to press when the non target stimulus (a small black box in the bottom position) appeared. Outcome scores are inattention (failure to respond), commission (responding to non target), response time (time to respond to target), response time variability (variance in response times) and d’ prime (measure of response sensitivity).
Visual spatial processing scores were derived from the Simultaneous Processing Scale of the KABC which comprises of Face Recognition, Gestalt Closure, Triangles, Matrix Analogies, Spatial Memory and Photo Series subscales while memory scores were derived from the Sequential Processing Scale which comprises of Hand Movements, Number Recall and Word Order subscales. Spatial learning was measured by the average time per block for the three trials on the TPT while attention was measured by the d prime score of the TOVA which is one’s ability to discriminate between the target and non target stimuli.
Assessment of Socioeconomic Variables
While the child was doing the baseline cognitive tests, the parent/caregiver was asked about the quality of child’s home environment. The quality of the home environment was measured by the Middle Childhood Home Observation for the Measure-ment of the EnvironMeasure-ment (MC-HOME) [26]. The MC-HOME is used to assess the stimulation and learning opportunities offered by the child’s home environment. Studies using similar home evaluations have shown that the child’s home environment affects its cognitive development [13,27]. The MC-HOME consists of eight subscales; Responsivity, Encouragement of maturity, Emo-tional climate, Learning materials and opportunities, Enrichment, Family companionship, Family integration and Physical environ-ment. It has 59 items however item 40 ‘Family member has taken child to (or arranged for child to visit) a scientific, historical or art museum within past year’ was omitted because it was deemed not applicable to most of the children in the sample thus leaving 58 items for use in the study. This modified MC-HOME had an inter-item reliability of 0.85.
Nutrition was assessed as in our previous studies [21,22] by comparing weight for age to published norms [28] and obtaining a standardized z-score (Statistical Analysis System (SAS) release 9.1, SAS Institute, Inc., Cary, North Carolina). Socioeconomic status was assessed using a scoring instrument incorporating a checklist of material possessions, house structure, living density, food resources and access to electricity and clean water. Level of education of the child and mother were scored as follows: None = 0, Nursery = 1, Primary school grades 127 = 228, Secondary education = 9, Post-secondary school = 10.
primary varies because parents may delay to take children to school for various reasons. The Uganda government has a Universal Primary Education policy where all children are entitled to free primary education where schools are urged to promote children to the next class regardless of the performance.
Six socioeconomic variables were obtained from the above assessments; quality of the home environment (MC-HOME score), nutritional status, maternal education level, child’s education level and socioeconomic status (SES) score.
Statistical Analysis
Data were entered into databases using FileMaker Pro 7 and analysed using Statistical Package for the Social Sciences (SPSS) version 11.0 and SAS 9.1. Raw cognitive test scores were log transformed to generate normal distributions, with a higher score for visual spatial processing, memory and attention reflecting a better score and a lower score for spatial learning reflecting a better score. Pearson’s correlations were run between test scores at baseline and 6 months and between 6 months scores and 24 months scores to determine the test-retest reliabilities of the tests. Similar correlations were also run between the socioeconomic factors to determine the relationships between them. A longitudinal mixed effects model [29] was used to study the effects of socioeconomic factors and other covariates (baseline age, gender, weight-for-age z-score, child’s education level, home z-score, social economic status (SES), and maternal education) on cognitive assessments, since the same cognitive assessments were performed at three time points. In the regression analyses, the predictor variable coefficients were calculated for each of the four outcome variables (log-transformed scores in the areas of visual spatial processing, learning, attention and working memory). Exponentiated coefficients represent the percent change in geometric mean per unit on the non-transformed scale of the predictor variable [30].
Results
Demographic Characteristics
Eighty-nine children were recruited at baseline of which 87 were followed up at 6 months (a male and female were lost at 6
months) and 79 at 24 months (3 males and 5 females were lost at 24 months). There was a similar proportion of males to females at baseline (45 females and 44 males), and the mean age of enrolled children was 7.92 (standard deviation [SD] 2.04). The mean level of education was 3.02 (SD 1.78) for the children corresponding to primary four, and 6.18 (SD 2.12) for the mothers corresponding to primary seven (Table 1). All children had normal blood counts including haemoglobin level (data not shown).
Correlations between Socioeconomic Variables
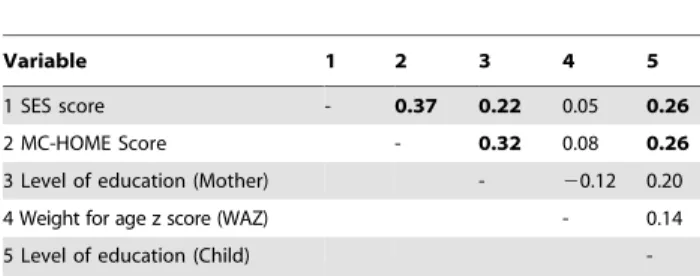
Pearson’s correlations were run between the socioeconomic variables to identify the interrelationships between them. Socioeco-nomic status correlated with MC-HOME score (r = 0.37), maternal education (r = 0.22) and child’s education (r = 0.26). Maternal education correlated with MC-HOME score (r = 0.32) and child’s education correlated with MC-HOME score (r = 0.26). Table 2. The cognitive tests were relatively stable over the 24 months study period with test-retest reliabilities ranging from 0.55 to 0.84. Table 3.
Relationship of Socioeconomic Variables to Cognitive Outcomes
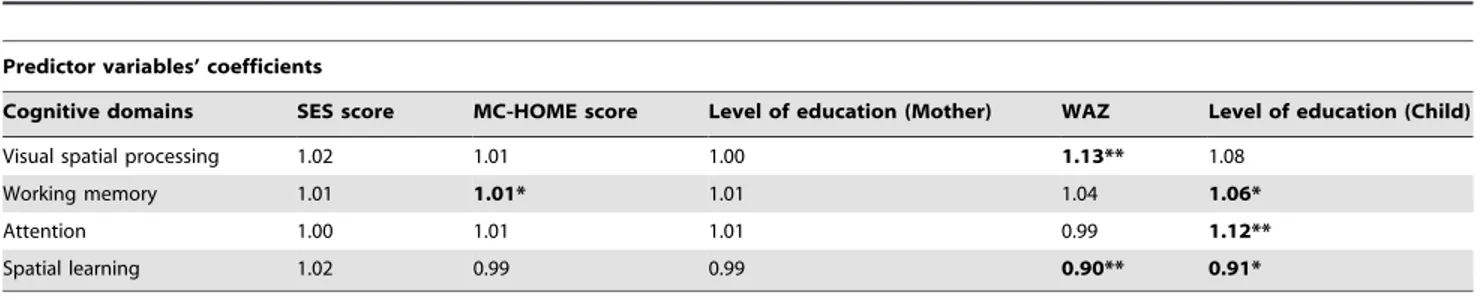
After adjustment for all other variables, higher education level of the child predicted memory (percent change 6% (1.06), 95% confidence interval (CI) = 1.0 to 10.0,p= 0.03), attention (percent change 12% (1.12), 95% CI = 3.0 to 19.0,p= 0.005) and spatial learning scores over the 24 months (percent change211% (0.89), 95% CI =219.0 to20.2,p= 0.05; negative percent change better for spatial learning) (Table 4). Better nutrition (higher weight for age z-score) predicted visual spatial processing and spatial learning scores (percent change 13% (1.13), 95% CI = 4.0 to 20.0,p= 0.002 and percent change 210% (0.90), 95% CI =219.0 to 23.0,
p= 0.008 respectively), and a higher home environment score predicted better memory (percent change 1% (1.01), 95% CI = 0.1 to 2.0,p= 0.03).
Discussion
This study prospectively examined cognition in healthy Ugandan children providing a unique opportunity to identify
Table 1.Demographic characteristics of study participants at baseline.
Domain Children with available data % Mean SD Possible range (min-max)
Age, years/months 89 7.92 2.04 5–12
5 years 17 19.1
6 years 17 19.1
7 years 15 16.9
8 years 13 14.6
9 years 9 10.1
10 years 7 7.9
11 years 9 10.1
12 years 2 2.2
Level of education (Child) 89 3.02 1.78 0–8
Level of education (Mother) 81 6.18 2.12 0–9
Weight for age z score (WAZ) 87 21.07 1.10 23.95–1.70
MC-HOME score 86 29.60 7.00 10–43
Socioeconomic status (SES) score 84 10.27 2.85 6–18
predictors of cognition in this group over a 24-month period. In the longitudinal model, the child’s level of education, nutritional status and home environment were the most important predictors of cognitive test scores over the 24 months with child’s education level predicting memory, attention and spatial learning, nutritional status predicting visual spatial processing and spatial learning while quality of the home environment predicted memory. Maternal education and SES did not predict any cognitive outcome.
Higher education level of a child predicted improved cognitive outcome in three of the four cognitive areas tested. The benefits of a child’s education were also seen in an earlier study of Congolese children where child’s education was associated with better memory performance [15]. Children with higher education performed better than their colleagues of lower education on the KABC’s sequential processing. These findings are not surprising, but are perhaps reassuring, since the goal of education is to improve general cognition. Education helps people understand general rules, apply cognitive skills to new situations and also strengthens memory and thinking skills probably through the continuous need to remember class work and solve problems based on past learning [31]. Schooling may also influence performance on cognitive tests through the stimulation the child gets from the school environment since enriched environments with more stimulation are associated with better cognitive outcomes [8]. It may also make them test-wise and perform better on cognitive tests especially those developed in the west.
The association of better nutritional status with improved visual spatial processing and spatial learning is consistent with those from earlier studies done among Kenyan, Congolese and Lao children where anthropometric indicators of nutritional status (weight, height and arm circumference in proportion to height and head circumference) predicted spatial learning and psychomotor scores [11,14,16] but did not predict memory performance [11,14,16]. Children with better nutritional status also had better visual spatial
skills, a finding consistent with nutritional intervention studies in Kenya where children receiving a diet with meat supplementation performed better than those with a milk diet, energy diet or no supplementation on the Raven’s Coloured Progressive Matrices [6,7]. Raven’s matrices measure the child’s ability to reason by analogy, organise perceptual detail and form comparison [6], skills that are also measured by the KABC’s simultaneous processing scale, which was our study’s visual spatial measure. Meat intake was associated with greater increase in middle upper arm muscle area (a measure of lean body mass) in Kenyan children [7] suggesting that the improved scores in visual spatial skills in this study might be mediated by improved nutrition. Nutrition’s effects on the brain have direct implications for the child’s cognitive skills by providing the brain with necessary nutrients during its development that enhance its development and function [32]. The importance of nutrition in promoting the child’s cognition has been noted in many other studies, including a review by Walker et al in which three of the four key risk factors for poor cognitive development in children were related to nutrition (stunting, iodine deficiency and iron deficiency anaemia) [1].
Nutrition appeared to specifically affect visual spatial learning and spatial learning but not attention or working memory in our study. Visual spatial learning and spatial learning are both dynamic measures of cognitive ability whose principal outcome measure is a child’s improvement in performance from one session to the next in learning a complex cognitive task while attention and working memory are static measures that capture state-dependent aspects of cognitive ability as one-time assessments, and do so in the absence of learning improvements across sessions [33]. Dynamic assessments are more sensitive to the long term effects of poverty related developmental impairment than static measures and are thus the best way to reveal the long-term impact of poverty on children in low income countries [20]. In this respect, the KABC’s Simultaneous Processing measure of visual spatial processing and TPT’s measure of visual spatial learning may be inherently more sensitive to quality of developmental milieu, as impacted upon by, for example, long-term nutritional status than TOVA’s attention and KABC’s Sequential Processing measure of working memory which are more sensitive to acute brain injury infections [20,21,22]. This could explain why nutrition only predicted spatial learning and visual spatial processing and not attention or working memory.
The amount of stimulation in the home environment predicted memory in the children. The kind of short-term memory measured by the KABC in our study is working memory which has parietal lobe, frontal lobe and hippocampal involvement [34,35]. Experi-mental studies in animals show more neurons produced in the hippocampus and increased dendritic length in the parietal lobe and as a result of environmental enrichment which may partly explain the effect of the home environment on memory [36,37,38]. The Table 2.Correlations between socioeconomic variables.
Variable 1 2 3 4 5
1 SES score - 0.37 0.22 0.05 0.26
2 MC-HOME Score - 0.32 0.08 0.26
3 Level of education (Mother) - 20.12 0.20
4 Weight for age z score (WAZ) - 0.14
5 Level of education (Child)
-SES, Social Economic Status; MC-HOME, Middle Childhood Home Observation for the Measurement of the Environment.
doi:10.1371/journal.pone.0007898.t002
Table 3.Descriptive statistics and test-retest reliabilities of the cognitive scores.
Descriptive statistics1 Correlations
Cognitive domain Mean SD Lowest Highest Range Median Skewness Kurtosis 0 to 6 months 6 to 24 months
Working memory 3.19 0.35 2.20 3.95 1.75 3.22 20.54 0.13 0.84 0.81
Visual spatial processing 3.26 1.21 22.30 4.41 6.71 3.47 23.29 13.16 0.67 0.82
Spatial learning 3.75 0.93 1.84 6.68 4.85 3.44 1.42 2.07 0.55 0.64
Attention 0.81 0.49 20.82 1.91 2.73 0.85 21.13 2.75 0.71 0.69
1Descriptive statistics for the baseline (0 months) scores only.
quality of the home environment is also dependent on maternal education [13] and there was a correlation between MC-HOME scores and maternal education in our study. In an earlier study in Lao children, maternal education predicted memory as measured by the KABC [16]. These results should be interpreted with caution given the small coefficients for the MC-HOME.
A strength of the present study is the inclusion of maternal education, home environment, and socioeconomic status and other important variables into a multivariate analysis. This analysis demonstrated that among MC-HOME score, maternal education and socioeconomic status, only MC-HOME score independently predicted a cognitive outcome. Our findings are consistent with previous studies which have documented that the quality of the home environment is a better predictor of cognition than socioeconomic indicators like household income and parental education [13,39]. A recent study in Kenya also showed no direct relationship between SES (measured by mother’s education and household wealth) and psychomotor development [11].
Our study findings suggest that proximal variables (child’s education, nutritional status and home environment) are better predictors of cognition than distal variables (parental education and socioeconomic status) and this is because the former have a direct effect on the child’s cognitive development than the latter. This however does not mean that distal variables are unimportant since SES has been associated with availability of a stimulating environment and maternal education is important for the provision of a good stimulating environment and better nutrition [15,40,41]. A high SES may also be needed to keep the child in school by providing fees or getting better education.
The multivariate analysis demonstrated that maternal education and SES are not associated with a significant difference in cognitive outcomes after adjusting for home environment, nutrition and education.
These findings not only point out the need for interventions that affect proximal and distal variables in at-risk groups of children, but also demonstrate the importance of assessment of these variables in studies of cognition, as they may be important
confounding variables. Strengths of the present study included the detailed evaluation of cognition, repeated cognitive testing over time, and careful testing of socioeconomic variables. Limitations of the study included: testing socioeconomic variables at baseline only, lack of a battery to test language skills, the lack of testing children under 5 years of age (excluded because the cognitive tests used have not been validated in younger children), a wide age range of 5 to 12 years and a lack of assessment of detailed nutritional characteristics, such as levels of iron and other micronutrients.
In conclusion, specific cognitive outcomes in healthy Ugandan children are predicted by the child’s education, nutrition and home environment. These factors should be considered as confounders when studies of cognition are conducted in Uganda or other sub-Saharan African countries. Though these three variables are better predictors of cognition, effective community interventions need to target all key socioeconomic variables, since many other variables such as maternal education and socioeconomic status also affect a child’s education, nutrition and home environment.
Acknowledgments
We are grateful to the families that participated in this study and our project staff who carried out recruitment, assessment and data management.
Assessment materials for the Test of Variables of Attention were provided by Dr. Robert Leark on behalf of the T.O.V.A Research Foundation and Universal Attention Disorders, Inc., 4281 Katella#215, Los Alamitos, California, USA.
Author Contributions
Conceived and designed the experiments: PB CCJ RI ROO JB MJB. Performed the experiments: PB MJB. Analyzed the data: PB AJ. Contributed reagents/materials/analysis tools: PB CCJ RI ROO JB MJB. Wrote the paper: PB CCJ RI ROO JB AJ MJB. Reviewed draft for publication: PB. Reviewed final draft for publication: CCJ RI ROO JB AMJ MJB.
References
1. Walker SP, Wachs TD, Gardner JM, Lozoff B, Wasserman GA, et al. (2007) Child development: risk factors for adverse outcomes in developing countries. Lancet 369: 145–157.
2. Olness K (2003) Effects on brain development leading to cognitive impairment: a worldwide epidemic. J Dev Behav Pediatr 24: 120–130.
3. Grantham-McGregor S, Cheung YB, Cueto S, Glewwe P, Richter L, et al. (2007) Developmental potential in the first 5 years for children in developing countries. Lancet 369: 60–70.
4. Engle PL, Black MM, Behrman JR, Cabral de Mello M, Gertler PJ, et al. (2007) Strategies to avoid the loss of developmental potential in more than 200 million children in the developing world. Lancet 369: 229–242.
5. Bangirana P, Idro R, John CC, Boivin MJ (2006) Rehabilitation for cognitive impairments after cerebral malaria in African children: strategies and limitations. Trop Med Int Health 11: 1341–1349.
6. Whaley SE, Sigman M, Neumann C, Bwibo N, Guthrie D, et al. (2003) The Impact of Dietary Intervention on the Cognitive Development
Table 4.Exponentiated coefficients represent percent change in the geometric mean per unit of the predictor variable1.
Predictor variables’ coefficients
Cognitive domains SES score MC-HOME score Level of education (Mother) WAZ Level of education (Child)
Visual spatial processing 1.02 1.01 1.00 1.13** 1.08
Working memory 1.01 1.01* 1.01 1.04 1.06*
Attention 1.00 1.01 1.01 0.99 1.12**
Spatial learning 1.02 0.99 0.99 0.90** 0.91*
*p,0.05; **p,0.01; SES, Social Economic Status; MC-HOME, Middle Childhood Home Observation for the Measurement of the Environment; WAZ, weight for age Z score.
1Exponentiated values represent the percent increase or decrease in the geometric mean on the non-transformed scale. Values greater than 1 provide a percent
increase in the geometric mean per unit of the predictor variable; values less than 1 are a percent decrease in the geometric mean per unit of the predictor variable (subtract from 1). For visual spatial processing, attention and working memory, exponentiated coefficients greater than 1 reflect a better outcome with increased predictor value; for spatial learning, exponentiated coefficients less than 1 reflect a better outcome with increased predictor value.
of Kenyan School Children. The Journal of Nutrition 133: 3965S– 3971S.
7. Neumann CG, Murphy SP, Gewa C, Grillenberger M, Bwibo NO (2007) Meat Supplementation Improves Growth, Cognitive, and Behavioral Outcomes in Kenyan Children. The Journal of Nutrition 137: 1119–1123.
8. Raine A, Venables PH, Dalais C, Mellingen K, Reynolds C, et al. (2001) Early educational and health enrichment at age 3–5 years is associated with increased autonomic and central nervous system arousal and orienting at age 11 years: evidence from the Mauritius Child Health Project. Psychophysiology 38: 254–266.
9. Klein PS, Rye H (2004) Interaction – Oriented Early Intervention in Ethiopia: The MISC Approach. Infants and Young Children 17: 340–354.
10. Boivin MJ, Giordani B, Ndanga K, Maky MM, Manzeki KM, et al. (1996) Economic advantage and the cognitive ability of rural children in Zaire. J Psychol 130: 95–107.
11. Abubakar A, Van de Vijver F, Van Baar A, Mbonani L, Kalu R, et al. (2008) Socioeconomic status, anthropometric status, and psychomotor development of Kenyan children from resource-limited settings: a path-analytic study. Early Hum Dev 84: 613–621.
12. Boivin MJ (2002) Effects of early cerebral malaria on cognitive ability in Senegalese children. J Dev Behav Pediatr 23: 353–364.
13. Richter LM, Grieve KW (1991) Home Environment and Cognitive Develop-ment of Black Infants in Impoverished South African Families. Infant Mental Health Journal 12: 89–102.
14. Boivin MJ, Giordani B, Bornefeld B (1995) Use of the Tactual Performance Test for cognitive ability testing with African children. Neuropsychology 9: 409–417. 15. Giordani B, Boivin MJ, Bikayi O, Nseyila DND, Lauer RE (1996) Use of the K-ABC with Children in Zaire, Africa: An Evaluation of the Sequential-Simultaneous Processing Distinction within an Intercultural Context. Interna-tional Journal of Disability, Development, and Education 43: 5–24. 16. Boivin MJ, Chounramany C, Giordani B, Xaisida S, Choulamountry L, et al.
(1996) Validating a cognitive ability testing protocol with Lao children for community development applications. Neuropsychology 10: 588–599. 17. Sigman M, Neumann C, Jansen AA, Bwibo N (1989) Cognitive abilities of
Kenyan children in relation to nutrition, family characteristics, and education. Child Dev 60: 1463–1474.
18. Scarr S (1985) Constructing psychology: Making facts and fables for our times. American Psychologist 40: 499–512.
19. Molfese VJ, Modglin A, Molfese DL (2003) The role of environment in the development of reading skills: a longitudinal study of preschool and school-age measures. J Learn Disabil 36: 59–67.
20. Sternberg RJ, Grigorenko EL (2002) Dynamic testing: The Nature and Measurement of Learning Potential. New York, NY: Cambridge University Press. 230 p.
21. Boivin MJ, Bangirana P, Byarugaba J, Opoka RO, Idro R, et al. (2007) Cognitive impairment after cerebral malaria in children: a prospective study. Pediatrics 119: e360–366.
22. John CC, Bangirana P, Byarugaba J, Opoka RO, Idro R, et al. (2008) Cerebral malaria in children is associated with long-term cognitive impairment. Pediatrics 122: e92–99.
23. Kaufman AS, Kaufman NL (1983) Kaufman Assessment Battery for Children: Administration and Scoring Manual. Circle Pines, MN: American Guidance Service.
24. Reitan RM (1974) Clinical Neuropsychology: Current Status and Applications. Washington, DC: Winston.
25. Dupuy TR, Greenberg LM (2005) The T.O.V.A. Manual for IBM Personal Computer or IBM Compatible. Minneapolis, MN: Universal Attention Disorders.
26. Caldwell BM, Bradley RH (2001) Home Inventory Administration Manual (3rd ed.). Little Rock, AR: University of Arkansas.
27. Thompson RJ, Catlett AT, Oehler JM, Gustafson KE, Goldstein RF (1998) Home environment and developmental outcome of African American and white infants with very low birthweight. Children’s Health Care 27: 1–14. 28. Kuczmarski RJ, Ogden CL, Guo SS, Grummer-Strawn LM, Flegal KM, et al.
(2002) 2000 CDC Growth Charts for the United States: methods and development. Vital Health Stat 11: 1–190.
29. Fitzmaurice GM, Laird NM, Ware JH (2004) Applied Longitudinal Analysis. Hoboken: Wiley-Interscience. 536 p.
30. UCLA: Academic Technology Services SCG FAQ: How do I interpret a regression model when some variables are log transformed? Available: http:// www.ats.ucla.edu/stat/mult_pkg/faq/general/log_transformed_regression.htm. Accessed 2009 September 8.
31. Irwin BD, Simons JA (1994) Lifespan Developmental Psychology. Madison, WI: Wm. C. Brown Communications. 705 p.
32. Fernstrom JD (2000) Can nutrient supplements modify brain function? Am J Clin Nutr 71: 1669S–1675S.
33. Sternberg RJ (2004) Culture and intelligence. Am Psychol 59: 325–338. 34. Klingberg T, Forssberg H, Westerberg H (2002) Increased brain activity in
frontal and parietal cortex underlies the development of visuospatial working memory capacity during childhood. J Cogn Neurosci 14: 1–10.
35. Nichols EA, Kao YC, Verfaellie M, Gabrieli JD (2006) Working memory and long-term memory for faces: Evidence from fMRI and global amnesia for involvement of the medial temporal lobes. Hippocampus 16: 604–616. 36. Brown J, Cooper-Kuhn CM, Kempermann G, Van Praag H, Winkler J, et al.
(2003) Enriched environment and physical activity stimulate hippocampal but not olfactory bulb neurogenesis. Eur J Neurosci 17: 2042–2046.
37. Kempermann G, Kuhn HG, Gage FH (1997) More hippocampal neurons in adult mice living in an enriched environment. Nature 386: 493–495. 38. Kolb B, Gibb R, Gorny G (2003) Experience-dependent changes in dendritic
arbor and spine density in neocortex vary qualitatively with age and sex. Neurobiol Learn Mem 79: 1–10.
39. Gottfried AE, Fleming JS, Gottfried AW (1998) Role of cognitively stimulating home environment in children’s academic intrinsic motivation: a longitudinal study. Child Dev 69: 1448–1460.
40. Bradley RH, Corwyn RF (2002) Socioeconomic status and child development. Annu Rev Psychol 53: 371–399.