Ergonomic Considerations in Workstation
Design for Deburring Process at Mat
Manufacturing
Prajitsen G. Damle Research Scholar
North Maharashtra University, Jalgaon
Dr. Vijaykumar P. Wani Principal
MET’s Institute of Engineering, Nasik
Dr. Indrasingh D. Patil Professor and HOD
Dept. of Biotechnology, SSBT’s C.O.E.T., Jalgaon
Abstract - Productivity of the workers in mat manufacturing unit depends on workstation design as well as environmental condition as well as their comfort depends on working postures and working environment. Awkward, extreme and repetitive postures have been connected with work related musculoskeletal disorders and injury to the lower back of workers engaged in deburring process of PP Mat industries. Basically this process is performed manually by hand while sitting with folding legs at knee posture on the hard floor. In that situation which leads to various injuries associated to low back as well as neck and shoulder. The present study was carry out in M/S Varun Polymer, Jalgaon MIDC District of Maharashtra State India with the objective to study the physical and physiological parameters as well as the work station layout of the respondent engaged in Mat manufacturing unit. A total of 46 subjects were selected to study involved in mat making enterprise and to make the provision of technology selection to reduce the hard work as well as musculoskeletal disorders, thus enhancing the productivity and comfortness. Factors like BMI, Popliteal height, buttock-knee length, seat base height, back rest height and room temperature are considered for experiment. Taguchi L27 orthogonal array (OA) was applied to evaluate the effect of theses parameters’ and signal-to-noise and analysis of variance (ANOVA) used for work out the importance and their effect on the response parameter in summer environmental days. The results showed that the seat base height was the most significant parameter followed by BMI and the least influence was room temperature in winter season. Experimental results are provided to confirm the effectiveness of this approach.
Keywords: Ergonomic, Productivity, Taguchi method, orthogonal Array, SN ratio, ANOVA
I. INTRODUCTION
Small scale enterprise has its own significance excellent importance for accelerating economic growth both in developed and developing countries. It reduces unemployment and poverty and it is a pathway to prosper. Entrepreneurship in rural areas may be developed through the adoption of new technologies not only for improving the productivity and value addition torural resources also. Workers’ are the important part of every enterprise and significant to delivering quality products. [1]. Productivity is one of the most important factors affecting the overall performance in any industry. Ergonomic has usually been used to improve the workers’ performance by discovering the factors that contribute to their performance. Robust design is an engineering methodology for obtaining product and process conditions. Taguchi’s parameter design is an important tool for robust design. It offers a simple and systematic approach to optimize design for performance, quality and cost. Taguchi’s approach is totally based on statistical design of experiments and this can economically satisfy the needs of problem solving and product or process design optimization. By applying this technique one can significantly reduce the time required for experimental investigation, as it is effective in investigating the effects of multiple factors on performance as well as to study the influence of individual factors to determine which factor has more influence and which less [2].
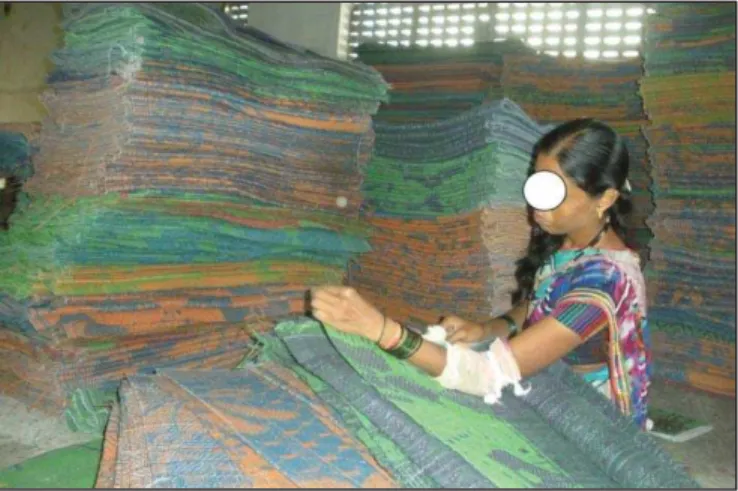
The purpose of workplace design is to cut time losses, and to improve the quality as well as productivity. This study is conducted in M/S Varun Polymer, Jalgaon MIDC District of Maharashtra State India with the objective to study anthropometric and environmental parameters as well as the work station layout of the workers engaged in Mat manufacturing unit. The task of deburring (finishing) is performed in a prolonged sitting position on hard floor without back support in which worker is cutting the extra lengths tubes by blades. It is a repetitive and continuous process throughout the working shift (except lunch break). In this condition, back and neck is bent excessively and postures of different parts of body considerably turn from neutral position. Fig1 shows the detail of body position in order to perform finishing operation at workstation.
Figure No. 1 A typical working posture adapted in order to perform de-burring operation
To assess the impact of occupational health risks and disorders due to prolonged sitting, bending and various other types of postural discomforts to the workers [6-8]. A total of 46 women workers volunteers were ready to take participation in this study. Anthropometric data of these workers are measure with the help of a female staff of Mechanical Department in close room. Before going to start the experimentation, all anthropometric dates’ are recorded. This process was carry out in new workstation in the same company.
III. EXPERIMENTATION
Experimentation work is divided in three parts with respective to season i.e. Rainy, Winter and Summer. First experiment is started in the month of December, second is in the month of May and third is in the month of August. Experimental design: -
To overcome the work musculoskeletal problems and to increase the productivity of women workers, the Taguchi design experiment was used. In this experiment six different factors related to workers, chair and environment viz. BMI, Buttock-knee length, Popliteal height, seat base height, back rest height and Room temperature are considered to improve the workstation. The identified factors and levels are shown in table 1. The workstation consisted of a fixed height table and height adjustable chair. Experiment was conducted on actual workplace in the company and in summer period (in second part). The fractional factorial design and L27 orthogonal array was used. Each row of the OA represents one trial; with respective to level of factors in trail particular women is consider to performing the experiment.
Sr. no. Parameters Range Level 1 Level 2 Level 3
01 A: BMI 13.79-28.47 13-19 19-25 25-31
02 B : Buttock-Knee length 383-419 380-394 394-408 408-422 03 C : Popliteal height 490-600 380-520 520-560 560-600
04 D: Chair Base Height 380-560 380 470 560
05 E: Backrest Support Height 100-200 100 150 200
06 F: Room Temp. 22-43 33 38 43
Table1 factors and their range & levels (summer season)
IV. RESULT AND DISCUSSION
variance (ANOVA) and regression model for each variable. Larger the better characteristics is used for calculation of the SN ration. One of the hypothesis is the efficiency of worker has a direct related with this considered parameters [16-19].
SN ratios are calculated for each factor and level; they are tabulated as shown in table 2. Taguchi recommends analyzing the SN ratio using a theoretical approach that involves graphing the effect and visually identifying the factor that appear to be important, without using ANOVA.
Level A B C D E F 1 37.37 37.34 37.28 37.00 37.35 37.49 2 37.56 37.59 37.49 37.74 37.50 37.62 3 37.41 37.42 37.57 37.60 37.49 37.23 Delta 0.20 0.25 0.29 0.73 0.15 0.39 Rank 5 4 3 1 6 2
Table 2 Response Table for Signal to Noise Ratios
The more major difference in SN ration is the indication of influence of that factor on productivity. The difference for each parameters with respective the level is shown in table 2 i.e. delta. Therefore, based on results it can be concluded that seat base height is more dominating factor on productivity. And the second highest dominating factor is room temperature. The optimum condition of variable is A2 B2 C3 D2 E2 F2.
Table 3 shows the result of ANOVA analysis by one way technique. It gives the impression that the main effects of six factors are important on production rate based on p-values which are less than 0.05. For this reason, they have been included in a regression model to build the mathematical formulation between factors and production. It can be observed from table 3 that p value of factor D is less than 0.05.
Source DF Adj SS Adj
MS F-Value P-Value
Contribution (%) A 2 12.07 6.037 0.43 0.658 3.43 B 2 19.19 9.593 0.69 0.511 5.48 C 2 28.74 14.37 1.07 0.360 8.26 D 2 195.6 97.815 14.98 0.000 55.52 E 2 9.852 4.962 0.35 0.712 2.8 F 2 51.93 25.93 2.07 0.148 14.84
Error 14 34.918 -- -- -- 9.67
Total 26 352.30 -- -- -- 100
Table 3 Result of Analysis of Variance
It is observed from figure 1that seat base height of chair with second level (470 mm) is the highest on production rate among all levels. This means that it is not needed to raise the seat base height of chair up to third level (560mm). Similarly room temperature second level (38º C) is representing the highest value of production. It can be concluded from this analysis that second level of BMI, second level of buttock-knee length, third level of popliteal height, second level of seat base height, second level of back rest height and second level of room temperature will give high productivity of workers.
Figure 1Main effect of each parameter on production 3
2 1 77
76
75
74
73
72
71
3 2
1 1 2 3 1 2 3 1 2 3 1 2 3
A
Me
a
n
B C D E F
Main Effects Plot for y
The response function representing the production rate (Y) is expressed as follows;
Y = f (A, B, C, D, F)
Where, Y = Production rate.
A = BMI, B = Buttock-knee length, C = Popliteal height, D = Seat base height, E = Back rest height and F = Room temperature.
The MINITAB Statistical Software has used to determine mathematical model is given as equation 2 and it is consider as linear regression model representing production rate (units/hour) of deburring process on new workstation.
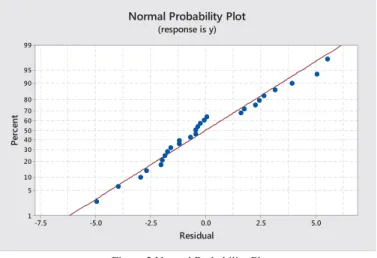
y = 67.30 + 0.167 A + 0.278 B + 1.222 C + 2.500 D + 0.611 E - 1.111 F ………. (2) The testing of regression model is evaluated through coefficient of R2 and R2-adj. Figure 2 shows the normal probability plot of response.
Figure 2 Normal Probability Plot
V. CONCLUSION
Workstation for deburring process task should be design so that any women workers can adjust to her comfort to work and improve efficiency. The ergonomically designed workstation is a solution to ergonomic and productivity problems in the workplace. A regression model representing worker performance was built based on the experimental work.
REFERENCES
[1] Deepa Vinay, et al., [2012], “Ergonomic Implementation and Work Station Design for Quilt Manufacturing Unit”, Indian Journal of Occupational & Environmental Medicine, 2012 May-Aug; 16(2): 79–83.
[2] Nicolo Belavendram, [1995], Quality Design: Taguchi Techniques for Industrial Experimentation. Prentice Hall.
[3] Hasselquist, R.J., [1981], “Increasing manufacturing productivity using human factors principles”, Proceedings of the Human Factors Society – 25th Annual Meeting, pp. 204-206.
[4] Das, B. & Shikdar, A. [1999] “Participative versus assigned production standard setting in a repetitive industrial task: a strategy for improving worker productivity”, International Journal of Occupational Safety and Ergonomics, vol. 5, no. 3, pp. 417-430.
[5] Robert Norman, Richard Wells [1998] “Ergonomic Interventions for Reducing Musculoskeletal Disorders: An Overview, Related Issues and Future Directions,” For the Institute for Work & Health To the Royal Commission on Workers Compensation in British Columbia, May 1998.
[6] D. C. Metgud, Subhash Khatri, M. G. Mokashi, P. N. Saha.[2008] “An ergonomic study of women workers in a woolen textile factory for identification of health related problems,” Indian Journal of Occupational and Environmental Medicine” Vol.2 Issue 1, pp. 14-19, Apr. 2008.
[7] Adarsh Kumar[2004] ‘Stooped and squatting posture problems in agriculture: International perspective (India)’, in Proc. International conference on stooped & squatting postures in the workplace, Okland, California, USA, July 29-30, 2004.
[8] Biman Das, Julia Wimpee, Bijon Das. [2002] “Ergonomics evaluation and redesign of a hospital meal cart”, Applied Ergonomics, Vol. No. 33, pp. 309-318, 2002.
[9] Murrel K.F.H. Ergonomics man in his working environment, Publisher: Chapman and Hall Ltd, Fifth Edition 1965.
[10] Chengalur SN, Rodgers SH, Bernard TE [2004]. Kodak’s ergonomic design for people at nd work 2 ed. Hoboken, NJ: John Wiley & Sons, Inc., p. 111.
[11] Faiq Mohammed Sarhan Al-Zwainy1, Mohammed Hashim Abdulmajeed2, Hadi Salih Mijwel Aljumaily3, “Using Multivariable Linear Regression Technique for Modeling Productivity Construction in Iraq” Open Journal of Civil Engineering, 2013, 3, 127-135.
5.0 2.5
0.0 -2.5
-5.0 -7.5
99
95 90
80 70 60 50 40 30 20
10 5
1
Residual
Pe
rc
e
n
t
[12] Nico J. Delleman, Jan Dul [2002] “Sewing machine operation: workstation adjustment, working posture, and workers’ perceptions” International Journal of Industrial Ergonomics 341–353.
[13] Velittin KalÕnkara1, Nurten Cekal2 Ilgaz Akdogan3 and Nesrin Kacar4 [2011] “Anthropometric measurements related to the workplace
design for female workers employed in the textiles sector in Denizli, Turkey” Eurasian Journal of Anthropology Eurasian J. Anthropol. 2(2):102í111.
[14] A Somasundaram , P S S Shrinivasan [2010] “Design Optimization of dosa making workstation for smooth ergonomic interface” Journal of Scientific and Industrial Research, vol. 26, march 2010, pp 221-224.
[15] A. C. S. Reddy1, S. Rajesham2, P. R. Reddy3 , T. P. Kumar4, J. Goverdhan5 [2015] “An experimental study on effect of process parameters in deep drawing using Taguchi technique” International Journal of Engineering, Science and Technology Vol. 7, No. 1, 2015, pp. 21-32.
[16] Bhawna Bisht, Jyoti Vimal, Vedansh Chaturvedi [2013] “Parametric Optimization of Electrochemical Machining Using Signal-To-Noise (S/N) Ratio” International Journal of Modern Engineering Research (IJMER) Vol.3, Issue.4, Jul - Aug. 2013 ISSN: 2249-6645, pp-1999-2006.
[17] Srinivas Athreya1, Dr Y.D.Venkatesh2[2012] “ Application of Taguchi Method For Optimization Of Process Parameters In Improving The
Surface Roughness Of Lathe Facing Operation” International Refereed Journal of Engineering and Science (IRJES) ISSN (Online) 2319-183X, (Print) 2319-1821 Volume 1, Issue 3 (November 2012), PP.13-19.
[18] Ranganath M S, Vipin [2013] “Optimization of Process Parameters in Turning Operation Using Taguchi Method and Anova: A Review” International Journal of Advance Research and Innovation, Volume 1 (2013) ISSN 2347 – 3258 pp 31-45.
[19] Bala Murugan Gopalsamy1, BiswanathMondal, Sunkamal Ghosh [2009] “Taguchi method and ANOVA: An approach for process
parameters optimization of hard machining while machining hardened steel” Journal of Scientific and Industrial Research Vol. 68, August 2009, pp. 686-695.
[20] Jalal Khan1, S.N. Teli2, B.P. Hada3 [2014] “Reduction of Cost of Quality By Using Robust Design: A Research Methodology” International
Journal of Mechanical and Industrial Technology ISSN 2348-7593 (Online) Vol. 2, Issue 2, October 2014, pp 122-128.
[21] JIJU ANTONY and NICK CAPON [1998] “Teaching Experimental Design Techniques to Industrial Engineers” Int. J. Engg. Ed. Vol. 14, No. 5, 1998. pp. 335-343.