Juvenal Soares Dias da CostaI,II
Mauri Caldeira ReisIII Claudio Viana Silveira FilhoIII
Rogério da Silva LinharesIII
Fábio PiccininiIII
I Programa de Pós-Graduação em Saúde Coletiva. Universidade do Vale do Rio dos Sinos. São Leopoldo, RS, Brasil
II Departamento de Medicina Social. Faculdade de Medicina. Universidade Federal de Pelotas (UFPel). Pelotas, RS, Brasil
III Programa de Residência em Medicina Preventiva e Social. UFPel. Pelotas. RS, Brasil
Correspondence:
Juvenal Soares Dias da Costa Av. Duque de Caxias, 250 96030-002 Pelotas, RS, Brasil E-mail: [email protected] Received: 1/14/2008 Revised: 4/22/2008 Approved: 5/8/2008
Prevalence of medical visits
and associated factors, Pelotas,
Southern Brazil, 1999-2000
ABSTRACT
OBJECTIVE: To estimate the prevalence of visiting doctors and to analyze associated factors.
METHODS: Cross-sectional, population-based study performed in the city of Pelotas, Southern Brazil, between December 1999 and April 2000. A total of 1,962 individuals of both sexes, aged between 20 and 69 years and living in the urban area were included in this study. Data were collected with standardized, pre-coded questionnaires. The outcome “visited doctor during the 12 months prior to interview” was analyzed with socioeconomic and demographic factors, presence of chronic diseases and psychiatric disorders, nutritional status, smoking, alcohol consumption, and hospitalizations in the year prior to interview. Poisson regression was used, according to a hierarchical model, controlled by confounding variables, and considering a signifi cance level of <0.05.
RESULTS: Among interviewees, 1,395 (70.9%) had visited a doctor in the period analyzed. Multivariate analysis among men revealed that individuals who showed higher prevalences of medical visits had a per capita family income higher than 10 minimum wages per month, were over 60 years of age, suffered from diabetes mellitus, had a body mass index equal to or above 25kg/m², and had been hospitalized. Women who had a per capita family income higher than six minimum wages per month, were over 60 years of age, white and non-smokers, suffered from hypertension and diabetes, and had been hospitalized showed higher outcome prevalences.
CONCLUSIONS: Health inequalities were identifi ed in relation to ethnicity and family income. In addition, there was high prevalence of medical visits, especially among individuals who were older and suffered from certain chronic, non-communicable diseases.
DESCRIPTORS: Health Services, utilization. Offi ce Visits.
Socioeconomic Factors. Health Inequalities. Cross-Sectional Studies.
INTRODUCTION
Health service access measures are some of the criteria that guarantee health system quality. This is based on the principle that people have the right to use health systems. However, according to the Black Report,10 morbidity and
mortality are higher among individuals who were not qualifi ed or partially qualifi ed for a job. Moreover, those who were not qualifi ed used health services, especially services of a preventive nature, less frequently than the occupa-tional groups.10 National studies have pointed to socioeconomic, gender and
a Associação Brasileira de Empresas de Pesquisa. Critério de Classifi cação Econômica Brasil. São Paulo; 2003 [cited 2007 Dec 4]. Available from: http://www.anep.org.br/codigosguias/ABEP_CCEB.pdf
to epidemiological studies performed in the city of Pelotas, Southern Brazil, population groups who most frequently use health services show better indicators related to health care.4,5 In addition, the characteristics
of the population groups who use these services less frequently have been shown, revealing inequalities in the local health system.5
Based on epidemiological data, factors that promote and/or hinder access to the health system could be identifi ed, thus contributing to its rationalization and qualifi cation.
The present study aimed to estimate the prevalence of medical visits and also to analyze associated factors.
METHODS
Population-based, cross-sectional study performed between December 1999 and April 2000 with male and female individuals, aged between 20 and 69 years, living in the city of Pelotas urban area.
A project was developed with the Universidade Fed-eral de Pelotas and the Universidade do Vale do Rio dos Sinos (Federal University of Pelotas and Vale do Rio dos Sinos University), involving multiple out-comes. The sample was calculated, based on estimates of prevalences of different outcomes included in this study, to guarantee 80% power, 5% alpha error, preva-lence of events investigated varying between 25% and 75%, and a prevalence ratio of 2.0. The sample was increased by 10% to compensate for losses and refus-als, and by other 15% to assure control of confusion factors in the multivariate analysis. Sample size was estimated as 1,800 individuals.
Sampling was carried out in multiple stages; fi rst by conglomerates, when 40 census tracts and 30 homes from each tract were randomly selected. A total of 1,200 families and 1.5 person, aged between 20 and 69 years, were expected to be identifi ed. In each tract, the starting point and block were randomly chosen. After choosing a home, the two homes following it were systematically ignored, and the third one was visited.
A total of 1,145 families (95.4%) were found, of which 55 refused to participate or were not found and thus classifi ed as losses. All family members aged between 20 and 69 years were eligible and interviewed in pri-vate. Among the families found, 2,177 people were
identifi ed, and 1,968 within the age group studied
were interviewed, totaling 9.8% of loss. Women of fertile age who were either pregnant or had delivered a baby in the 12 months preceding the interview, or yet individuals with limitations and inabilities, which cause them to be dependent on someone else to have
access to health services, showed very low prevalences and were included in the analysis. In all, 1,962 adults were interviewed.
The instrument employed was a pre-coded, standard-ized questionnaire, applied by university students from
the Universidade Federal de Pelotas who were not
aware of the research objectives. Interviewers were trained to apply the questionnaire and take weight, height, and blood pressure measurements.
The outcome assessed was visiting doctors in the previ-ous year, since the interview date.
Variables related to socioeconomic level were the following: economic class classification from the Associação Brasileira de Empresas de Pesquisas e
Mercados – ABEPa (Brazilian Association of Research
and Market Companies), per capita family income in minimum wages, and level of education. Economic class classifi cation is a score based on wealth accumula-tion and level of educaaccumula-tion, where class A individuals show higher values.
The demographic variables analyzed were as follows: sex, age, ethnicity and marital status.
Life habits assessed were smoking and alcoholic bever-age consumption. Smoking was considered as the habit of smoking, classifying individuals as non-smokers, ex-smokers, and smokers. Alcoholic beverage consump-tion was quantifi ed in grams of ethanol consumed per day, considering frequency and type of beverage, and the cut-off point to defi ne abuse was set at 30g/day.14
To assess nutritional status, the body mass index (BMI) was calculated for each individual, based on weight (kg) and height (m) measurements taken by interviewers. BMI values >25.0 were considered as overweight.
Comorbidity by some chronic, non-communicable dis-eases was analyzed: diabetes mellitus, systemic arterial hypertension, minor psychiatric disorders and chronic bronchitis. Presence of diabetes mellitus was reported by the interviewee. Arterial blood pressure measure-ment used was the average from two measuremeasure-ments taken during questionnaire application. Systemic arte-rial hypertension was defi ned as arterial blood pressure ≥160/95 mmHg (to increase specifi city17), or by means
of self-reported antihypertensive medication.
Presence of minor psychiatric disorders was established with the use of the Self Report Questionnaire (SRQ-20), with a cut-off point ≥6 for men and ≥7 for women.11
Interviewees were asked about possible hospitalization in the period of one year prior to interview.
As quality control, simplifi ed questionnaires were re-applied to 10% of the sample. Data were codifi ed in Epi-Info with double-typing.
In the crude analysis, prevalence ratios and 95%
con-fi dence intervals (95% CI) were calculated, and linear tendency and chi-square test were performed when in-dicated.3 According to the literature, women use health
services more frequently than men do, thus crude and adjusted analyses were stratifi ed by sex.5,18,22 Analyses
were made with the SPSS 13.0. software.
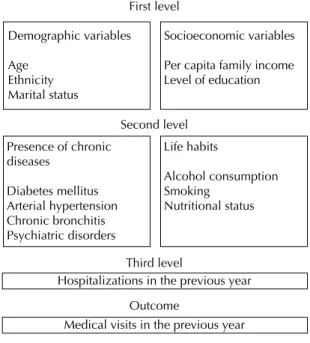
Poisson regression was the multivariate analysis performed, using the Stata software, according to a hierarchical model, so that confounding variables were controlled.2,23 Variables with a signifi cance level
of P≤0.20 in the crude analysis were introduced in the model, and those with a signifi cance level of P<0.05 remained in the model. Figure 1 shows the hierarchi-cal model adopted: socioeconomic and demographic variables were included on the fi rst level; on the second level, life habits and morbidity; on the third level, the variable “hospitalizations in the previous year”.
The research project was approved by the Research Ethics Committee of Universidade Federal de Pelotas School of Medicine.
RESULTS
Among interviewees, 1,395 (70.9%; 95%CI[69.1;73.1]) had visited a doctor in the year prior to interview. All the 846 (43%) male individuals had an average of 1.8 (95%CI[1.6;2.0]) medical visits in the previous year, whereas the 1,122 (57%) women interviewed had an average of 4.7 (95%CI[4.1;5.2]) visits.
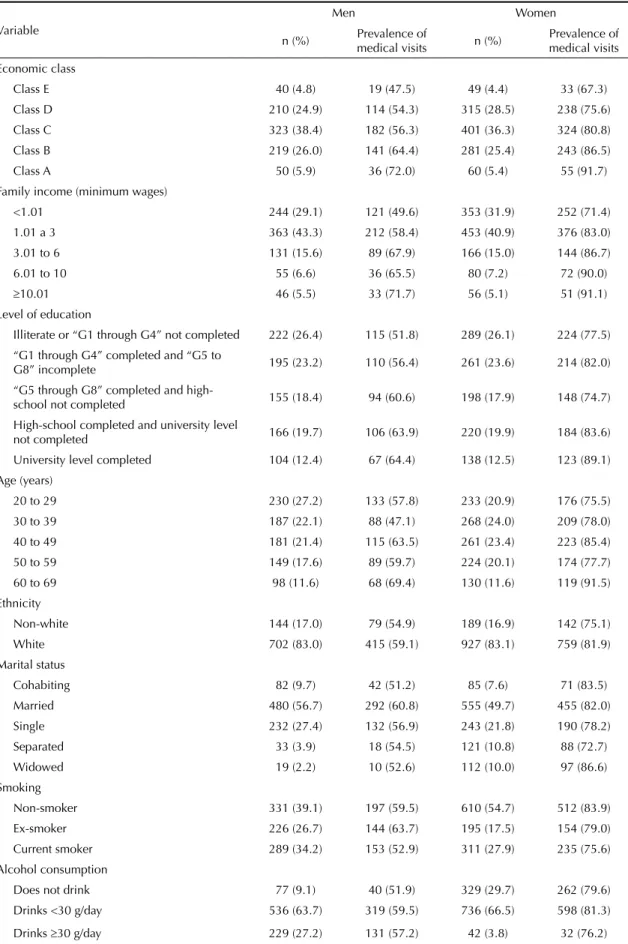
Table 1 shows the sample characteristics according to sex.
Class C predominated among both men and women, the majority of them had a per capita family income ≤3 minimum wages per month, and approximately half of them had not completed grades 5 through 8 (G5 – G8) in school. Likewise, among both sexes, the majority were younger than 50 years of age, white, and married or cohabitating. Over half of the men reported they were either smokers or ex-smokers, almost a third consumed alcoholic beverages abusively, and approximately half were overweight. As regards smoking, less than half of the female interviewees reported they were smokers or ex-smokers, 3.8% of them consumed alcohol abusively, and more than half were overweight.
In terms of morbidity, 5.1% of men mentioned diabetes mellitus, 21.4% had arterial hypertension, 21% minor
psychiatric disorders, and 4.7% chronic bronchitis. Among women, the presence of minor psychiatric disorders predominated, 5.9% mentioned diabetes mellitus, 25.1% had hypertension, and 4.1% chronic bronchitis. Prevalence of hospitalization among men was 6.3%, whereas among women, 21.7%.
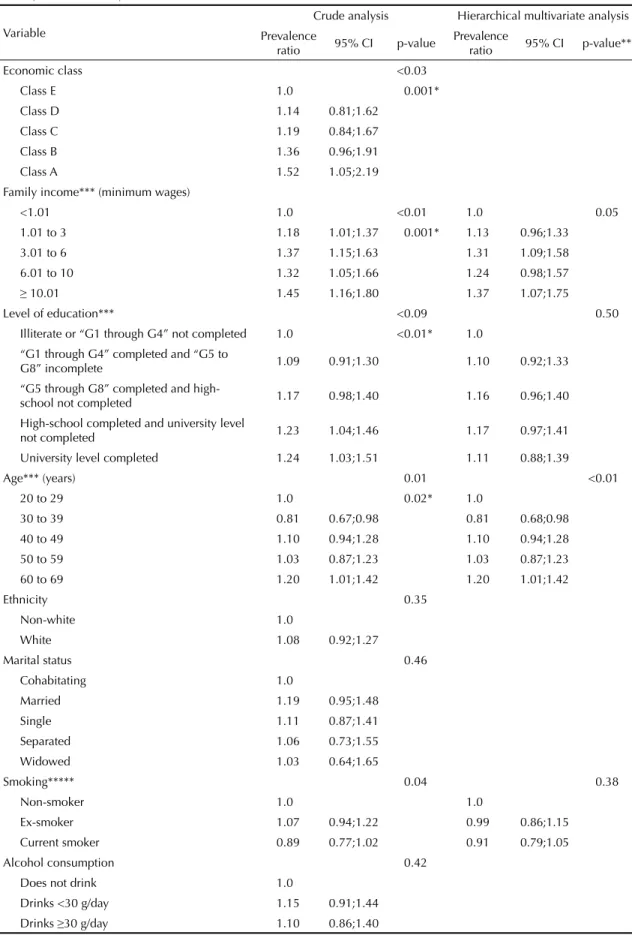
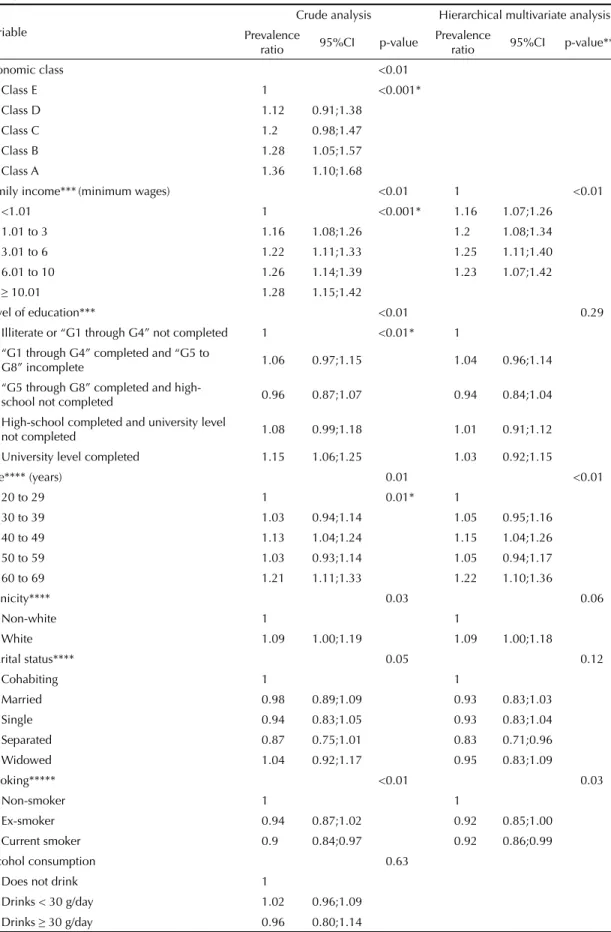
Bivariate analysis showed that the higher the economic class, per capita income and level of education, the more likely men and women were to visit a doctor. These three factors showed signifi cant linear tendency test results (Tables 2 and 3).
Men aged between 30 and 39 years were 20% less likely to visit a doctor in the previous 12 months than those aged over 60 years (reference category).
There were no percentage differences of medical visits in terms of ethnic group or marital status (Table 2). As regards age among women, effect measures were great-er in the 40-to-49-year and 60-to-69-year age groups (Table 3). Frequency of medical visits was 9% higher among those classifi ed as white. Marital status analysis showed that widows visited doctors 4% more frequently. In the assessment of male behavioral variables, smoking (p=0.04) and obesity (p=0.001) were associated with medical visits. In terms of female life habits, bivariate analysis showed that smokers were 10% less likely to visit a doctor than those who never smoked. There were no statistically signifi cant differences between alcohol consumption and BMI (Table 3).
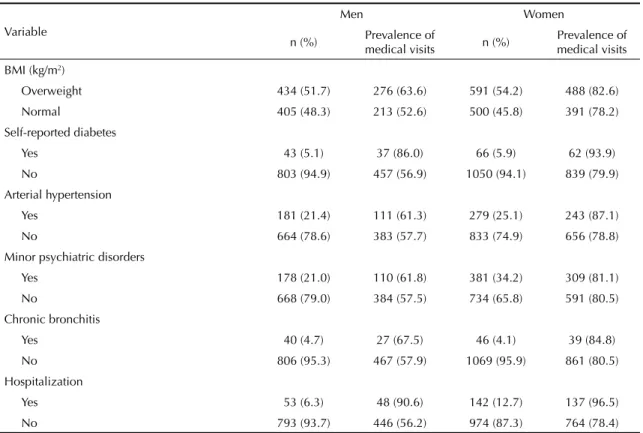
Among morbidities, men who reported diabetes mel-litus visited doctors more often. Arterial hypertension,
Figure. Hierarchical theoretical model for medical visits in
the previous year.
First level
Second level
Third level
Outcome
Presence of chronic diseases
Diabetes mellitus Arterial hypertension Chronic bronchitis Psychiatric disorders
Life habits
Alcohol consumption Smoking
Nutritional status Demographic variables
Age Ethnicity Marital status
Socioeconomic variables
Per capita family income Level of education
Hospitalizations in the previous year
Table 1. Distribution and prevalences of medical visits in the previous year, among men and women, according to socioeconomic and demographic variables, life habits and morbidities. City of Pelotas, Southern Brazil, 1999-2000.
Variable
Men Women
n (%) Prevalence of
medical visits n (%)
Prevalence of medical visits
Economic class
Class E 40 (4.8) 19 (47.5) 49 (4.4) 33 (67.3)
Class D 210 (24.9) 114 (54.3) 315 (28.5) 238 (75.6) Class C 323 (38.4) 182 (56.3) 401 (36.3) 324 (80.8)
Class B 219 (26.0) 141 (64.4) 281 (25.4) 243 (86.5)
Class A 50 (5.9) 36 (72.0) 60 (5.4) 55 (91.7)
Family income (minimum wages)
<1.01 244 (29.1) 121 (49.6) 353 (31.9) 252 (71.4)
1.01 a 3 363 (43.3) 212 (58.4) 453 (40.9) 376 (83.0) 3.01 to 6 131 (15.6) 89 (67.9) 166 (15.0) 144 (86.7)
6.01 to 10 55 (6.6) 36 (65.5) 80 (7.2) 72 (90.0)
≥10.01 46 (5.5) 33 (71.7) 56 (5.1) 51 (91.1)
Level of education
Illiterate or “G1 through G4” not completed 222 (26.4) 115 (51.8) 289 (26.1) 224 (77.5)
“G1 through G4” completed and “G5 to
G8” incomplete 195 (23.2) 110 (56.4) 261 (23.6) 214 (82.0)
“G5 through G8” completed and
high-school not completed 155 (18.4) 94 (60.6) 198 (17.9) 148 (74.7) High-school completed and university level
not completed 166 (19.7) 106 (63.9) 220 (19.9) 184 (83.6) University level completed 104 (12.4) 67 (64.4) 138 (12.5) 123 (89.1)
Age (years)
20 to 29 230 (27.2) 133 (57.8) 233 (20.9) 176 (75.5)
30 to 39 187 (22.1) 88 (47.1) 268 (24.0) 209 (78.0) 40 to 49 181 (21.4) 115 (63.5) 261 (23.4) 223 (85.4)
50 to 59 149 (17.6) 89 (59.7) 224 (20.1) 174 (77.7) 60 to 69 98 (11.6) 68 (69.4) 130 (11.6) 119 (91.5)
Ethnicity
Non-white 144 (17.0) 79 (54.9) 189 (16.9) 142 (75.1)
White 702 (83.0) 415 (59.1) 927 (83.1) 759 (81.9) Marital status
Cohabiting 82 (9.7) 42 (51.2) 85 (7.6) 71 (83.5)
Married 480 (56.7) 292 (60.8) 555 (49.7) 455 (82.0)
Single 232 (27.4) 132 (56.9) 243 (21.8) 190 (78.2) Separated 33 (3.9) 18 (54.5) 121 (10.8) 88 (72.7)
Widowed 19 (2.2) 10 (52.6) 112 (10.0) 97 (86.6)
Smoking
Non-smoker 331 (39.1) 197 (59.5) 610 (54.7) 512 (83.9) Ex-smoker 226 (26.7) 144 (63.7) 195 (17.5) 154 (79.0)
Current smoker 289 (34.2) 153 (52.9) 311 (27.9) 235 (75.6) Alcohol consumption
Does not drink 77 (9.1) 40 (51.9) 329 (29.7) 262 (79.6)
Drinks <30 g/day 536 (63.7) 319 (59.5) 736 (66.5) 598 (81.3)
Drinks ≥30 g/day 229 (27.2) 131 (57.2) 42 (3.8) 32 (76.2)
presence of minor psychiatric disorders and chronic bronchitis did not show statistically signifi cant as-sociation with medical visits among men. Only the occurrence of hospitalization in the previous year was
signifi cantly associated. Among women, presence of
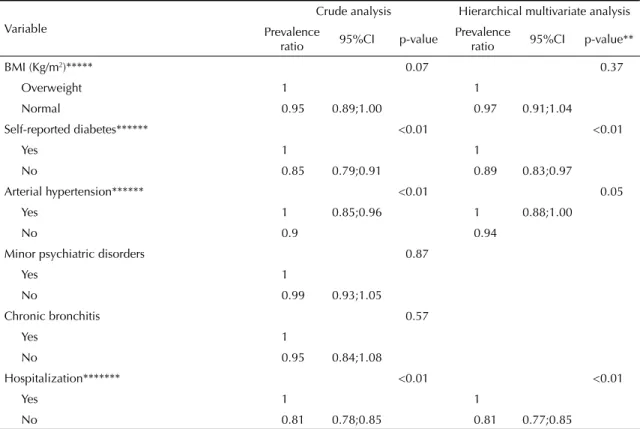
diabetes mellitus and hypertension showed higher prev-alences of medical visits. Presence of minor psychiatric disorders and chronic bronchitis were not associated with the outcome (Table 3). Like men, occurrence of hospitalization in the previous year was related to a higher frequency of visits to doctors (p<0.01).
In the multivariate analysis (Table 2), men with a per capita family income between 3.01 and six minimum wages per month and those with an income higher than 10.01 minimum wages per month visited doctors more often after adjustment for level of education and age. The effect of age was kept in the 60-to-69-year age group. After adjustment for the income and age variables, individuals who reported they had diabetes mellitus, were overweight or had been hospitalized visited doctors more frequently. Among women, multivariate analysis (Table 3) showed that people with a per capita family income from six minimum wages per month, in the 40-to-49-year and above-60-year age groups, and clas-sifi ed as white visited doctors more often. Women who did not smoke, mentioned diabetes mellitus and arterial hypertension, and had been hospitalized in the previous year showed higher outcome prevalences (Table 3).
DISCUSSION
The main methodological diffi culty for studies that investigate service utilization is the lack of outcome validation. Studies on health service utilization are subject to imperfections in terms of quality of informa-tion provided by interviewees. Some authors point to the diffi culty in validating health service utilization.8,15
Despite these limitations, data employed in the analysis originated from a population-based sample, whose make-up in terms of sex and gender was comparable to that found in the city of Pelotas 2000 census, thus confi rming that they are representative.
In this study, prevalence of medical visits in the pre-vious year was high. Among the 1,962 interviewees, 1,395 (70.9%; 95%CI[69.1;73.1]) had visited a doc-tor in the year prior to interview. Mendonza-Sassi & Beria,13 in a systematic review on health service
utilization, observed that in countries such as the United States, Norway, Ireland, and Brazil the cover-age of medical visits during one year reached 60% to 70% of the population. In the city of Pelotas, a study performed in 1992 showed that the utilization coverage in the same age group was 70%.5 In the city
of Rio Grande, Southern Brazil, a population-based, cross-sectional study revealed that 66% of individu-als at age 15 or older had visited a doctor in the year prior to interview.12
Table 1 continuation
Variable
Men Women
n (%) Prevalence of
medical visits n (%)
Prevalence of medical visits
BMI (kg/m2)
Overweight 434 (51.7) 276 (63.6) 591 (54.2) 488 (82.6)
Normal 405 (48.3) 213 (52.6) 500 (45.8) 391 (78.2)
Self-reported diabetes
Yes 43 (5.1) 37 (86.0) 66 (5.9) 62 (93.9)
No 803 (94.9) 457 (56.9) 1050 (94.1) 839 (79.9)
Arterial hypertension
Yes 181 (21.4) 111 (61.3) 279 (25.1) 243 (87.1)
No 664 (78.6) 383 (57.7) 833 (74.9) 656 (78.8)
Minor psychiatric disorders
Yes 178 (21.0) 110 (61.8) 381 (34.2) 309 (81.1)
No 668 (79.0) 384 (57.5) 734 (65.8) 591 (80.5)
Chronic bronchitis
Yes 40 (4.7) 27 (67.5) 46 (4.1) 39 (84.8)
No 806 (95.3) 467 (57.9) 1069 (95.9) 861 (80.5)
Hospitalization
Yes 53 (6.3) 48 (90.6) 142 (12.7) 137 (96.5)
Table 2. Distribution of prevalence ratio and hierarchical multivariate analysis with Poisson regression for men who visited doctors in the previous year, according to socioeconomic and demographic variables, life habits and morbidities. City of Pelotas, Southern Brazil, 1999-2000.
Variable
Crude analysis Hierarchical multivariate analysis Prevalence
ratio 95% CI p-value
Prevalence
ratio 95% CI p-value**
Economic class <0.03
Class E 1.0 0.001*
Class D 1.14 0.81;1.62
Class C 1.19 0.84;1.67
Class B 1.36 0.96;1.91
Class A 1.52 1.05;2.19
Family income*** (minimum wages)
<1.01 1.0 <0.01 1.0 0.05
1.01 to 3 1.18 1.01;1.37 0.001* 1.13 0.96;1.33
3.01 to 6 1.37 1.15;1.63 1.31 1.09;1.58
6.01 to 10 1.32 1.05;1.66 1.24 0.98;1.57
≥ 10.01 1.45 1.16;1.80 1.37 1.07;1.75
Level of education*** <0.09 0.50
Illiterate or “G1 through G4” not completed 1.0 <0.01* 1.0 “G1 through G4” completed and “G5 to
G8” incomplete 1.09 0.91;1.30 1.10 0.92;1.33
“G5 through G8” completed and
high-school not completed 1.17 0.98;1.40 1.16 0.96;1.40 High-school completed and university level
not completed 1.23 1.04;1.46 1.17 0.97;1.41
University level completed 1.24 1.03;1.51 1.11 0.88;1.39
Age*** (years) 0.01 <0.01
20 to 29 1.0 0.02* 1.0
30 to 39 0.81 0.67;0.98 0.81 0.68;0.98
40 to 49 1.10 0.94;1.28 1.10 0.94;1.28
50 to 59 1.03 0.87;1.23 1.03 0.87;1.23
60 to 69 1.20 1.01;1.42 1.20 1.01;1.42
Ethnicity 0.35
Non-white 1.0
White 1.08 0.92;1.27
Marital status 0.46
Cohabitating 1.0
Married 1.19 0.95;1.48
Single 1.11 0.87;1.41
Separated 1.06 0.73;1.55
Widowed 1.03 0.64;1.65
Smoking***** 0.04 0.38
Non-smoker 1.0 1.0
Ex-smoker 1.07 0.94;1.22 0.99 0.86;1.15
Current smoker 0.89 0.77;1.02 0.91 0.79;1.05
Alcohol consumption 0.42
Does not drink 1.0
Drinks <30 g/day 1.15 0.91;1.44 Drinks ≥30 g/day 1.10 0.86;1.40
Data obtained in this study show that, among both sexes, older people visited doctors more frequently. Travassos et al,22 while assessing data from the Pesquisa
Nacional por Amostra de Domicílios – PNAD (National Household Sample Survey) conducted in 1998, in Bra-zil, did not fi nd differences in age among women, but observed that, among men, older individuals showed higher frequency of health service utilization. Other
authors5,12 found an association between older age
group and higher frequency of medical visits. Older individuals showed higher prevalence of chronic, non-communicable diseases that have a greater infl uence on health, requiring more contact with services.3,9
The prevalence of medical visits in the population as-sessed was 9% (95%CI: 1.00;1.18) higher among white women than non-white ones. This fi nding corroborates
what was found by Travassos et al,22 in the PNAD
survey conducted in 1998, where a frequency 14% (95%CI: 1.03;1.26) higher of health service utilization by white women was observed. The following studies, also performed in the city of Pelotas, showed that the quality of health care for women classifi ed as non-white was worse than that received by non-white women.
Quadros et al19 showed that non-white women had less
coverage for cytopathological exams and Sclowitz et al20 revealed low coverage of exams conducted by
non-white women. Thus, this fi nding identifi es a population group that must be prioritized by health services.
Moreover, among women exclusively, marital status infl uenced the frequency of medical visits: those who were separated visited doctors less often in the period of one year prior to interview. Capilheira & Santos4 had
already observed that in the city of Pelotas, separated women showed a 0.89 prevalence ratio for medical visit presence in the three months preceding assessment.
When the relation between per capita family income and outcome is analyzed, there were higher frequen-cies of medical visits in the period of one year among women with higher income. Studies have shown lower health service utilization by populations with low socio-economic level,12,16,22 even though, as already pointed
out, these populations have greater need to use health services,6 thus evidencing inequality. To seek for health
equality means to eliminate inequalities systematically associated with underlying social disadvantages or mar-ginalization. The health system has the responsibility to
Table 2 continuation
Variable
Crude analysis Hierarchical multivariate analysis
Prevalence
ratio 95% CI p-value
Prevalence
ratio 95% CI p-value**
BMI (kg/m2)***** <0.01 0.01
Overweight 1.0 1.0
Normal 0.83 0.74;0.93 0.85 0.75;0.97
Self-reported diabetes***** <0.01 <0.01
Yes 1.0 1.0
No 0.66 0.58;0.76 0.72 0.63;0.84
Arterial hypertension 0.40
Yes 1.0
No 0.94 0.82;1.07
Minor psychiatric disorders 0.31
Yes 1.0
No 0.93 0.81;1.06
Chronic bronchitis
Yes 1.0 0.25
No 0.86 0.69;1.07
Hospitalization****** <0.01 <0.01
Yes 1.0 1.0
No 0.62 0.56;0.69 0.64 0.56;0.73
* Linear tendency test ** Wald test
*** Analysis adjusted for age
**** Analysis adjusted for age, per capita family income and level of education ***** Analysis adjusted for age, family income, smoking, and BMI
Table 3. Distribution of prevalence ratio and hierarchical multivariate analysis with Poisson regression for women who visited doctors in the previous year, according to socioeconomic and demographic variables, life habits and morbidities. City of Pelotas, Southern Brazil, 1999-2000.
Variable
Crude analysis Hierarchical multivariate analysis Prevalence
ratio 95%CI p-value
Prevalence
ratio 95%CI p-value**
Economic class <0.01
Class E 1 <0.001*
Class D 1.12 0.91;1.38
Class C 1.2 0.98;1.47
Class B 1.28 1.05;1.57
Class A 1.36 1.10;1.68
Family income***(minimum wages) <0.01 1 <0.01
<1.01 1 <0.001* 1.16 1.07;1.26
1.01 to 3 1.16 1.08;1.26 1.2 1.08;1.34
3.01 to 6 1.22 1.11;1.33 1.25 1.11;1.40
6.01 to 10 1.26 1.14;1.39 1.23 1.07;1.42
≥ 10.01 1.28 1.15;1.42
Level of education*** <0.01 0.29
Illiterate or “G1 through G4” not completed 1 <0.01* 1 “G1 through G4” completed and “G5 to
G8” incomplete 1.06 0.97;1.15 1.04 0.96;1.14
“G5 through G8” completed and
high-school not completed 0.96 0.87;1.07 0.94 0.84;1.04
High-school completed and university level
not completed 1.08 0.99;1.18 1.01 0.91;1.12
University level completed 1.15 1.06;1.25 1.03 0.92;1.15
Age**** (years) 0.01 <0.01
20 to 29 1 0.01* 1
30 to 39 1.03 0.94;1.14 1.05 0.95;1.16
40 to 49 1.13 1.04;1.24 1.15 1.04;1.26
50 to 59 1.03 0.93;1.14 1.05 0.94;1.17
60 to 69 1.21 1.11;1.33 1.22 1.10;1.36
Ethnicity**** 0.03 0.06
Non-white 1 1
White 1.09 1.00;1.19 1.09 1.00;1.18
Marital status**** 0.05 0.12
Cohabiting 1 1
Married 0.98 0.89;1.09 0.93 0.83;1.03
Single 0.94 0.83;1.05 0.93 0.83;1.04
Separated 0.87 0.75;1.01 0.83 0.71;0.96
Widowed 1.04 0.92;1.17 0.95 0.83;1.09
Smoking***** <0.01 0.03
Non-smoker 1 1
Ex-smoker 0.94 0.87;1.02 0.92 0.85;1.00
Current smoker 0.9 0.84;0.97 0.92 0.86;0.99
Alcohol consumption 0.63
Does not drink 1
Drinks < 30 g/day 1.02 0.96;1.09
facilitate utilization by those who most need it, reducing the burden of diseases. Thus, health services can be promising locations for policies aimed at equality and interventions to reduce impoverishment, due to health care costs, and to prevent decrease in social class due to diseases.24
Among men, obesity was associated with a higher frequency of medical visits in the previous year, as observed by Capilheira & Santos.4 In this study, for both
sexes, the diabetes mellitus reference was associated with higher frequency of medical visits. The association between the presence of chronic diseases and higher health service utilization has been reported by other authors.1 These fi ndings were positive, revealing that
people with recognized needs seek health services.6
Individuals of both sexes, who had been hospitalized, had used health services more frequently. Guerra &
Ramos-Cerqueira7 observed comparable behavior in
the city of São Paulo (Southeastern Brazil), with a frequency of hospitalizations 75% higher among in-dividuals with higher prevalences of medical visits in the year prior to interview.
The present study described characteristics of the popu-lation that visited doctors during one year. However, the reasons that led these individuals to use health services could not be pinpointed. Some suppositions may justify these differences, such as diffi culty to ac-cess these services, self-perception of health, fl awed health care model, and the presence or absence of the family health program.
Table 3 continuation
Variable
Crude analysis Hierarchical multivariate analysis Prevalence
ratio 95%CI p-value
Prevalence
ratio 95%CI p-value**
BMI (Kg/m2)***** 0.07 0.37
Overweight 1 1
Normal 0.95 0.89;1.00 0.97 0.91;1.04
Self-reported diabetes****** <0.01 <0.01
Yes 1 1
No 0.85 0.79;0.91 0.89 0.83;0.97
Arterial hypertension****** <0.01 0.05
Yes 1 0.85;0.96 1 0.88;1.00
No 0.9 0.94
Minor psychiatric disorders 0.87
Yes 1
No 0.99 0.93;1.05
Chronic bronchitis 0.57
Yes 1
No 0.95 0.84;1.08
Hospitalization******* <0.01 <0.01
Yes 1 1
No 0.81 0.78;0.85 0.81 0.77;0.85
* Linear tendency test ** Wald test
*** Analysis adjusted for age, ethnicity and marital status
**** Analysis adjusted for age, level of education and per capita family income ***** Analysis adjusted for age, per capita family income, smoking and MBI
1. Almeida MF, Barata RB, Montero CV, Silva ZP. Prevalence of self reported chronic diseases and health services consumption from the National Household Sample Survey of 1998 in Brazil. Cienc Saude Coletiva. 2002;7(4):743-56.
2. Altman DG. Practical Statistics for Medical Research. London: Chapman & Hall; 1997.
3. Barros MBA, Chester LG, Carandina L, Dalla Torre G. Desigualdades sociais na prevalência de doenças crônicas no Brasil. PNAD 2003. Cienc Saude Coletiva. 2006;11(4):911-26. DOI: 10.1590/S1413-81232006000400014
4. Capilheira MF, Santos IS. Fatores individuais associados à utilização de consultas médicas por adultos. Rev Saude Publica. 2006;40(3):436-43. DOI: 10.1590/S0034-89102006000300011
5. Dias da Costa JS, Facchini LA. Utilização de serviços ambulatoriais em Pelotas: Onde a população consulta? Com que frequência? Rev Saude Publica. 1997;31(4):360-9. DOI: 10.1590/S0034-89101997000400005
6. Droomers M, Westert GP. Do lower socioeconomic groups use more health services, because they suffer from more illnesses? Eur J Public Health. 2004;14(3):311-3. DOI: 10.1093/eurpub/14.3.311
7. Guerra IC, Ramos-Cerqueira ATA. Risco de hospitalizações repetidas em idosos usuários de um centro de saúde escola. Cad Saude Publica. 2007;23(3):585-92. DOI: 10.1590/S0102-311X2007000300017
8. Kroeger A. Health interview surveys in developing countries: review of the methods and results. Int J Epidemiol. 1983;12(4):465-81. DOI: 10.1093/ ije/12.4.465
9. Lima-Costa MF, Barreto SM, Giatti L. Condições de saúde, capacidade funcional, uso de serviços de saúde e gastos com medicamentos da população idosa brasileira: um estudo descritivo baseado na Pesquisa Nacional por Amostras de Domicílios. Cad Saude Publica. 2003;19(3):735-43. DOI: 10.1590/S0102-311X2003000300006
10. Macintyre S. The Black Report and beyond what are the issues? Soc Sci Med. 1997;44(6):723-45. DOI: 10.1016/S0277-9536(96)00183-9
11. Mari JJ, Williams P. A Validity Study of a Psychiatric Screening Questionnaire in Primary Care in the City of São Paulo. Br J Psychiatry. 1986;148:23-6. DOI: 10.1192/bjp.148.1.23
12. Mendoza-Sassi R, Béria JU, Barros AJD. Outpatient health service utilization and associated factors: a population-based study. Rev Saude Publica. 2003;37(3):372-8. DOI: 10.1590/S0034-89102003000300017
13. Mendoza-Sassi R, Béria JU. Utilización de los servicios de salud: una revisión sistemática sobre los factores relacionados. Cad Saude Publica. 2001;17(4):819-32. DOI: 10.1590/S0102-311X2001000400016
14. Moreira LB, Fuchs FD, Moraes RS, Bredemeier M, Cardozo S, Fuchs SC, et al. Alcoholic beverage consumption and associated factors in Porto Alegre, a Southern Brazilian City: a population-based survey. J Studies Alcohol. 1996;57(3):253-9.
15. Nordberg E. Household health surveys in developing countries: could more use be made of them in planning? Health Policy Plan. 1988;3(1):32-9. DOI: 10.1093/heapol/3.1.32
16. Noronha KVMS, Andrade MV. Desigualdades sociais em saúde e na utilização dos serviços de saúde entre os idosos na América Latina. Rev Panam Salud Publica. 2005;17(5-6):410-8. DOI: 10.1590/S1020-49892005000500013
17. Piccini RX, Victora CG. Hipertensão arterial sistêmica no sul do Brasil: prevalência e fatores de risco. Rev Saude Publica. 1994;28(4):261-7. DOI: 10.1590/ S0034-89101994000400004
18. Pinheiro RS, Viacava F, Travassos V, Brito AS. Gênero, morbidade, acesso e utilização de serviços de saúde no Brasil. Cienc Saude Coletiva. 2002;7(4):687-707. DOI: 10.1590/S1413-81232002000400007
19. Quadros CAT, Victora CG, Costa JS. Coverage and focus of a cervical cancer prevention program in southern Brazil. Rev Panam Salud Publica. 2004;16(4):223-32.
20. Sclowitz ML, Menezes AMB, Gigante DP, Tessaro S. Condutas na prevenção secundária do câncer de mama e fatores associados. Rev Saude Publica. 2005;39(3):340-9. DOI: 10.1590/S0034-89102005000300003
21. Tierney LM, Mcphee SJ, Papadakis MA. Current Medical Diagnosis and Treatment. New York: Lange Medical Books/McGraw-Hill; 2005.
22. Travassos C, Viacava F, Pinheiro R, Brito A. Utilização dos serviços de saúde no Brasil: gênero, características familiares e condição social. Rev Panam Salud Publica. 2002;11(5/6):365-73. DOI: 10.1590/S1020-49892002000500011
23. Victora CG, Huttly SR, Fuchs SC, Olinto MTA. The role of conceptual frameworks in epidemiological analysis: a hierarchical approach. Int J Epidemiol. 1997;26(1):224-7. DOI: 10.1093/ije/26.1.224
24. Ostlin P, Braveman P, Dachs N, WHO Task Force on Research Priorities for Equity in Health, WHO Equity Team. Priorities for research to take forward the health equity policy agenda. Bull World Health Organ. 2005;83(12):948-53.
REFERENCES