Body Mass Index and All-Cause Mortality in a Large
Prospective Cohort of White and Black U.S. Adults
Alpa V. Patel*, Janet S. Hildebrand, Susan M. Gapstur
Epidemiology Research Program, American Cancer Society, Atlanta, Georgia, United States of America
Abstract
Remaining controversies on the association between body mass index (BMI) and mortality include the effects of smoking and prevalent disease on the association, whether overweight is associated with higher mortality rates, differences in associations by race and the optimal age at which BMI predicts mortality. To assess the relative risk (RR) of mortality by BMI in Whites and Blacks among subgroups defined by smoking, prevalent disease, and age, 891,572 White and 38,119 Black men and women provided height, weight and other information when enrolled in the Cancer Prevention Study II in 1982. Over 28 years of follow-up, there were 434,400 deaths in Whites and 18,702 deaths in Blacks. Cox proportional-hazards regression was used to estimate multivariable-adjusted relative risks (RR) and 95% confidence intervals (CI). Smoking and prevalent disease status significantly modified the BMI-mortality relationship in Whites and Blacks; higher BMI was most strongly associated with higher risk of mortality among never smokers without prevalent disease. All levels of overweight and obesity were associated with a statistically significantly higher risk of mortality compared to the reference category (BMI 22.5–24.9 kg/m2), except among Black women where risk was elevated but not statistically significant in the lower end of overweight. Although absolute mortality rates were higher in Blacks than Whites within each BMI category, relative risks (RRs) were similar between race groups for both men and women (p-heterogeneity by race = 0.20 for men and 0.23 for women). BMI was most strongly associated with mortality when reported before age 70 years. Results from this study demonstrate for the first time that the BMI-mortality relationship differs for men and women who smoke or have prevalent disease compared to healthy never-smokers. These findings further support recommendations for maintaining a BMI between 20–25 kg/m2for optimal health and longevity.
Citation:Patel AV, Hildebrand JS, Gapstur SM (2014) Body Mass Index and All-Cause Mortality in a Large Prospective Cohort of White and Black U.S. Adults. PLoS ONE 9(10): e109153. doi:10.1371/journal.pone.0109153
Editor:Gianluigi Forloni, "Mario Negri" Institute for Pharmacological Research, Italy ReceivedApril 1, 2014;AcceptedSeptember 7, 2014;PublishedOctober 8, 2014
Copyright:ß2014 Patel et al. This is an open-access article distributed under the terms of the Creative Commons Attribution License, which permits unrestricted use, distribution, and reproduction in any medium, provided the original author and source are credited.
Data Availability:The authors confirm that, for approved reasons, some access restrictions apply to the data underlying the findings. Data are from the Cancer Prevention Study-II Nutrition Cohort whose authors may be contacted at cancer.org/preventcancer.
Funding:The authors have no support or funding to report.
Competing Interests:The authors have declared that no competing interests exist. * Email: [email protected]
Introduction
Excess body weight is known to increase risk of premature mortality and various chronic diseases including cardiovascular disease, diabetes, and various types of cancer [1,2]. Both the disease etiology implications and public health impact of high body mass index (BMI) are vitally important given the extremely high rates of overweight and obesity in the U.S. and worldwide. Numerous observational studies [2–5] have reported on the relationship between obesity and mortality with quantitatively and qualitatively varied results.
Despite the large number of studies to date, four major unresolved issues in the study of obesity and mortality still exist. The first two related issues include whether overweight (BMI 25–,30 kg/m2) is beneficial or detrimental in relation to total mortality and to what extent smoking and prevalent disease, conditions that both cause weight loss and shortened survival, influence the relationship between overweight and total mortality. A large pooled analysis that included 1.46 million Caucasian men and women found that smoking and prevalent disease significantly modified the BMI-mortality relationship. Among healthy, never smokers there was a statistically significant higher risk of mortality in underweight (BMI ,18.5 kg/m2) and in the lowest end of
normal weight (18.5–19.9 kg/m2) groups as well as overweight and obese individuals compared to the upper end of normal weight (22.5–24.9 kg/m2), and optimal BMI was between 20.0 and 24.9 kg/m2 [3]. Conversely, a recent meta-analysis [5] including 97 studies reported that overweight was associated with lower all-cause mortality compared to normal weight, and reported that exclusion of smokers and individuals with prevalent disease had little effect on the magnitude of risk estimates. Unlike the large pooled analysis, the meta-analysis by Flegal et al, examined associations relative to the full range of normal weight (reference category was 18.5–24.9 kg/m2). Inclusion of the low
end of the normal weight in the reference group would result in mortality rates that are higher than if the reference group were limited to the apparently optimal range of 20–24.9 kg/m2, and would result in a lower observed relative risk in the overweight group, especially when smokers and individuals with prevalent disease are included.
The third issue is whether the association between BMI and mortality differs by race. While recent, large pooled analyses have examined the relationship between BMI and all-cause death rates in Caucasians [3] and Asians [6], the BMI-mortality dose-response relationship has not been well-characterized in African Americans.
Among the relatively few studies on this issue in African Americans [4,7–17], most [8,10,12–17] suggest that the association between BMI and mortality may be weaker in Blacks than Whites. However, studies of African Americans had relatively small sample sizes and/or short follow-up time. Finally, the fourth issue is that the appropriate age window of the exposure (the age at which body mass maximally predicts subsequent mortality) remains unclear. Results of various studies suggest that BMI measured at younger ages is more predictive of subsequent mortality long term because it is more effective in measuring adiposity and accounting for pre-existing disease than BMI measured later in life [4,8,9,18– 21].
The American Cancer Society’s Cancer Prevention Study II is well-suited to the study of BMI in relation to mortality, due to its prospective design, large size of both Black and White men and women, and long follow-up period. Our initial paper examining the association between BMI and total mortality was published in 1999 when the cohort had been followed for 14 years [4]. That analysis was based on 14-years of follow-up and had a limited number deaths among Black men and women, especially among those who were obese (n = 83 deaths among men, n = 319 deaths among women). Here, we present results on the four issues described above with follow-up extended to 28 years including over 450,000 deaths.
Methods
Study Population
Subjects for this analysis were selected from the 1,184,387 participants (508,227 men and 676,160 women) in the Cancer Prevention Study II, a prospective study of mortality among men and women in the United States begun by the American Cancer Society in 1982 [22]. Participants were identified and enrolled by more than 77,000 volunteers in all 50 states, the District of Columbia, and Puerto Rico. Families were enrolled if at least one household member was 45 years of age or older, and all enrolled members were at least 30 years old. The average age of participants at enrollment was 57 years old. In 1982, participants completed a confidential questionnaire, through which they provided information on demographic characteristics, personal and family history of cancer and other diseases, environmental and occupational exposures, and factors related to lifestyle, behavior and diet. All aspects of CPS-II have been reviewed and approved by the Emory University Institutional Review Board, and all data were de-identified prior to analysis.
Participants were asked to provide their current weight, weight one year prior to enrollment, and height (without shoes). Subjects with missing values for height or current weight were excluded from the analysis (N = 29,320), as were those with extreme values (99.9th percentile) for height or weight or extreme underweight (BMI ,15) (N = 6,484). In order to adequately control for smoking, we excluded subjects with missing data for the smoking questions (N = 46,900), smokers with no information on number of cigarettes per day (N = 87,342), former smokers with no informa-tion on years since quitting (N = 2,080), and smokers whose smoking status at baseline (current or former) was unknown (N = 20,068). We also excluded men who had smoked only pipes or cigars but not cigarettes (N = 40,462) because their amount of smoking was not well defined; pipe and cigar smoking was not queried in women. Finally, we excluded all races other than White or Black (N = 21,860). The remaining eligible population, after exclusions, consisted of 341,196 White men (194,588 deaths), 12,559 Black men (7,368 deaths), 550,556 White women (239,812 deaths), and 25,560 Black women (11,334 deaths).
Classifying Body-Mass Index
Body-mass index (BMI) (kg/m2) was classified as follows: 15.0 to 18.4, 18.5 to 19.9; 20.0 to 22.4; 22.5 to 24.9 (reference group); 25.0 to 27.4; 27.5 to 29.9; 30.0 to 34.9; 35.0 to 39.9; 40.0 and higher. Due to small numbers, the highest category examined for Black men was 35.0 and higher. This categorization scheme includes finer groupings of the World Health Organization (WHO) definitions of ‘‘underweight’’ as body mass index (BMI) less than 18.5 kg/m2, the ‘‘normal’’ range 18.5 to 24.9 kg/m2, ‘‘overweight’’ range 25.0 to 29.9 kg/m2, and ‘‘obese’’ as greater than or equal to 30.0 kg/m2 [23]. Additionally, these finer groupings were selected a priori for consistency with several previously published studies including the large pooled study of 1.46 million White participants reporting the nadir of the dose-response curve was at BMI 22.5 to 24.9 [3].
End Points
Deaths occurring between the months of enrollment and December 31, 2010, were ascertained through personal inquiries by volunteers in September 1984, September 1986, and Septem-ber 1988, and thereafter through linkage with the National Death Index (NDI) [24]. As of December 31, 2010, 50.5 percent of the participants had died and 49.5 percent were still living; 0.3 percent were lost to follow-up on September 1, 1988 due to insufficient data for linkage with the NDI. Multiple cause-of-death codes have been obtained for 99.3 percent of all deaths.
The primary end point in this analysis was deaths from all causes. In secondary analyses, deaths from all cardiovascular disease (ICD-9 codes 390 through 459; ICD-10 codes I00 through I99), all cancer (ICD-9 codes 140 through 208; ICD-10 codes C00 through C97), and all other causes, were examined separately in relation to BMI.
Statistical Analysis
Age-adjusted mortality rates according to BMI in men and women, race-specific, were calculated by direct standardization to the age distribution of the CPS-II male and female populations using 5-year age categories. Multivariable-adjusted relative risks (RRs) and 95% confidence intervals (CIs) were estimated in Cox proportional-hazards regression models stratifying on single year of age at enrollment. Models simultaneously adjusted for education (less than high school, high school graduate, some college/vocational training, college graduate and higher), physical activity (none, slight, moderate, or heavy exercise), alcohol use (nondrinker,,1 drink per day, 1 drink per day,.1 drink daily), marital status (married vs. single, widowed, or divorced), aspirin use (yes/no), fat consumption, vegetable consumption (sex-specific tertiles), and estrogen replacement therapy among women (yes/ no). Models that included ever smokers were also adjusted for smoking status, frequency and time since quitting (current smoker with cigarettes per day (cpd) categorized as#10, 11–20, 21–30, 31–40, or 40 or more; former smoker having quit within the last year and smoked#10, 11–20, 21–30, 31–40, or 40 or more cpd; former smoker having quit 1 to 9 years prior and smoked#10, 11–20, 21–30, 31–40, or 40 or more cpd; former smoker having quit 10–19 years prior and smoked#10, 11–20, 21–30, 31–40, 40 or more cpd, and former smoker having quit at least 20 years prior and smoked#10, 11–20, 21–30, 31–40, or 40 or more cpd) and those that included prevalent disease also adjusted for disease status (no/yes for cancer, heart disease, stroke, or emphysema; yes for chronic bronchitis or asthma).
We examined the association between BMI and all-cause mortality for each of four mutually exclusive race and gender-specific subgroups according to smoking status [never, ever] and
Body Mass Index and Mortality in White and Black US Adults
Table 1.Baseline characteristics of all CPS-II men and women by race and BMI (kg/m2).
Characteristic BMI (kg/m2)
15.0–18.4 18.5–19.9 20.0–22.4 22.5–24.9 25.0–27.4 27.5–29.9 30.0–34.9 35.0–39.9 $40.0
MEN
White Race (Total N = 341,196; Deaths = 194,588)
Number of men 2,535 5,115 36,781 93,990 115,561 53,776 29,324 3,744 370
Number of deaths 1,940 3,609 22,402 52,358 63,552 30,453 17,615 2,415 244
Mean Age (yrs) 62 60 58 58 57 56 55 54 53
$High school (%)a 55.6 58.7 66.3 67.8 64.0 58.8 56.4 53.8 51.3
Married (%)a 89.5 90.0 92.2 94.3 95.4 95.4 94.9 93.8 87.4
Nondrinker (%)a 19.8 21.1 18.7 17.3 16.6 17.1 18.3 21.2 24.4
Never smoker (%)a 24.0 26.6 33.0 34.8 34.1 33.5 34.2 34.4 32.4
Prevalent diseases (%)a 50.4 42.4 33.8 31.7 32.6 34.9 37.6 42.5 41.4
Black Race (Total N = 12,559; Deaths = 7,368)
Number of men 119 250 1,368 2,799 3,807 2,289 1,624 264 39
Number of deaths 82 180 818 1,611 2,200 1,319 977 153 28
Mean Age (yrs) 59 57 55 56 55 55 54 52 52
$High school (%)a 48.6 38.9 51.6 54.6 53.0 52.6 45.9 38.7 37.4
Married (%)a 75.4 75.2 79.1 84.3 84.6 87.9 85.6 85.5 88.5
Nondrinker (%)a 16.1 14.7 13.7 15.5 16.2 17.1 16.9 17.6 20.2
Never smoker (%)a 26.6 17.9 24.4 31.6 33.7 38.3 43.9 44.9 42.4
Prevalent diseases (%)a 44.9 40.9 32.2 29.2 31.9 34.2 40.1 41.6 48.8
WOMEN
White Race (Total N = 550,556; Deaths = 239,812)
Number of women 14,076 41,470 148,270 144,815 98,373 46,003 43,610 10,738 3,201
Number of deaths 7,681 16,271 56,019 61,462 46,167 22,870 22,033 5,536 1,773
Mean Age (yrs) 58 55 55 57 58 58 57 54 53
$High school (%)a 61.0 64.0 61.9 56.1 52.0 48.8 46.7 45.3 43.1
Married (%)a 69.8 74.4 77.9 79.0 78.3 76.7 74.8 72.3 67.3
Nondrinker (%)a 21.6 19.7 19.2 20.4 22.0 24.0 25.8 28.8 28.9
Never smoker (%)a 45.1 50.0 53.9 57.8 61.7 64.2 66.1 65.0 64.3
Prevalent diseases (%)a 37.2 30.7 29.7 32.2 35.2 38.6 42.1 47.9 50.6
Black Race (Total N = 25,560; Deaths = 11,334)
Number of women 403 779 3,324 5,295 5,757 3,603 4,513 1,345 541
Number of deaths 214 333 1,285 2,032 2,497 1,706 2,256 698 313
Mean Age (yrs) 56 54 54 54 56 56 56 54 54
$High school (%)a 55.4 60.4 62.2 59.5 54.5 50.6 46.0 42.0 38.1
Body
Mass
Index
and
Mortality
in
White
and
Black
US
Adults
ONE
|
www.ploson
e.org
3
October
2014
|
Volume
9
|
Issue
10
|
prevalent disease status [yes/no] defined as a history of cancer (except non-melanoma skin cancer), heart disease, stroke, respi-ratory diseases (chronic bronchitis, emphysema, or asthma), current illness of any kind, or weight loss of 10 or more lbs (4.5 kg) in the previous year. Effect modification by smoking and prevalent disease combined (healthy never smokers, healthy smokers, never smokers with prevalent disease, smokers with prevalent disease) and by race were evaluated in multivariate models using the likelihood ratio test and a p-value ,0.05 was considered statistically significant. In Black and Whites combined, we examined the association between BMI and mortality by age at enrollment (younger than 50, 50–59, 60–69, 70 years or older) but this analysis was limited to the healthy never smokers because smoking and prevalent disease significantly modified the associa-tion between BMI and mortality. Finally, we examined the associations of BMI with cardiovascular disease and cancer mortality separately.
Results
The mean age at baseline was 56 years old for White men, 55 for Black men, 57 for White women and 55 for Black women. The mean BMI was 25.8, 26.8, 24.6, 27.1 kg/m2for White and Black men and women, respectively. Selected baseline characteristics for each sex-race group by BMI category are presented in Table 1. BMI was inversely related to age at baseline for all groups except Black women. A strong positive relationship was observed between BMI and the prevalence of never smokers in both men and women at the time of enrollment, regardless of race. In contrast, there was a curvilinear relationship between BMI and prevalent disease, such that individuals at both high and low extremes of BMI were more likely to report disease at baseline than persons within the WHO normal range of BMI (18.5–24.9 kg/m2). For all groups,
BMI was also inversely related to educational status at BMI levels of 22.5 kg/m2or greater.
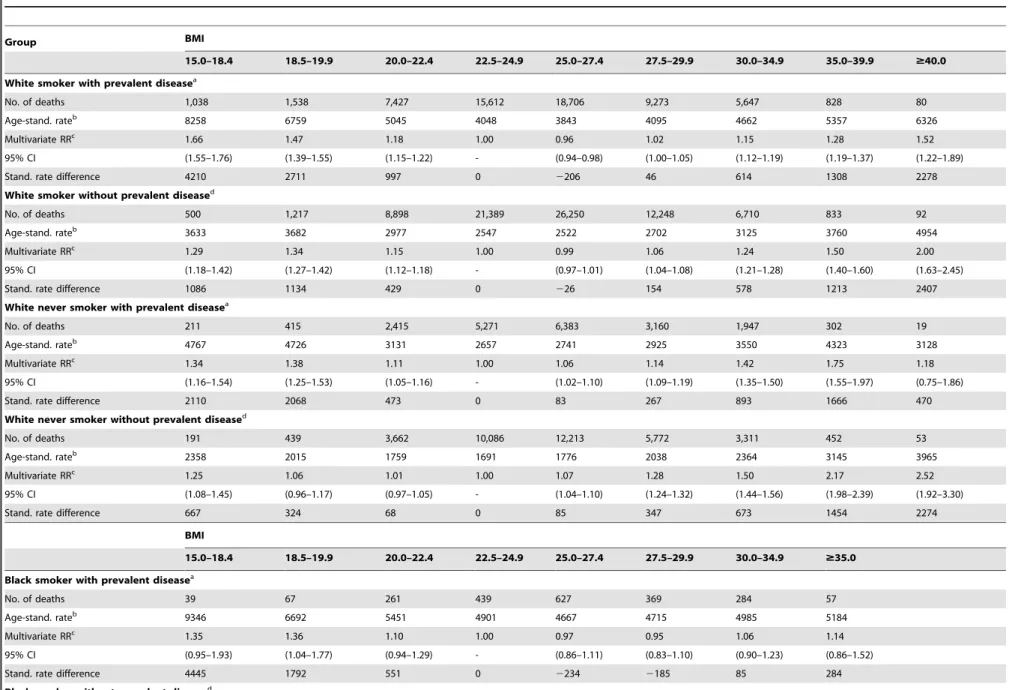
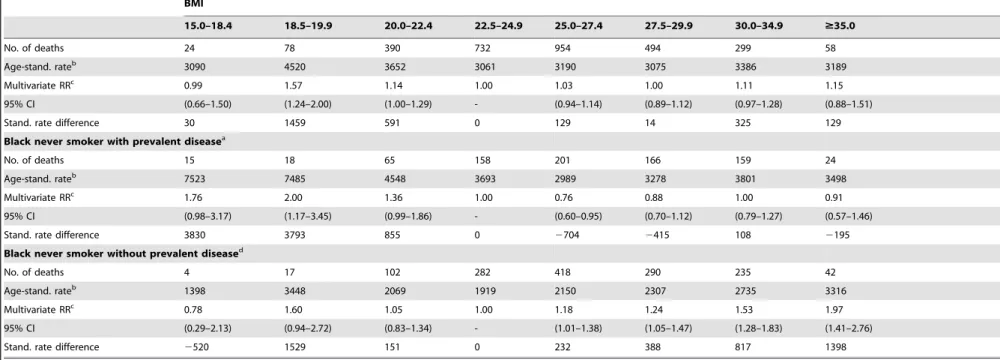
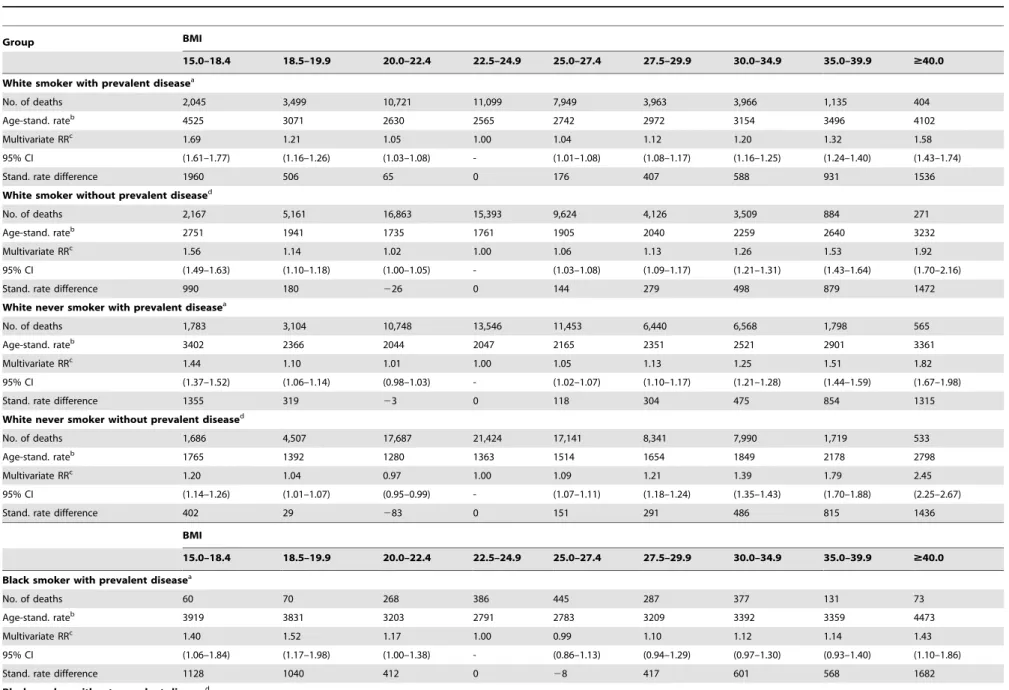
Tables 2 and 3 present the BMI-mortality relationship by race for men and women, respectively, stratified by smoking and prevalent disease status. Smoking and prevalent disease modified the association between BMI and mortality in all four groups (interaction p = 2.4610239
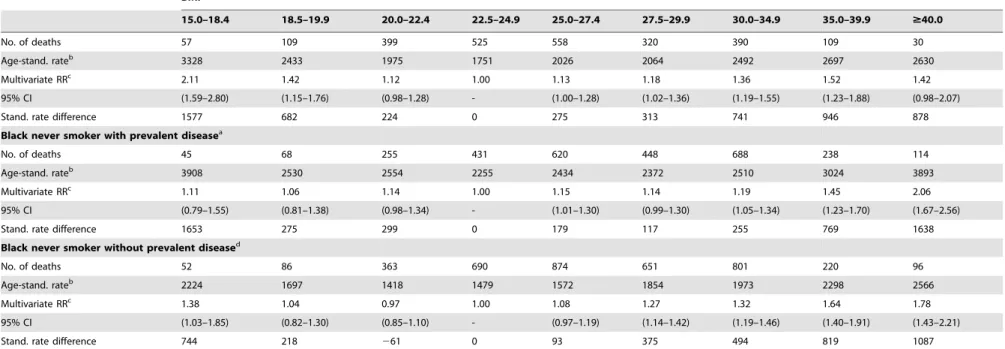
for White men, p = 0.055 for Black men, p = 1.6610232 for White women, and p = 0.02 for Black women). For White men and women, regardless of smoking status or prevalent disease, underweight was associated with higher risk of mortality compared to BMI 22.5–24.9 kg/m2. For Black men, underweight was associated with higher risk of mortality in those with prevalent disease, regardless of smoking status, but not in Black men without prevalent disease. In Black women, under-weight was associated with higher mortality in all groups, albeit a non-statistically significant elevated risk for the group defined as never smokers with prevalent disease. Among all underweight BMI categories, age-standardized death rates were highest in men and women who smoked and had prevalent disease, and rates were lowest in healthy never smokers.
Relative risks were higher for overweight and obese compared to the upper end of normal weight (BMI 22.5–24.9 kg/m2) among the healthy never smokers compared to those who smoked and/or had prevalent disease (Tables 2 and 3). In this group of never smokers without prevalent disease, among both men and women, the RR’s for overweight Blacks appear to be similar in magnitude to those for Whites whereas at the highest levels of BMI, the RR’s for Blacks appear to be marginally lower compared to those for Whites. For example, among healthy never smokers, the multivariable-adjusted RR for White women with BMI.
= 40 kg/m2 was 2.45 (95% CI 2.25–2.67) whereas it was 1.78
Table 1. Cont. Characteristic BMI (kg/m 2) 15.0–18.4 18.5–19.9 20.0–22.4 22.5–24.9 25.0–27.4 27.5–29.9 30.0–34.9 35.0–39.9 $ 40.0 Married (%) a 50.9 51.2 58.3 62.1 61.9 62.3 5 9.2 54.5 51.8 Nondrinker (%) a 19.7 18.9 19.4 20.1 20.8 22.0 2 1.9 23.5 27.2 Never smoker (%) a 42.3 46.6 50.0 55.8 59.5 63.3 6 6.0 65.7 67.5 Prevalent diseases (%) a 40.8 31.0 29.6 31.4 35.2 36.6 4 1.7 46.7 51.7 aAdjusted to the age d istribution o f the CPS-II male/female population. doi:10.1371/journal.pone. 0109153.t001
Body Mass Index and Mortality in White and Black US Adults
Table 2.Rates and relative risks of death from any cause among men according to BMI, smoking, prevalent disease status and race, CPS-II 1982-2010.
Group BMI
15.0–18.4 18.5–19.9 20.0–22.4 22.5–24.9 25.0–27.4 27.5–29.9 30.0–34.9 35.0–39.9 $40.0
White smoker with prevalent diseasea
No. of deaths 1,038 1,538 7,427 15,612 18,706 9,273 5,647 828 80
Age-stand. rateb 8258 6759 5045 4048 3843 4095 4662 5357 6326
Multivariate RRc 1.66 1.47 1.18 1.00 0.96 1.02 1.15 1.28 1.52
95% CI (1.55–1.76) (1.39–1.55) (1.15–1.22) - (0.94–0.98) (1.00–1.05) (1.12–1.19) (1.19–1.37) (1.22–1.89)
Stand. rate difference 4210 2711 997 0 2206 46 614 1308 2278
White smoker without prevalent diseased
No. of deaths 500 1,217 8,898 21,389 26,250 12,248 6,710 833 92
Age-stand. rateb 3633 3682 2977 2547 2522 2702 3125 3760 4954
Multivariate RRc 1.29 1.34 1.15 1.00 0.99 1.06 1.24 1.50 2.00
95% CI (1.18–1.42) (1.27–1.42) (1.12–1.18) - (0.97–1.01) (1.04–1.08) (1.21–1.28) (1.40–1.60) (1.63–2.45)
Stand. rate difference 1086 1134 429 0 226 154 578 1213 2407
White never smoker with prevalent diseasea
No. of deaths 211 415 2,415 5,271 6,383 3,160 1,947 302 19
Age-stand. rateb 4767 4726 3131 2657 2741 2925 3550 4323 3128
Multivariate RRc 1.34 1.38 1.11 1.00 1.06 1.14 1.42 1.75 1.18
95% CI (1.16–1.54) (1.25–1.53) (1.05–1.16) - (1.02–1.10) (1.09–1.19) (1.35–1.50) (1.55–1.97) (0.75–1.86)
Stand. rate difference 2110 2068 473 0 83 267 893 1666 470
White never smoker without prevalent diseased
No. of deaths 191 439 3,662 10,086 12,213 5,772 3,311 452 53
Age-stand. rateb 2358 2015 1759 1691 1776 2038 2364 3145 3965
Multivariate RRc 1.25 1.06 1.01 1.00 1.07 1.28 1.50 2.17 2.52
95% CI (1.08–1.45) (0.96–1.17) (0.97–1.05) - (1.04–1.10) (1.24–1.32) (1.44–1.56) (1.98–2.39) (1.92–3.30)
Stand. rate difference 667 324 68 0 85 347 673 1454 2274
BMI
15.0–18.4 18.5–19.9 20.0–22.4 22.5–24.9 25.0–27.4 27.5–29.9 30.0–34.9 $35.0
Black smoker with prevalent diseasea
No. of deaths 39 67 261 439 627 369 284 57
Age-stand. rateb 9346 6692 5451 4901 4667 4715 4985 5184
Multivariate RRc 1.35 1.36 1.10 1.00 0.97 0.95 1.06 1.14
95% CI (0.95–1.93) (1.04–1.77) (0.94–1.29) - (0.86–1.11) (0.83–1.10) (0.90–1.23) (0.86–1.52)
Stand. rate difference 4445 1792 551 0 2234 2185 85 284
Black smoker without prevalent diseased
Body
Mass
Index
and
Mortality
in
White
and
Black
US
Adults
ONE
|
www.ploson
e.org
5
October
2014
|
Volume
9
|
Issue
10
|
Table 2.Cont.
BMI
15.0–18.4 18.5–19.9 20.0–22.4 22.5–24.9 25.0–27.4 27.5–29.9 30.0–34.9 $35.0
No. of deaths 24 78 390 732 954 494 299 58
Age-stand. rateb 3090 4520 3652 3061 3190 3075 3386 3189
Multivariate RRc 0.99 1.57 1.14 1.00 1.03 1.00 1.11 1.15
95% CI (0.66–1.50) (1.24–2.00) (1.00–1.29) - (0.94–1.14) (0.89–1.12) (0.97–1.28) (0.88–1.51)
Stand. rate difference 30 1459 591 0 129 14 325 129
Black never smoker with prevalent diseasea
No. of deaths 15 18 65 158 201 166 159 24
Age-stand. rateb 7523 7485 4548 3693 2989 3278 3801 3498
Multivariate RRc 1.76 2.00 1.36 1.00 0.76 0.88 1.00 0.91
95% CI (0.98–3.17) (1.17–3.45) (0.99–1.86) - (0.60–0.95) (0.70–1.12) (0.79–1.27) (0.57–1.46)
Stand. rate difference 3830 3793 855 0 2704 2415 108 2195
Black never smoker without prevalent diseased
No. of deaths 4 17 102 282 418 290 235 42
Age-stand. rateb 1398 3448 2069 1919 2150 2307 2735 3316
Multivariate RRc 0.78 1.60 1.05 1.00 1.18 1.24 1.53 1.97
95% CI (0.29–2.13) (0.94–2.72) (0.83–1.34) - (1.01–1.38) (1.05–1.47) (1.28–1.83) (1.41–2.76)
Stand. rate difference 2520 1529 151 0 232 388 817 1398
aOne or more of the following conditions was reported at study entry: prevalent cancer (except non melanoma skin), heart disease, stroke, respiratory disease (chronic bronchitis, emphysema, asthma), currently sick, or weight loss
of$10 lbs. in past year.
bRate per 100,000 standardized to the age-distribution of the CPS-II men.
cCox proportional hazards model, adjusted for age, race, education, physical activity, alcohol use, marital status, aspirin use, fat consumption, and vegetable consumption
dNone of the conditions listed in footnote(a) were reported.
doi:10.1371/journal.pone.0109153.t002
Body
Mass
Index
and
Mortality
in
White
and
Black
US
Adults
PLOS
ONE
|
www.ploson
e.org
6
October
2014
|
Volume
9
|
Issue
10
|
Table 3.Relative risks of death from any cause among women according to BMI, smoking, prevalent disease status and race, CPS-II 1982–2010.
Group BMI
15.0–18.4 18.5–19.9 20.0–22.4 22.5–24.9 25.0–27.4 27.5–29.9 30.0–34.9 35.0–39.9 $40.0
White smoker with prevalent diseasea
No. of deaths 2,045 3,499 10,721 11,099 7,949 3,963 3,966 1,135 404
Age-stand. rateb 4525 3071 2630 2565 2742 2972 3154 3496 4102
Multivariate RRc 1.69 1.21 1.05 1.00 1.04 1.12 1.20 1.32 1.58
95% CI (1.61–1.77) (1.16–1.26) (1.03–1.08) - (1.01–1.08) (1.08–1.17) (1.16–1.25) (1.24–1.40) (1.43–1.74)
Stand. rate difference 1960 506 65 0 176 407 588 931 1536
White smoker without prevalent diseased
No. of deaths 2,167 5,161 16,863 15,393 9,624 4,126 3,509 884 271
Age-stand. rateb 2751 1941 1735 1761 1905 2040 2259 2640 3232
Multivariate RRc 1.56 1.14 1.02 1.00 1.06 1.13 1.26 1.53 1.92
95% CI (1.49–1.63) (1.10–1.18) (1.00–1.05) - (1.03–1.08) (1.09–1.17) (1.21–1.31) (1.43–1.64) (1.70–2.16)
Stand. rate difference 990 180 226 0 144 279 498 879 1472
White never smoker with prevalent diseasea
No. of deaths 1,783 3,104 10,748 13,546 11,453 6,440 6,568 1,798 565
Age-stand. rateb 3402 2366 2044 2047 2165 2351 2521 2901 3361
Multivariate RRc 1.44 1.10 1.01 1.00 1.05 1.13 1.25 1.51 1.82
95% CI (1.37–1.52) (1.06–1.14) (0.98–1.03) - (1.02–1.07) (1.10–1.17) (1.21–1.28) (1.44–1.59) (1.67–1.98)
Stand. rate difference 1355 319 23 0 118 304 475 854 1315
White never smoker without prevalent diseased
No. of deaths 1,686 4,507 17,687 21,424 17,141 8,341 7,990 1,719 533
Age-stand. rateb 1765 1392 1280 1363 1514 1654 1849 2178 2798
Multivariate RRc 1.20 1.04 0.97 1.00 1.09 1.21 1.39 1.79 2.45
95% CI (1.14–1.26) (1.01–1.07) (0.95–0.99) - (1.07–1.11) (1.18–1.24) (1.35–1.43) (1.70–1.88) (2.25–2.67)
Stand. rate difference 402 29 283 0 151 291 486 815 1436
BMI
15.0–18.4 18.5–19.9 20.0–22.4 22.5–24.9 25.0–27.4 27.5–29.9 30.0–34.9 35.0–39.9 $40.0
Black smoker with prevalent diseasea
No. of deaths 60 70 268 386 445 287 377 131 73
Age-stand. rateb 3919 3831 3203 2791 2783 3209 3392 3359 4473
Multivariate RRc 1.40 1.52 1.17 1.00 0.99 1.10 1.12 1.14 1.43
95% CI (1.06–1.84) (1.17–1.98) (1.00–1.38) - (0.86–1.13) (0.94–1.29) (0.97–1.30) (0.93–1.40) (1.10–1.86)
Stand. rate difference 1128 1040 412 0 28 417 601 568 1682
Black smoker without prevalent diseased
Body
Mass
Index
and
Mortality
in
White
and
Black
US
Adults
ONE
|
www.ploson
e.org
7
October
2014
|
Volume
9
|
Issue
10
|
Table 3.Cont.
BMI
15.0–18.4 18.5–19.9 20.0–22.4 22.5–24.9 25.0–27.4 27.5–29.9 30.0–34.9 35.0–39.9 $40.0
No. of deaths 57 109 399 525 558 320 390 109 30
Age-stand. rateb 3328 2433 1975 1751 2026 2064 2492 2697 2630
Multivariate RRc 2.11 1.42 1.12 1.00 1.13 1.18 1.36 1.52 1.42
95% CI (1.59–2.80) (1.15–1.76) (0.98–1.28) - (1.00–1.28) (1.02–1.36) (1.19–1.55) (1.23–1.88) (0.98–2.07)
Stand. rate difference 1577 682 224 0 275 313 741 946 878
Black never smoker with prevalent diseasea
No. of deaths 45 68 255 431 620 448 688 238 114
Age-stand. rateb 3908 2530 2554 2255 2434 2372 2510 3024 3893
Multivariate RRc 1.11 1.06 1.14 1.00 1.15 1.14 1.19 1.45 2.06
95% CI (0.79–1.55) (0.81–1.38) (0.98–1.34) - (1.01–1.30) (0.99–1.30) (1.05–1.34) (1.23–1.70) (1.67–2.56)
Stand. rate difference 1653 275 299 0 179 117 255 769 1638
Black never smoker without prevalent diseased
No. of deaths 52 86 363 690 874 651 801 220 96
Age-stand. rateb 2224 1697 1418 1479 1572 1854 1973 2298 2566
Multivariate RRc 1.38 1.04 0.97 1.00 1.08 1.27 1.32 1.64 1.78
95% CI (1.03–1.85) (0.82–1.30) (0.85–1.10) - (0.97–1.19) (1.14–1.42) (1.19–1.46) (1.40–1.91) (1.43–2.21)
Stand. rate difference 744 218 261 0 93 375 494 819 1087
aOne or more of the following conditions was reported at study entry: prevalent cancer (except non melanoma skin), heart disease, stroke, respiratory disease (chronic bronchitis, emphysema, asthma), currently sick, or weight loss
of$10 lbs. in past year.
bRate per 100,000 standardized to the age-distribution of the CPS-II women.
cCox proportional hazards model, adjusted for age, race, education, physical activity, alcohol use, marital status, aspirin use, fat consumption, vegetable consumption, and postmenopausal estrogen use
dNone of the conditions listed in footnote(a) were reported.
doi:10.1371/journal.pone.0109153.t003
Body
Mass
Index
and
Mortality
in
White
and
Black
US
Adults
PLOS
ONE
|
www.ploson
e.org
8
October
2014
|
Volume
9
|
Issue
10
|
Table 4.Relative risks of death from any cause according to BMI and age at enrollment among men and women who are never smokers without prevalent disease, CPS-II 1982– 2010.
Group BMI
15.0–18.4 18.5–19.9 20.0–22.4 22.5–24.9 25.0–27.4 27.5–29.9 30.0–34.9 35.0–39.9 $40.0
MEN
Age,60 years
No. of deaths 46 91 1,001 3,093 4,376 2,506 1,760 305 41
Age-stand. ratea 1313 1070 1044 1073 1222 1535 2005 2907 4270
Multivariate RRb 1.21 1.00 0.99 1.00 1.13 1.39 1.84 2.63 3.97
95% CI (0.90–1.61) (0.81––1.23) (0.92–1.06) - (1.08–1.18) (1.32–1.46) (1.73–1.95) (2.33–2.96) (2.91–5.41)
Stand. rate difference 240 23 229 0 149 462 932 1834 3198
Age 60–69 years
No. of deaths 75 169 1,536 4,454 5,587 2,568 1,345 142 19
Age-stand. ratea 2400 2083 1778 1780 1928 2278 2471 3178 4753
Multivariate RRb 1.51 1.17 0.99 1.00 1.08 1.29 1.40 1.82 3.15
95% CI (1.20–1.89) (1.01–1.37) (0.94–1.05) - (1.04–1.12) (1.23–1.36) (1.32–1.49) (1.54–2.16) (2.01–4.95)
Stand. rate difference 619 302 23 0 148 498 691 1398 2972
15.0–18.4 18.5–19.9 20.0–22.4 22.5–24.9 25.0–27.4 27.5–29.9 30.0–34.9 $35.0
Age$70 years
No. of deaths 74 196 1,227 2,821 2,668 988 441 40
Age-stand. ratea 2751 2295 2349 2275 2302 2400 2334 2485
Multivariate RRb 1.01 1.01 1.03 1.00 1.00 1.08 1.06 1.15
95% CI (0.80–1.28) (0.87–1.17) (0.96–1.10) - (0.94–1.05) (1.01–1.16) (0.95–1.17) (0.84–1.57)
Stand. rate difference 475 19 73 0 26 124 58 209
BMI
15.0–18.4 18.5–19.9 20.0–22.4 22.5–24.9 25.0–27.4 27.5–29.9 30.0–34.9 35.0–39.9 $40.0
WOMEN
Age,60 years
No. of deaths 372 1,307 5,214 5,704 4,658 2,544 2,949 897 346
Age-stand. ratea 966 768 740 802 978 1138 1378 1893 2556
Multivariate RRb 1.18 0.96 0.93 1.00 1.19 1.37 1.66 2.28 3.31
95% CI (1.06–1.31) (0.91–1.02) (0.89–0.96) - (1.14–1.24) (1.31–1.44) (1.59–1.74) (2.12–2.44) (2.97–3.69)
Stand. rate difference 164 234 263 0 175 336 576 1091 1754
Age 60–69 years
No. of deaths 571 1,681 6,931 9,001 7,665 3,934 3,699 708 204
Age-stand. ratea 1571 1416 1297 1353 1479 1659 1850 2090 2455
Multivariate RRb 1.16 1.08 0.97 1.00 1.08 1.23 1.37 1.59 1.94
Body
Mass
Index
and
Mortality
in
White
and
Black
US
Adults
ONE
|
www.ploson
e.org
9
October
2014
|
Volume
9
|
Issue
10
|
for Black women (95% CI 1.43–2.21). However, there was no evidence of statistical interaction by race (interaction p = 0.23 for women and p = 0.20 for men).
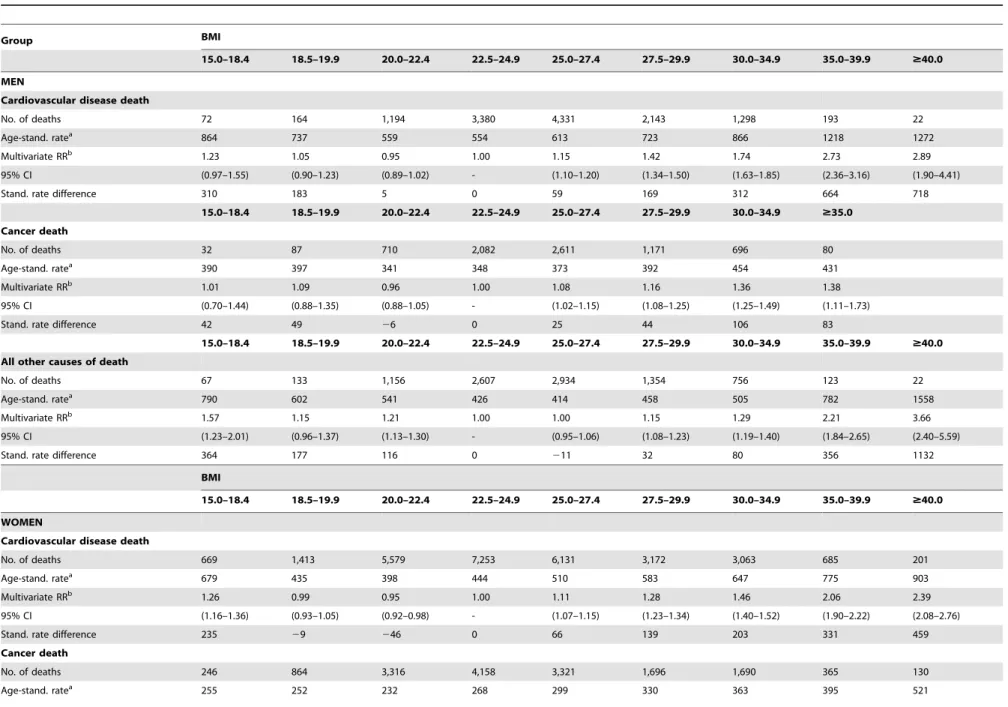
Due to the lack of effect modification by race and the profound modifying effect of smoking and prevalent disease on the association between BMI and mortality, analyses stratified by age and grouped cause of death are presented among never smokers without prevalent disease in both races combined. The magnitude of the association between BMI and total mortality varied substantially by the age at which BMI was reported (Table 4). BMI at ages younger than 70 years was much more strongly associated with risk of death in both men and women than was BMI at older ages. For BMI at ages less than 60 years and 60– 69 years, all categories of overweight and obesity were associated with higher risk of mortality. The association between BMI and mortality was greatly attenuated when BMI was reported at age 70 and above; however, in women, associations remained statistically significant for all categories of BMI.27.4 kg/m2. Overweight and obesity were associated with all grouped causes of death, but were generally stronger for death from cardiovascular disease and other causes compared to cancer for both men and women (Table 5).
Discussion
In this large prospective study of approximately one million Black and White men and women, we were able to address four major unresolved issues in the study of BMI and mortality. Results showed that men and women who were underweight were at higher risk of mortality as were men and women who were overweight and obese compared to normal weight men and women, and that smoking and prevalent disease significantly modified the association between BMI and mortality, such that the strongest associations were among never smokers without preva-lent disease for men and women. In healthy never smokers, mortality rates were lowest within the upper end of the normal BMI category (i.e., 22.5–24.9 kg/m2) for all race sex groups. Although the results of our study showed no statistically significant differences in associations between BMI and mortality by race, overweight and obesity were associated with subsequent mortality among smokers and/or those with prevalent disease in White men, White women and Black women but not in in Black men. In addition, weight in late middle age but not older (i.e., 70 years or older) was strongly associated with future mortality.
There is growing evidence that residual confounding by smoking and/or reverse causality by prevalent disease attenuated the association between BMI and risk of mortality. Indeed, studies that included smokers (who tend to have a lower BMI) and individuals with diseases that cause weight loss generally show weaker associations with high BMI levels, and stronger associa-tions with low BMI levels than do studies that exclude these subjects [4,8,25–28]. While controlling for smoking history can reduce its confounding effects, eliminating the residual effects of current smoking is essential for clarifying associations of BMI with mortality, and can only be achieved through exclusion of current smokers. On the other hand, prevalent disease exclusions may be more dependent on the characteristics and age of the study population. Consistent with the largest pooled analysis to date [3], in our study underweight and the lower end of the normal weight range were associated with higher risk of mortality among those who smoked or had prevalent disease.
Numerous studies have reported on the association between BMI and mortality in Caucasians [2–4,8,9,18–21,25–47]. In contrast, few studies have reported on the BMI-mortality relationship among Black men and women [4,7–17], and among
Table 4. Cont. BMI 15.0–18.4 18.5–19.9 20.0–22.4 22.5–24.9 25.0–27.4 27.5–29.9 30.0–34.9 35.0–39.9 $ 40.0 95% C I (1.07–1.27) (1.03–1.14) (0.94–1.00) -(1.05–1.12) (1.18–1.27) (1.32–1.43) (1.47–1.71) (1.69–2.23) Stand. rate difference 218 63 2 56 0 1 25 306 497 737 1102 Age $ 70 years No. of deaths 795 1,605 5,905 7,409 5,692 2,514 2,143 334 79 Age-stand. rate a 2404 2050 1937 1895 1946 2038 2129 2348 2 563 Multivariate RR b 1.24 1.07 1.02 1.00 1.02 1.07 1.13 1.33 1.29 95% C I (1.15–1.33) (1.02–1.13) (0.98–1.05) -(0.99–1.06) (1.02–1.12) (1.08–1.19) (1.19–1.49) (1.03–1.61) Stand. rate difference 509 155 43 0 51 143 234 453 668 aRate per 1 00,000 standardized to the age-distribution o f the CPS-II men/women. bCox proportional h azards model, adjusted for age, race, education, physical activity, alcohol use, marital status, aspirin use, fat consumption, vegetable consumption, and postmenopausal estrogen use (women) doi:10.1371/journal.pone. 0109153.t004
Body Mass Index and Mortality in White and Black US Adults
Table 5.Relative risk of death from cardiovascular, cancer, or other causes according to BMI among men and women who are never smokers without prevalent disease, CPS-II 1982–2010.
Group BMI
15.0–18.4 18.5–19.9 20.0–22.4 22.5–24.9 25.0–27.4 27.5–29.9 30.0–34.9 35.0–39.9 $40.0
MEN
Cardiovascular disease death
No. of deaths 72 164 1,194 3,380 4,331 2,143 1,298 193 22
Age-stand. ratea 864 737 559 554 613 723 866 1218 1272
Multivariate RRb 1.23 1.05 0.95 1.00 1.15 1.42 1.74 2.73 2.89
95% CI (0.97–1.55) (0.90–1.23) (0.89–1.02) - (1.10–1.20) (1.34–1.50) (1.63–1.85) (2.36–3.16) (1.90–4.41)
Stand. rate difference 310 183 5 0 59 169 312 664 718
15.0–18.4 18.5–19.9 20.0–22.4 22.5–24.9 25.0–27.4 27.5–29.9 30.0–34.9 $35.0
Cancer death
No. of deaths 32 87 710 2,082 2,611 1,171 696 80
Age-stand. ratea 390 397 341 348 373 392 454 431
Multivariate RRb 1.01 1.09 0.96 1.00 1.08 1.16 1.36 1.38
95% CI (0.70–1.44) (0.88–1.35) (0.88–1.05) - (1.02–1.15) (1.08–1.25) (1.25–1.49) (1.11–1.73)
Stand. rate difference 42 49 26 0 25 44 106 83
15.0–18.4 18.5–19.9 20.0–22.4 22.5–24.9 25.0–27.4 27.5–29.9 30.0–34.9 35.0–39.9 $40.0
All other causes of death
No. of deaths 67 133 1,156 2,607 2,934 1,354 756 123 22
Age-stand. ratea 790 602 541 426 414 458 505 782 1558
Multivariate RRb 1.57 1.15 1.21 1.00 1.00 1.15 1.29 2.21 3.66
95% CI (1.23–2.01) (0.96–1.37) (1.13–1.30) - (0.95–1.06) (1.08–1.23) (1.19–1.40) (1.84–2.65) (2.40–5.59)
Stand. rate difference 364 177 116 0 211 32 80 356 1132
BMI
15.0–18.4 18.5–19.9 20.0–22.4 22.5–24.9 25.0–27.4 27.5–29.9 30.0–34.9 35.0–39.9 $40.0
WOMEN
Cardiovascular disease death
No. of deaths 669 1,413 5,579 7,253 6,131 3,172 3,063 685 201
Age-stand. ratea 679 435 398 444 510 583 647 775 903
Multivariate RRb 1.26 0.99 0.95 1.00 1.11 1.28 1.46 2.06 2.39
95% CI (1.16–1.36) (0.93–1.05) (0.92–0.98) - (1.07–1.15) (1.23–1.34) (1.40–1.52) (1.90–2.22) (2.08–2.76)
Stand. rate difference 235 29 246 0 66 139 203 331 459
Cancer death
No. of deaths 246 864 3,316 4,158 3,321 1,696 1,690 365 130
Age-stand. ratea 255 252 232 268 299 330 363 395 521
Body
Mass
Index
and
Mortality
in
White
and
Black
US
Adults
ONE
|
www.ploson
e.org
11
October
2014
|
Volume
9
|
Issue
10
|
those studies, results are inconsistent with most studies showing a stronger association in Whites than in Blacks [8,10,12–17]. In fact, only two previous studies examined the BMI-mortality association in African American among healthy never-smokers. The first study included only women [11] and found that BMI-mortality associations were similar in magnitude as those reported in other studies among Whites; however, they were unable to directly compare results between Whites and Blacks as the study population included only Black women. The second was the earlier CPS-II analysis which included both men and women and was based on 14-years of follow-up [4]. Prior to the present analysis, that was the largest study to date among African Americans, and included a total of 485 deaths in Black men and 1,188 deaths in Black women. In that analysis, there was an excess risk of mortality with higher BMI in all race-sex groups, but the association between BMI and mortality appeared to be weaker in African Americans that in Whites. However, there were many fewer deaths identified among obese Black men and women (83 and 319 deaths, respectively) in the 14 year follow-up than in this study (247 and 1,002 deaths, respectively). In the current analysis, while Blacks had higher absolute mortality rates, the relative risks associated with BMI did not differ by race for men or women. The increased statistical power and precision is likely to have resulted in more stable estimates in the current compared to earlier analysis. In addition, the longer follow-up time would likely reduce confounding by undiagnosed disease-related weight loss.
The present study showed that the BMI-mortality association is stronger when BMI is assessed at younger ages (i.e.,70 years old in this study) in both men and women. Disease-related weight loss is less common at younger ages and BMI is a better measure of excess adiposity in young and middle-aged adults [48] than in the elderly [49]. This finding is consistent with many other reports in Whites [4,8,9,18–21], but the variation in the BMI-mortality relationship by age had not been examined in Blacks.
The major strengths of this study are its large sample size, wide BMI range and long follow-up time. In addition, the large number of Black men and women in CPS-II allowed for the largest detailed analysis of the BMI-mortality relationship in Blacks to date. The main limitation of the study is the reliance on a single self-report of height and weight. When compared with measured height and weight, self-reported data systematically overestimate height in men and underestimate weight in women [50], although the magnitude of this error is small. A longitudinal study using national data collected over 20 years (1971–1992) showed that Black men aged 48–60 years had a higher average weight gain per year compared to White men (0.14 and 0.02 kg/year, respectively) [51]. In contrast, for women, especially Black women, weight gain tended to occur earlier in adulthood; thus, the single measure may more accurately reflect long-term weight in women and White men compared to Black men. In addition, it is also possible that exclusions for prevalent disease (cancer, heart disease, stroke, emphysema, chronic bronchitis or asthma) were not adequate to control for all disease-related weight loss.
In summary, this large nationwide study helps to clarify four major unresolved issues in the study of BMI and mortality by demonstrating that smoking and prevalent disease significantly modify the relationship between BMI and mortality, and that among never smokers without prevalent disease, overweight and obesity are strongly associated with subsequent risk of mortality and the optimal BMI range is 20.0–24.9 kg/m2. Additionally, this study demonstrated that among never smokers without prevalent disease, the BMI-mortality relationship is similar in Black and White men and women where overweight (BMI 25.0–29.9 kg/m2) is associated with a modest and obesity (BMI 30.0+kg/m2) a more
Table 5. Cont. BMI 15.0–18.4 18.5–19.9 20.0–22.4 22.5–24.9 25.0–27.4 27.5–29.9 30.0–34.9 35.0–39.9 $ 40.0 Multivariate RR b 0.93 0.97 0.90 1.00 1.08 1.20 1.33 1.48 1.97 95% C I (0.82–1.06) (0.90–1.05) (0.86–0.94) -(1.04–1.14) (1.13–1.27) (1.25–1.41) (1.33–1.65) (1.65–2.34) Stand. rate difference 2 13 2 16 2 36 0 3 1 6 2 9 5 127 253 All other causes of death No. of deaths 5 20 1,247 4,621 5,459 4,312 2,096 2,037 450 160 Age-stand. rate a 533 379 329 3 36 361 389 431 507 686 Multivariate RR b 1.42 1.16 1.03 1.00 1.04 1.13 1.28 1.69 2.41 95% C I (1.30–1.56) (1.09–1.23) (0.99–1.07) -(1.00–1.09) (1.07–1.19) (1.22–1.35) (1.53–1.86) (2.06–2.82) Stand. rate difference 197 4 3 2 8 0 25 52 95 171 350 aRate per 1 00,000 standardized to the age-distribution o f the CPS-II men/women. bCox proportional h azards model, adjusted for age, race, education, physical activity, alcohol use, marital status, aspirin use, fat consumption, vegetable consumption, and postmenopausal estrogen use (women). doi:10.1371/journal.pone. 0109153.t005
Body Mass Index and Mortality in White and Black US Adults
substantial increased risk of premature death. In the U.S., age-adjusted prevalence estimates of obesity are highest for African Americans (35.7%), followed by Hispanics (28.7%), and non-Hispanic Whites (23.7%) [52]. Given the high prevalence of obesity among all racial-ethnic populations, although dispropor-tionately higher among African Americans, these findings are of considerable clinical and public health relevance.
Acknowledgments
We dedicate this manuscript in memory of Dr. Eugenia ‘‘Jeanne’’ Calle, an outstanding scientist and leader at the American Cancer Society whose
work made seminal contributions in the public health understanding of the effects of obesity and mortality in the U.S.
Author Contributions
Conceived and designed the experiments: AVP JSH SMG. Performed the experiments: JSH AVP. Analyzed the data: JSH AVP. Contributed reagents/materials/analysis tools: JSH. Wrote the paper: AVP JSH SMG. Critical review: AVP JSH SMG.
References
1. Calle E, Rodriguez C, Walker-Thurmond K, Thun MJ (2003) Overweight, obesity, and mortality from cancer in a prospectively studied cohort of U.S. adults. N Engl J Med 348: 1625–1638.
2. Whitlock G, Lewington S, Sherliker P, Clarke R, Emberson J, et al. (2009) Body-mass index and cause-specific mortality in 900 000 adults: collaborative analyses of 57 prospective studies. Lancet 373: 1083–1096.
3. Berrington de Gonzalez A, Hartge P, Cerhan JR, Flint AJ, Hannan L, et al. (2010) Body-mass index and mortality among 1.46 million White adults. New England Journal of Medicine 363: 2211–2219.
4. Calle EE, Thun MJ, Petrelli JM, Rodriguez C, Heath CW, Jr. (1999) Body-mass index and mortality in a prospective cohort of U.S. adults. N Engl J Med 341: 1097–1105.
5. Flegal KM, Kit BK, Orpana H, Graubard BI (2013) Association of all-cause mortality with overweight and obesity using standard body mass index categories: a systematic review and meta-analysis. JAMA 309: 71–82. 6. Zheng W, McLerran DF, Rolland B, Zhang X, Inoue M, et al. (2011)
Association between Body-Mass Index and Risk of Death in More Than 1 Million Asians. New England Journal of Medicine 364: 719–729.
7. Stevens J (2000) Obesity and mortality in African-Americans. Nutrition Reviews 58: 346–358.
8. Adams KF, Schatzkin A, Harris TB, Kipnis V, Mouw T, et al. (2006) Overweight, obesity, and mortality in a large prospective cohort of persons 50 to 71 years old. N Engl J Med 355: 763–778.
9. McTigue K, Larson JC, Valoski A, Burke G, Kotchen J, et al. (2006) Mortality and cardiac and vascular outcomes in extremely obese women. JAMA 296: 79– 86.
10. Reis JP, Araneta MR, Wingard DL, Macera CA, Lindsay SP, et al. (2009) Overall obesity and abdominal adiposity as predictors of mortality in u.s. White and black adults. Ann Epidemiol 19: 134–142.
11. Boggs DA, Rosenberg L, Cozier YC, Wise LA, Coogan PF, et al. (2011) General and abdominal obesity and risk of death among Black women. New England Journal of Medicine 365: 901–908.
12. Stevens J, Keil J, Rust P, Tyroler H, Davis C, et al. (1992) Body mass index and body girths as predictors of mortality in black and white women. Arch Intern Med 152: 1257–1262.
13. Cornoni-Huntley JC, Harris TB, Everett DF, Albanes D, Micozzi MS, et al. (1991) An overview of body weight of older persons, including the impact on mortality. J Clin Epidemiol 44: 743–753.
14. Freedman D, WIlliamson D, Croft J, Byers T (1995) Relation of body fat distribution to ischemic heart disease. The National Health and Nutrition Examination Survey I Epidemiologic Follow-up Study. Am J Epidemiol 142: 53–63.
15. Johnson H, Heineman E, Heiss GHC, Tyroler H (1986) Cardiovascular disease risk factors and mortality among black women and white women aged 40–69 years in Evans County, Georgia. Am J Epidemiol 123: 209–220.
16. Stevens J, Plankey MW, Williamson DF, Thun MJ, Rust PF, et al. (1998) The body mass index-mortality relationship in white and African American women. Obesity 6: 268–277.
17. Wienpahl J, Ragland DR, Sidney S (1990) Body mass index and 15-year mortality in a cohort of black men and women. J Clin Epidemiol 43: 949–960. 18. Stevens J, Cai J, Pamuk ER, Williamson DF, Thun MJ, et al. (1998) The effect of age on the association between body-mass index and mortality. N Engl J Med 338: 1–7.
19. Baik I, Ascherio A, Rimm EB, Giovannucci E, Spiegelman D, et al. (2000) Adiposity and mortality in men. Am J Epidemiol 152: 264–271.
20. Pischon T, Boeing H, Hoffmann K, Bergmann M, Schulze MB, et al. (2008) General and abdominal adiposity and risk of death in Europe. N Engl J Med 359: 2105–2120.
21. Folsom AR, Kushi LH, Anderson KE, Mink PJ, Olson JE, et al. (2000) Associations of general and abdominal obesity with multiple health outcomes in older women: the Iowa Women’s Health Study. Arch Intern Med 160: 2117– 2128.
22. Garfinkel L (1985) Selection, follow-up, and analysis in the American Cancer Society prospective studies. National Cancer Institute monograph 67. Wash-ington D.C.: Government Printing Office. pp. 49–52.
23. (1986) Bulliten of the World Health Organization 64: 929–941.
24. Calle EE, Terrell DD (1993) Utility of the National Death Index for ascertainment of mortality among cancer prevention study II participants. Am J Epidemiol 137: 235–241.
25. Freedman DM, Ron E, Ballard-Barbash R, Doody MM, Linet MS (2006) Body mass index and all-cause mortality in a nationwide US cohort. Int J Obes (Lond) 30: 822–829.
26. Gelber RP, Kurth T, Manson JE, Buring JE, Gaziano JM (2007) Body mass index and mortality in men: evaluating the shape of the association. Int J Obes (Lond) 31: 1240–1247.
27. Manson JE, Willett WC, Stampfer MJ, Colditz GA, Hunter DJ, et al. (1995) Body weight and mortality among women. N Engl J Med 333: 677–685. 28. Singh PN, Lindsted KD (1998) Body mass and 26-year risk of mortality from
specific diseases among women who never smoked. Epidemiology 9: 246–254. 29. Bianchini F, Kaaks R, Vainio H (2002) Overweight, obesity, and cancer risk.
Lancet Oncol 3: 565–574.
30. Koster A, Leitzmann MF, Schatzkin A, Adams KF, van Eijk JT, et al. (2008) The combined relations of adiposity and smoking on mortality. Am J Clin Nutr 88: 1206–1212.
31. Ajani UA, Lotufo PA, Gaziano JM, Lee IM, Spelsberg A, et al. (2004) Body mass index and mortality among US male physicians. Ann Epidemiol 14: 731–739. 32. Hjartaker A, Adami HO, Lund E, Weiderpass E (2005) Body mass index and
mortality in a prospectively studied cohort of Scandinavian women: the women’s lifestyle and health cohort study. Eur J Epidemiol 20: 747–754.
33. Jain MG, Miller AB, Rohan TE, Rehm JT, Bondy SJ, et al. (2005) Body mass index and mortality in women: follow-up of the Canadian National Breast Screening Study cohort. Int J Obes (Lond) 29: 792–797.
34. Pednekar MS, Hakama M, Hebert JR, Gupta PC (2008) Association of body mass index with all-cause and cause-specific mortality: findings from a prospective cohort study in Mumbai (Bombay), India. Int J Epidemiol 37: 524–535.
35. Kuriyama S (2006) Impact of overweight and obesity on medical care costs, all-cause mortality, and the risk of cancer in Japan. J Epidemiol 16: 139–144. 36. Song YM, Ha M, Sung J (2007) Body mass index and mortality in middle-aged
Korean women. Ann Epidemiol 17: 556–563.
37. Jee SH, Sull JW, Park J, Lee SY, Ohrr H, et al. (2006) Body-mass index and mortality in Korean men and women. N Engl J Med 355: 779–787. 38. Lawlor DA, Hart CL, Hole DJ, Davey Smith G (2006) Reverse causality and
confounding and the associations of overweight and obesity with mortality. Obesity (Silver Spring) 14: 2294–2304.
39. Katzmarzyk PT, Craig CL, Bouchard C (2001) Original article underweight, overweight and obesity: relationships with mortality in the 13-year follow-up of the Canada Fitness Survey. J Clin Epidemiol 54: 916–920.
40. Lahmann PH, Lissner L, Gullberg B, Berglund G (2002) A prospective study of adiposity and all-cause mortality: the Malmo Diet and Cancer Study. Obes Res 10: 361–369.
41. Peeters A, Barendregt JJ, Willekens F, Mackenbach JP, Al Mamun A, et al. (2003) Obesity in adulthood and its consequences for life expectancy: a life-table analysis. Ann Intern Med 138: 24–32.
42. Janssen I (2007) Morbidity and mortality risk associated with an overweight BMI in older men and women. Obesity (Silver Spring) 15: 1827–1840.
43. Corrada MM, Kawas CH, Mozaffar F, Paganini-Hill A (2006) Association of body mass index and weight change with all-cause mortality in the elderly. Am J Epidemiol 163: 938–949.
44. Ringback Weitoft G, Eliasson M, Rosen M (2008) Underweight, overweight and obesity as risk factors for mortality and hospitalization. Scand J Public Health 36: 169–176.
45. Kivimaki M, Ferrie JE, Batty GD, Davey Smith G, Elovainio M, et al. (2008) Optimal form of operationalizing BMI in relation to all-cause and cause-specific mortality: the original Whitehall study. Obesity (Silver Spring) 16: 1926–1932. 46. Flegal KM, Graubard BI, Williamson DF, Gail MH (2005) Excess deaths
associated with underweight, overweight, and obesity. JAMA 293: 1861–1867. 47. Flicker L, McCaul K, Hankey G, Jamrozik K, Brown W, et al. (2010) Body mass
index and survival in men and women aged 70 to 75. J Am Geriatr Soc 58: 234– 241.
48. Keys A, Fidanza F, Karvonen MJ, et al (1972) Indices of relative weight and obesity. J Chronic Dis 25: 329–343.
49. Borkan G, Hults D, Gerzof S, Robbins A, Silbert C (1983) Age changes in body composition revealed by computed tomography. J Gerontol 38: 673–677. 50. Stevens J, Keil JE, Waid R, Gazes PC (1990) Accuracy of current, 4-year, and
28-year self-reported body weight in an elderly population. Am J Epidemiol 132: 1156–1163.
51. Sheehan TJ, DuBrava S, DeChello LM, Fang Z (2003) Rates of weight change for black and white Americans over a twenty year period. Int J Obes 27: 498– 504.
52. (2009) MMWR 58: 740–744.
Body Mass Index and Mortality in White and Black US Adults