HESSD
10, 699–728, 2013Monitoring wetlands with field pH and EC
P. J. Gerla
Title Page
Abstract Introduction
Conclusions References
Tables Figures
◭ ◮
◭ ◮
Back Close
Full Screen / Esc
Printer-friendly Version Interactive Discussion
Discussion
P
a
per
|
Dis
cussion
P
a
per
|
Discussion
P
a
per
|
Discussio
n
P
a
per
|
Hydrol. Earth Syst. Sci. Discuss., 10, 699–728, 2013 www.hydrol-earth-syst-sci-discuss.net/10/699/2013/ doi:10.5194/hessd-10-699-2013
© Author(s) 2013. CC Attribution 3.0 License.
Hydrology and Earth System Sciences Discussions
This discussion paper is/has been under review for the journal Hydrology and Earth System Sciences (HESS). Please refer to the corresponding final paper in HESS if available.
Can pH and electrical conductivity
monitoring reveal spatial and temporal
patterns in wetland geochemical
processes?
P. J. Gerla
The Nature Conservancy – Minnesota, North Dakota, and South Dakota Chapter, 81 Cornell Street Stop 8358, Grand Forks, North Dakota 58202-8358, USA
Department of Geology and Geological Engineering, University of North Dakota, 81 Cornell Street Stop 8358, Grand Forks, North Dakota 58202-8358, USA
Received: 2 January 2013 – Accepted: 3 January 2013 – Published: 16 January 2013
Correspondence to: P. J. Gerla ([email protected])
HESSD
10, 699–728, 2013Monitoring wetlands with field pH and EC
P. J. Gerla
Title Page
Abstract Introduction
Conclusions References
Tables Figures
◭ ◮
◭ ◮
Back Close
Full Screen / Esc
Printer-friendly Version Interactive Discussion
Discussion
P
a
per
|
Dis
cussion
P
a
per
|
Discussion
P
a
per
|
Discussio
n
P
a
per
|
Abstract
Carbonate reactions and equilibria play a dominant role in the biogeochemical function of many wetlands. The US Geological Survey PHREEQC computer code was used to model geochemical reactions that may be typical for wetlands with water budgets char-acterized by: (a) input dominated by direct precipitation, (b) interaction with
ground-5
water, (c) variable degrees of reaction with organic carbon, and (d) different rates of evapotranspiration. Rainfall with a typical composition was progressively reacted with calcite and organic carbon at various rates and proportions using PHREEQC. Contrast-ing patterns of the results suggest that basic water quality data collected in the field can reveal differences in the geochemical processes in wetlands. Given a temporal record,
10
these can signal subtle changes in surrounding land cover and use. To demonstrate this, temperature, pH, and electrical conductivity (EC) were monitored for three years in five large wetlands comprising 48 sample sites in northwest Minnesota. EC and pH of samples ranged greatly – from 23 to 1300 µS cm−1 and 5.5 to 9. The largest range
in pH was observed in small beach ridge wetlands, where two clusters are apparent:
15
(1) low EC and a wide range of pH and (2) higher pH and EC. Large marshes within a glacial lake – till plain have a broad range of pH and EC, but depend on the specific wetland. Outlying data typically occurred in altered or disturbed areas. The inter-annual and intra-wetland consistency of the results suggests that each wetland system hosts characteristic geochemical conditions.
20
1 Introduction
Wetland management often focuses on maintaining diverse natural vegetation and pro-viding wildlife habitat, both of which are strongly influenced by water quality and chem-istry (Houlahan and Findlay, 2003; McCormick et al., 2009). Successful management of wetlands, however, can be challenged by climate variability and changes in local
25
HESSD
10, 699–728, 2013Monitoring wetlands with field pH and EC
P. J. Gerla
Title Page
Abstract Introduction
Conclusions References
Tables Figures
◭ ◮
◭ ◮
Back Close
Full Screen / Esc
Printer-friendly Version Interactive Discussion
Discussion
P
a
per
|
Dis
cussion
P
a
per
|
Discussion
P
a
per
|
Discussio
n
P
a
per
|
function. For example, climate variability leading to long-term changes in temperature and precipitation generally produces irreversible alteration in water budget or changes in biogeochemical processes (Burkett and Kusler, 2000; Erwin, 2009). Urbanization and expanding land use for agriculture practice can increase the transport of sediment, nutrients, and pesticides into wetlands (e.g., Davis and Froend, 1999; Gleason et al.,
5
2003). Although these alterations can be manifest in many ways, perhaps the earliest and most evident changes occur in the wetland’s water balance and water composition. Carbonate reactions, controlled by the interaction of atmospheric, biologic, and soil/substrate processes in the presence of wetland waters, commonly buffers pH and moderates dissolved mineral concentration, thus creating the foundation on which
wet-10
land biogeochemical processes proceed (e.g., Almendinger and Leete, 1998; Groot-jans et al., 2006). The spatial extent and zonation of these reactions can vary in scale from a single wetland (Almendinger and Leete, 1998) to sub-continental (Gorham et al., 1983).
In a carbonate-dominated geochemical system, the following processes exert
signif-15
icant control on water composition:
a. dilution of evolved wetland and substrate water by meteoric water,
b. reaction of calcite (CaCO3) and other carbonate minerals with either evolved or meteoric water,
c. loss of oxygen and chemical reduction by reaction with organic matter,
20
d. buffering of the wetland water and saturated substrate by CO2 gas that is gener-ated through biological activity and the oxidation of organic matter,
e. loss of water through evapotranspiration.
Therefore, in many wetlands, and especially calcareous wetlands characterized by carbonate-rich substrate and Ca-Mg-HCO3-type waters (Hem, 1985), geochemical
25
HESSD
10, 699–728, 2013Monitoring wetlands with field pH and EC
P. J. Gerla
Title Page
Abstract Introduction
Conclusions References
Tables Figures
◭ ◮
◭ ◮
Back Close
Full Screen / Esc
Printer-friendly Version Interactive Discussion
Discussion
P
a
per
|
Dis
cussion
P
a
per
|
Discussion
P
a
per
|
Discussio
n
P
a
per
|
the buffering capacity and the potential for the wetland to be affected by external factors such as climate variation and changes in nearby land cover. Furthermore, numerical models can provide a framework and convenient means to both characterize wetland water budgets and predict changes in hydrological regime ( ˇSim ˚unek et al., 2008) and biogeochemical processes (Frei et al., 2012), but have been applied rarely in wetland
5
research.
This report demonstrates how basic, easily obtained field measurements can be combined with numerical geochemical modeling to reveal hydrological processes oc-curring at local and landscape scale. Three years of routine field measurements at 48 wetland sites in the Tallgrass Aspen Parkland ecoregion of northwest Minnesota
10
show how this monitoring and modeling framework can be applied and implemented in practice. Periodic measurement of pH, electrical conductivity (EC), temperature, and estimate of ORP at established monitoring points in wetlands are shown to define the controlling geochemical processes and the potential for alteration of these processes by changes in land use and wetland management. In many instances, low-cost
water-15
quality measurements can help determine how land use and wetland management affect biogeochemical processes.
2 Methods
2.1 Description of the study site
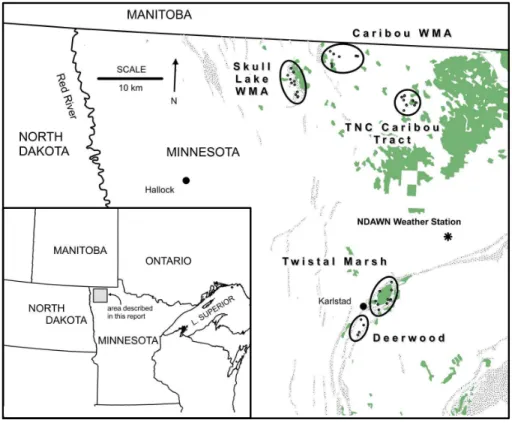
To demonstrate these principles, wetlands spanning an area extending 60 km
north-20
south by 30 km east-west and lying within the core of the Tallgrass Aspen Parkland (TAP) ecoregion of northwest Minnesota (Fig. 1) were monitored. The parkland is char-acterized by a humid continental climate, low relief (a few 10 s of meters), and a mosaic of habitat types, including tallgrass prairie, aspen woodland, sedge meadow wetlands, riparian woodland, and oak savanna (Winckler, 2004). In this 1800 km2 region,
wet-25
HESSD
10, 699–728, 2013Monitoring wetlands with field pH and EC
P. J. Gerla
Title Page
Abstract Introduction
Conclusions References
Tables Figures
◭ ◮
◭ ◮
Back Close
Full Screen / Esc
Printer-friendly Version Interactive Discussion
Discussion
P
a
per
|
Dis
cussion
P
a
per
|
Discussion
P
a
per
|
Discussio
n
P
a
per
|
sandy beach ridges of glacial Lake Agassiz and large wetlands developed on glacial-lake beds and wave-washed till plains (Fig. 2). The mineral soil substrate for these wetland basins consists of Wisconsinan-age Red Lake Falls Till (Harris et al., 1974). This pebble-loam diamicton contains about 20 % clay, 40 % silt, and 40 % sand and larger-sized clasts. Calcareous material comprises about 32 % of the fine-grained
(mi-5
nus 200 mesh) fraction. Limestone and dolomite make up approximately 66 % of sand and larger-sized particles. The remainder of the till is composed of siliceous fragments and matrix, along with a few percent shale (Harris et al., 1974).
The small pothole wetlands vary from less than 0.1 hectare to several tens of hectares (Fig. 2). Their connection to groundwater is often very good; the potholes
cre-10
ate “windows” to groundwater and have a large range of geochemical characteristics depending on their position within the beach-dune landscape, with some on groundwa-ter divides, others at flow-through locations, and a few at discharge sites (e.g. Wingroundwa-ter, 1998). In contrast, the much larger glacial lake-bed wetlands (>1000 ha) generally overlie a meter or less of peat with a few cm of carbonate-rich gravel at the base, which
15
is underlain by clay till with low permeability. These wetlands, except near their margins, rely on precipitation as their source of water. Seasonal evapotranspiration constitutes the main loss of water.
2.2 Sampling and analysis
Water-quality measurements were collected in the field at least five times per year over
20
the course of three years at 48 wetland sites, comprising five broad wetland areas (Fig. 1): (1) Skull Lake Wildlife Management Area (WMA), (2) Caribou WMA, (3) TNC Caribou Township Tract, (4) Twistal Marsh, and (5) Deerwood Marsh. Glacial beach ridge deposits are best developed in Skull Lake and Caribou WMAs, whereas the latter three areas are characterized by lake-plain sediments of glacial Lake Agassiz. Except
25
HESSD
10, 699–728, 2013Monitoring wetlands with field pH and EC
P. J. Gerla
Title Page
Abstract Introduction
Conclusions References
Tables Figures
◭ ◮
◭ ◮
Back Close
Full Screen / Esc
Printer-friendly Version Interactive Discussion
Discussion
P
a
per
|
Dis
cussion
P
a
per
|
Discussion
P
a
per
|
Discussio
n
P
a
per
|
Sites were sampled for pH, EC, and temperature using an Extech EC500 portable combination meter and oxidation-reduction potential with an Extech RE300 ORP me-ter, which were calibrated daily. Measurements were made directly in saturated soils (Faulkner et al., 1989) or much more often in undisturbed water, consistently close to the sediment- water interface during the ice-free seasons of 2005–2007. At each
5
location and for each visit, measurements were made at least five times to test re-producibility and provide for statistical evaluation of variability at each site. EC was corrected for differences in temperature.
Precipitation and weather data were obtained from the North Dakota Agricultural Weather Network, which includes a station 12 km west of Greenbush, Minnesota. It lies
10
near the south-central portion of the area described in this report (Fig. 1) and provides seasonal trends of precipitation and Penman evapotranspiration (Penman, 1948).
2.3 Laboratory analysis
In October 2008, water samples from sites revealing some of the greatest contrast in field parameters were collected and transported on ice to the University of North
15
Dakota’s Environmental Analytical Research Laboratory, where the samples were an-alyzed for major ions, phosphorus, nitrate, ammonium, and carbon (organic, inorganic, and total). While in the field, water sampled for the analysis of major ions was passed through a 0.45 µm filter and acidified for cation analysis. Samples for carbon analy-sis were similarly filtered and filled without head-space in brown glass bottles. Cations
20
were analyzed by flame atomic absorption spectrometry and anions by ion chromatog-raphy. Organic, inorganic, and total organic carbon were determined using an auto-mated carbon analyzer.
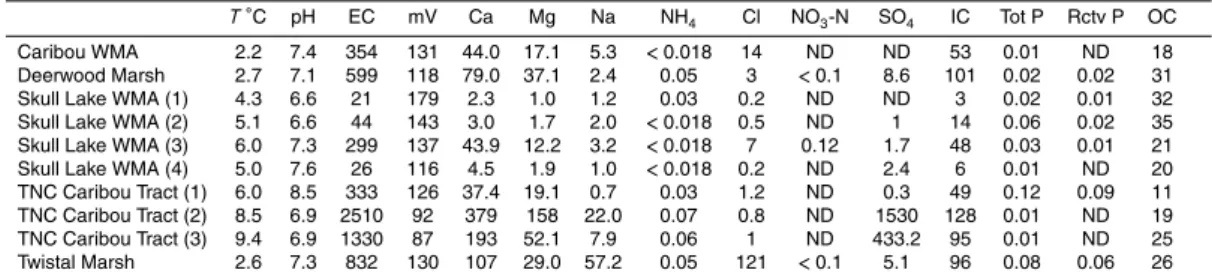
These more complete chemical analyses of ten samples (Table 1), selected to rep-resent the variability across the study area, shows that all the waters are of
Ca-Mg-25
HESSD
10, 699–728, 2013Monitoring wetlands with field pH and EC
P. J. Gerla
Title Page
Abstract Introduction
Conclusions References
Tables Figures
◭ ◮
◭ ◮
Back Close
Full Screen / Esc
Printer-friendly Version Interactive Discussion
Discussion
P
a
per
|
Dis
cussion
P
a
per
|
Discussion
P
a
per
|
Discussio
n
P
a
per
|
result is consistent with their moderate pH and relatively low dissolved solid concentra-tion.
2.4 Modeling
To characterize the relative importance and control of wetland water composition by landscape-related processes, numerical modeling was used to investigate the
influ-5
ence of the carbonate-system geochemical processes. Models were developed to ex-plain more fully not only the process, but also to quantify the hydrogeochemical reac-tions occurring in the wetland waters. For this purpose, the US Geological Survey’s PHREEQC version 2 code was used to model reaction of rainwater with organic car-bon, carbonate, and CO2gas, and account for variable degrees of evapotranspiration
10
(Parkhurst and Appelo, 1999). PHREEQC is a public-domain computer program, writ-ten in the C programming language, which performs a wide range of low-temperature aqueous geochemical calculations. PHREEQC is based on an ion-association aque-ous model and has capabilities for both speciation and batch-reaction calculations in-volving both reversible and irreversible reactions, including aqueous, mineral, and gas
15
reactions, which are the program’s options used in the analysis of this report.
Hydrogeochemical modeling was used track the progression of basic geochemical processes in the wetlands, assuming:
a. rainwater composition is the starting solution,
b. organic carbon/oxidation-reduction and carbonate system reactions dominate the
20
processes responsible for the composition and chemical properties of the wetland waters,
c. other ions and reaction processes (such as ionic exchange) exert a minor effect on water composition, and
d. the relationship between ionic strength and dissolved solid concentration can be
25
HESSD
10, 699–728, 2013Monitoring wetlands with field pH and EC
P. J. Gerla
Title Page
Abstract Introduction
Conclusions References
Tables Figures
◭ ◮
◭ ◮
Back Close
Full Screen / Esc
Printer-friendly Version Interactive Discussion
Discussion
P
a
per
|
Dis
cussion
P
a
per
|
Discussion
P
a
per
|
Discussio
n
P
a
per
|
Reaction progress can be then traced by including sufficient reaction steps, with com-plicating factors such as reaction with humic acids, silicate minerals, and clay cation exchange not included.
3 Results
3.1 Field observations 5
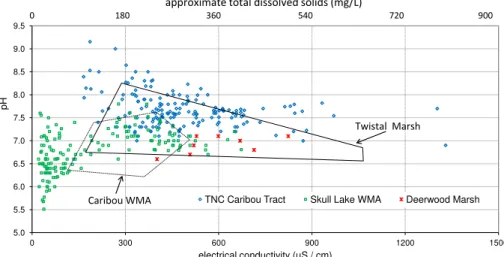
Soon after field data began to be collected, consistency in the relationship between pH and EC was observed for groups of wetlands that shared either a spatial or phys-iographic relationship (Fig. 4). The sample standard deviation for replicated field mea-surements each time a site was sampled (Fig. 5) showed some scatter, but a small pooled standard deviation (IUPAC, 1997) suggests good reproducibility using this field
10
measurement technique. It further indicates that variation would not affect significantly the observed pH-EC trends. Pooled standard deviation for pH, EC, and temperature was 0.11, 19.4, and 0.46, respectively (n=498). For individual measurements, there
was no correlation between pH and standard deviation and only a slight positive corre-lation between EC and standard deviation (Fig. 5).
15
The large range and distinctive patterns of pH and EC revealed by the field analy-ses suggest that hydrogeochemistry is related to procesanaly-ses affecting the water budget, including: (a) degree of meteoric–groundwater interaction, (b) extent of evapotranspi-ration, (c) reaction of wetland waters with organic carbon near the water–soil interface, and (d) reaction of wetland waters with carbonate minerals in the underlying substrate.
20
3.2 Hydrological regime – surface water and groundwater interaction
In the context of the glacial Lake Agassiz beach ridges in the Tallgrass Aspen Parkland, wetlands interact with groundwater and surface water in various patterns and with dif-ferent magnitudes. A map of wetlands at the northern end of the Skull Lake WMA (US Fish and Wildlife Service National Wetlands Inventory, 2012) shows the typical spatial
HESSD
10, 699–728, 2013Monitoring wetlands with field pH and EC
P. J. Gerla
Title Page
Abstract Introduction
Conclusions References
Tables Figures
◭ ◮
◭ ◮
Back Close
Full Screen / Esc
Printer-friendly Version Interactive Discussion
Discussion
P
a
per
|
Dis
cussion
P
a
per
|
Discussion
P
a
per
|
Discussio
n
P
a
per
|
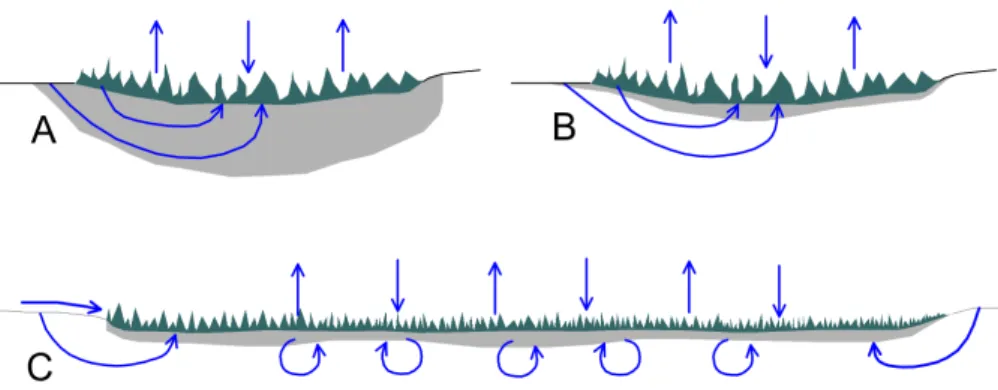
distribution and scale of wetland types in the ecoregion (Fig. 2). Contours and spot elevations on Fig. 2 are derived from bare ground LiDAR data (International Water Institute, 2012) in wetlands. During periods of normal precipitation and soil moisture, these wetlands are coincident with the surface-water or groundwater saturation eleva-tion, and reveal the pattern of the water table across the terrain. Schematically, Fig. 6a
5
shows a small, isolated beach-ridge wetland receiving groundwater flow from nearby recharge within underlying organic-rich substrate, in addition to a contribution from meteoric water. In Fig. 6b, the wetland interacts with groundwater in a similar way, but the substrate consists of predominantly mineral soil. Finally, the hydrological regime of a large inter-beach wetland developed on sediments of former lake plains may be
char-10
acterized by shallow, internally circulating groundwater (Fig. 6c) with variable degrees of interaction between underlying organic matter and mineral substrate. Note that the hydraulic gradient diminishes greatly inward from the margin of the wetland (Fig. 2); only the margins of the large wetland receive flow from adjoining uplands, and in some cases these areas have been influenced by human development and activity.
15
This relationship of the wetland’s landscape position to the shallow groundwater flow regime creates a generally characteristic dissolved mineral content, pH, and reduction-oxidation potential for wetland waters. For example, dissolution of calcite in the sub-strate in the absence of buffers quickly raises the pH of infiltrating soil water through the following reaction:
20
CaCO3+H+=Ca2++HCO−
3
Thus, wetlands with aerobic, oxygen-rich waters and thin organic horizons can develop an elevated pH with little increase in dissolved solid concentration. In contrast, large wetlands with little groundwater influence (Fig. 6c) are poorly flushed and the water
25
HESSD
10, 699–728, 2013Monitoring wetlands with field pH and EC
P. J. Gerla
Title Page
Abstract Introduction
Conclusions References
Tables Figures
◭ ◮
◭ ◮
Back Close
Full Screen / Esc
Printer-friendly Version Interactive Discussion
Discussion
P
a
per
|
Dis
cussion
P
a
per
|
Discussion
P
a
per
|
Discussio
n
P
a
per
|
3.3 Modeling
For wetlands where the substrate is calcareous and carbonate-rich, such as those in the Tallgrass Aspen Parkland, the following processes likely control the pH and dis-solved mineral concentration:
a. Rainwater reacts with various amounts and proportions of (a) organic carbon, (b)
5
carbonate (limestone fragments in till and sediment), and (c) CO2gas in wetland sediments.
b. Periodic flooding and saturation lower the pH through increasing interaction with CO2gas (Ponnamperuma, 1972).
c. Evapotranspiration increases the total dissolved concentration of wetland waters
10
through the loss of essentially pure water to the atmosphere.
Table 2 provides a summary of the input data for the PHREEQC simulation of main reactions likely to occur in the TAP wetlands. Rainfall composition (Table 2) is based on the average of results obtained in Minnesota by Krupa and Nosal (1999). A large range of calcite (cc) to organic carbon (oc) ratios were used initially in the model, with
15
the best correlation to observed pH and oxidation-reduction values for ratios ranging from 1 : 1 to 1 : 4 calcite to organic carbon. Beyond this range, either pH increased far beyond observed values or reduction fell below the measured mV (Table 1).
Initially in the PHREEQC model, 1 kg of rainwater reacts with calcite (cc) and organic carbon (oc) in a 1 : 4 molar ratio, which may represent a condition where a large fraction
20
of the water budget remains out of contact with mineral soil substrate (i.e. Fig. 6a). The wetland functions as a bog with little groundwater interaction (Fig. 6b). A similar but alternate model provides a 1 : 1 ratio of cc and oc in the reaction (Table 2), simulating greater interaction of rainwater with mineral soils and glacial tills in wetlands. For the TAP wetlands, the first model represents processes occurring in small, more isolated
25
HESSD
10, 699–728, 2013Monitoring wetlands with field pH and EC
P. J. Gerla
Title Page
Abstract Introduction
Conclusions References
Tables Figures
◭ ◮
◭ ◮
Back Close
Full Screen / Esc
Printer-friendly Version Interactive Discussion
Discussion
P
a
per
|
Dis
cussion
P
a
per
|
Discussion
P
a
per
|
Discussio
n
P
a
per
|
small wetlands formed within permeable glacial-lake beach sediments, and in large wetlands with deeper groundwater interaction.
The small proportion of calcite available for reaction strongly inhibits the rise of pH (Fig. 7, cc : oc=1 : 4). Furthermore, the extent of the reaction limits the generation of cations and bicarbonate, thereby mitigating increases in ionic strength and dissolved
5
mineral concentration. In contrast, reaction of the initial water with larger amounts of carbonate leads to a rise in pH and greater dissolution of solids (Fig. 7, cc : oc=1 : 1). The break in slope shown for both paths results from the onset of methanogenesis as organic carbon is progressively added to the system.
Continued increase dissolution of solids and evolution of the wetland waters requires
10
that the model consist of a two-step process, where water reacts with CaCO3 and organic carbon, as described, and undergoes reaction with CO2. Interaction of the wetland waters with abundant dissolved CO2 gas will buffer the increase of pH due to the reaction of the water with calcite (Fig. 7). Model results show that early in the reaction progress both processes lead to increasing ionic strength and pH, although
15
the system with limited calcite reaction shows significantly less increase in pH and ionic strength, which may be anticipated for isolated, precipitation-dependent wetlands. Reaction with CO2buffers pH; because pH appears to rise to as high as nine in natural wetland waters (Fig. 4), kinetics associated with calcite and organic carbon reactions may be more rapid than buffering by CO2gas.
20
Following the initial reaction of one kg of meteoric water with 1 : 1 calcite and organic carbon, the model water undergoes reaction with CO2and evaporation in various pro-portions, as shown by paths A, B, C, and D on Fig. 6. Path A and B have only a very small amount of water lost to evapotranspiration (total 10−2moles per initial kg of
wa-ter, in seven steps) (Table 2). Path A reacts with a total of 10−4moles of CO
2in seven
25
steps; path B reacts with 10−2moles. Paths C and D react with the same amount of
HESSD
10, 699–728, 2013Monitoring wetlands with field pH and EC
P. J. Gerla
Title Page
Abstract Introduction
Conclusions References
Tables Figures
◭ ◮
◭ ◮
Back Close
Full Screen / Esc
Printer-friendly Version Interactive Discussion
Discussion
P
a
per
|
Dis
cussion
P
a
per
|
Discussion
P
a
per
|
Discussio
n
P
a
per
|
Further increase in dissolved solids requires additional evapotranspiration, which also leads to small increase in pH (Fig. 7, dashed line), with the path of further pH changes depending on the degree of interaction with CO2.
3.4 Oxidation-reduction potential
Field ORP measurements ranged from −70 to +260 mV and varied both temporally 5
for individual sites and spatially. Results from the PHREEQC models (all run at 15◦C)
showed a maximum range from−340 to greater than+500 mV. ORP and EC revealed a weak, statistically insignificant correlation and not considered further in this report. No apparent relationship was found between ORP and the other field parameters, per-haps revealing the difficulties in making reproducible field measurements of ORP using
10
reference/sensor electrodes (Fiedler et al., 2007). ORP is complicated to measure for a variety of other reasons (e.g. Lindberg and Runnells, 1984; Runnells and Lindberg, 1990; Kolka and Thompson, 2006) and is strongly controlled seasonally and by site-specific conditions, such as microbiological activity, presence and absence of common oxidation-reduction couples, and interaction of soils with processes related to plant
15
physiology.
4 Discussion
The difference in the relationship to groundwater regime suggests that EC and pH will vary significantly between the beach-ridge and lake-plain wetlands (Figs. 2 and 6), which was observed in the field measurements (Fig. 4). Water composition in the
20
beach-ridge wetlands is controlled largely by processes related to shallow groundwater interaction with meteoric water. In contrast, evapotranspiration and the natural cycling of organic carbon influences the composition of shallow water in the larger lake-plain wetlands. In both wetland types, the soil substrate contains varying amounts of car-bonate minerals, which plays an important role in determining the buffering capacity of
HESSD
10, 699–728, 2013Monitoring wetlands with field pH and EC
P. J. Gerla
Title Page
Abstract Introduction
Conclusions References
Tables Figures
◭ ◮
◭ ◮
Back Close
Full Screen / Esc
Printer-friendly Version Interactive Discussion
Discussion
P
a
per
|
Dis
cussion
P
a
per
|
Discussion
P
a
per
|
Discussio
n
P
a
per
|
the soil, and therefore the differences in pH, dissolved carbonate species, and cation concentrations of the wetland waters.
4.1 Comparison of monitoring and modeling results
Trends of pH-conductivity measured in the field (Fig. 4) can be related to patterns revealed by PHREEQC models (Fig. 7). Results of repeated measurements at each
5
site during the monitoring period show significant pH and EC clustering within wetland groups across the landscape (Fig. 4):
a. Although fields of EC and pH data for various wetlands overlap, most analyses fall within a discrete range of values and have maintained their general position (Fig. 2), even under widely varying weather conditions (Fig. 8). For example, both
10
the 2005 and 2007 ice-free seasons were characterized by above normal precip-itation, but 2006 experienced below normal rainfall. In addition, Penman evapo-transpiration in 2006 was high relative to 2007, and especially so compared to 2005.
b. Beach-ridge and lake-plain wetlands at Skull Lake WMA show a strong bimodal
15
pattern between very low and moderate EC (<200 and 250–700 µS cm−1).
c. The small, isolated beach-ridge wetlands at Skull Lake WMA reveal a wide range in pH (5.4–7.6), but have a consistently low EC (<150 µS cm−1).
d. Unusually large EC occurs in wetlands that show hydrological disruption, alter-ation, and proximity to potential sources of soluble minerals (Caribou Tract and
20
Twistal Marsh samples with>500 µS cm−1).
HESSD
10, 699–728, 2013Monitoring wetlands with field pH and EC
P. J. Gerla
Title Page
Abstract Introduction
Conclusions References
Tables Figures
◭ ◮
◭ ◮
Back Close
Full Screen / Esc
Printer-friendly Version Interactive Discussion
Discussion
P
a
per
|
Dis
cussion
P
a
per
|
Discussion
P
a
per
|
Discussio
n
P
a
per
|
a. Small, isolated wetlands at Skull Lake WMA show a large range of pH and conductivity, varying from precipitation-dominated bogs with a low pH and EC (Fig. 6a), to groundwater “windows” characterized by higher pH and EC that de-veloped by significant interaction with soils and mineral substrates (Fig. 6b, c).
b. Large wetlands at Skull Lake show greater influence of evapotranspiration or
per-5
haps they occur at the more distant end of longer groundwater flow lines. Dis-tinction between these would require more thorough chemical analysis of wetland water samples. Processes related to evapotranspiration would show effects of water loss and fewer changes in the relative abundance of ions. Groundwater in-teraction with soil and underlying geological materials leads to patterns that show
10
a progressive reaction and trends in the ratios of ions.
c. The high pH of some of the sample sites in the TNC Caribou Tract (Fig. 4) may suggest early and rapid interaction of infiltration and groundwater with carbonate-rich gravels that lie at shallow depth below the lake-plain wetlands within the tract (Fig. 6c).
15
d. Lake-plain wetland waters reveal gradually decreasing pH with increasing conduc-tance, perhaps indicating coupling between greater evapotranspiration and longer interaction with CO2. The elevated Na and Cl concentration of water sampled at Twistal Marsh (Table 1) strongly suggests road salt/winter deicing on wetland wa-ters because chloride is not found naturally in such large concentrations in the
20
area. (The Twistal Marsh sample site lies within a few hundred meters of state-owned land where snow plows and other equipment are parked). In contrast, sample 2 from the TNC Caribou Tract (Table 1), has almost double the dissolved solid content, but about one-half the concentration of Na and Cl. This sample was collected from a wetland site near a ditch, where water accumulates and
under-25
HESSD
10, 699–728, 2013Monitoring wetlands with field pH and EC
P. J. Gerla
Title Page
Abstract Introduction
Conclusions References
Tables Figures
◭ ◮
◭ ◮
Back Close
Full Screen / Esc
Printer-friendly Version Interactive Discussion
Discussion
P
a
per
|
Dis
cussion
P
a
per
|
Discussion
P
a
per
|
Discussio
n
P
a
per
|
e. For a few samples, relatively low pH (<7) and increased EC (∼600) may suggest longer time in contact with organic carbon. These waters were apparently sepa-rated from contact with mineral substrate, perhaps by low permeability layers or by an isolated, shallow groundwater flow system lying entirely within organic-rich sediments.
5
4.2 Application
Wetland management issues and questions often relate to water budget. For exam-ple, land stewards and wetland managers in the Tallgrass Aspen Parkland and nearby ecoregions have asked the following questions concerning management options and choices:
10
a. Do wetlands of different size and landscape setting have a significantly different hydrological function? If so, then do wetland types need to be classified and dis-tinguished for more effective management?
b. Are some wetland types more vulnerable to land-use changes than others?
c. How does climate variability influence wetland hydrology and what efforts need to
15
taken to adaptation to future climate change?
Although determining even approximate wetland water budgets requires extensive field measurement and monitoring (e.g., Lent et al., 1997; Drexler et al., 1999), the re-sults reported here suggest that the pH–EC composition of wetland waters can provide an indication of the processes that control the water budget. For example, a relatively
20
larger EC may reveal that groundwater input occurs as a major component of a wetland water budget (Almendinger and Leete, 1998). Evapotranspiration may further increase the EC. In contrast, a small isolated wetland may have a water budget that lacks inter-action with groundwater and receives most its input from direct precipitation, such as occurs in raised bogs (e.g. Bragg and Tallis, 2001). Some of the beach ridge wetlands
25
HESSD
10, 699–728, 2013Monitoring wetlands with field pH and EC
P. J. Gerla
Title Page
Abstract Introduction
Conclusions References
Tables Figures
◭ ◮
◭ ◮
Back Close
Full Screen / Esc
Printer-friendly Version Interactive Discussion
Discussion
P
a
per
|
Dis
cussion
P
a
per
|
Discussion
P
a
per
|
Discussio
n
P
a
per
|
These will be particularly vulnerable to even small changes to the surrounding phys-ical environment, such as subtle, long-term changes in recharge or either a rise or fall of the water table, which can be caused by climate variability or the alteration of land cover. In contrast, the range in geochemical character exhibited by larger, more complex wetlands, such as TAP’s lake-plain wetlands will likely have capacity to buffer
5
new hydrogeochemical conditions brought about by changes in land use and climate. Finally, human interaction with wetlands, such as drainage, peat mining, and graz-ing, among others, can often disrupt the natural function and therefore the chemical processes of wetlands (e.g., Marsalek, 2003; Dillon and Merritt, 2005), which will be reflected early in the transition by changing pH and EC.
10
Ideally, periodic complete geochemical analysis of wetland waters and monitoring of water budgets would provide the best assurance for predicting and then avoiding ecosystem damage brought about by changes in land use. By recognizing the position of the wetland on the landscape and routinely monitoring pH and EC, however, wetland managers can better judge if alteration to the wetland environs will pose a significant
15
threat or not. By monitoring pH and EC, these data may signal the early effects of climate change, thus enabling adaption to the alteration.
5 Conclusions
This case study shows that significantly different hydrogeochemical processes and functions occur in wetlands across the Tallgrass Aspen Parkland ecoregion
land-20
scape, based on observations of field pH and EC. Wetlands function differently, de-pending greatly on the relative magnitude of water budget components, degree of in-teraction with groundwater, the typical extent of evapotranspiration, and hydrological disturbances. With their small-size coupled with a direct meteoric source for water, even small changes in climate or other physical disturbance will alter the condition
25
HESSD
10, 699–728, 2013Monitoring wetlands with field pH and EC
P. J. Gerla
Title Page
Abstract Introduction
Conclusions References
Tables Figures
◭ ◮
◭ ◮
Back Close
Full Screen / Esc
Printer-friendly Version Interactive Discussion
Discussion
P
a
per
|
Dis
cussion
P
a
per
|
Discussion
P
a
per
|
Discussio
n
P
a
per
|
hydrogeochemical patterns. Results of modeling indicate that waters in these lake-plain wetlands have undergone greater evapotranspiration and interaction with CO2. Because of their large size and geochemical heterogeneity, however, external envi-ronmental changes will likely cause changes that still fall within the previously existing geochemical range of conditions.
5
Observations and model results demonstrate that tracking, comparing, and modeling field pH and EC data can reveal wetland geochemical processes, and can also sup-plement and enhance interpretations based on water-balance observations alone. The measurements are easily done, reproducible, and require minimal equipment, thus pro-viding low-cost information that can indicate a changing physical environment, whether
10
that change results from a regional process such as climate variability or a local influ-ence related to modifications of land cover or land use.
Although not providing a complete view of hydrogeochemical processes occurring in wetlands, simple field measurements, as suggested by the results of this case study, can indicate and reveal processes that may demand greater observation, monitoring,
15
and scrutiny required for successfully managing and protecting wetland ecosystems.
Acknowledgement. The author thanks The Nature Conservancy field crew, Toni Aguilar, Aric
Donajkowski, Trenton Haffley, and Ryan Halvorson for helping with data collection, and The Nature Conservancy staff, especially Jonathan Eerkes and Russell Reisz, for their support of the project. Funding for this work was provided in part by The Nature Conservancy’s Cox Family
20
Fund for Science and Research. Special thanks to Allison Aldous, The Nature Conservancy – Oregon Chapter, for suggesting the use of field geochemical measurements as a potential way to differentiate wetland function within an ecoregion.
References
Almendinger, J. E. and Leete, J. H.: Regional and local hydrogeology of calcareous fens in the
25
Minnesota River basin, USA, Wetlands, 18, 184–202, 1998.
HESSD
10, 699–728, 2013Monitoring wetlands with field pH and EC
P. J. Gerla
Title Page
Abstract Introduction
Conclusions References
Tables Figures
◭ ◮
◭ ◮
Back Close
Full Screen / Esc
Printer-friendly Version Interactive Discussion
Discussion
P
a
per
|
Dis
cussion
P
a
per
|
Discussion
P
a
per
|
Discussio
n
P
a
per
|
Burkett, V. and Kusler, J.: Climate change: Potential impacts and interactions in wetlands of the United States, J. Am. Water Resour. As., 36, 313–320, 2000.
Davis, J. A. and Froend, R.: Loss and degradation of wetlands in southwestern Australia: Un-derlying causes, consequences and solutions, Wetl. Ecol. Manag., 7, 13–23, 1999.
Dillon, P. and Merritt, N.: Hydrochemical modeling of water quality in a ground and surface
5
water system within a semi-urban watershed, in: Proceedings of the 2005 Watershed Man-agement Conference – Managing Watersheds for Human and Natural Impacts: Engineering, Ecological, and Economic Challenges, Williamsburg, Virginia, USA, p. 1865, 2005.
Drexler, J. Z., Bedford, B. L., DeGaetano, A. T., and Siegel, D. I.: Quantification of the water budget and nutrient loading in a small peatland, J. Am. Water Resour. Assoc., 35, 753–769,
10
1999.
Erwin, K. L.: Wetlands and global climate change: the role of wetland restoration in a changing world, Wetlands Ecol. Manage., 17, 71–84, 2009.
Faulkner, S. P., Patrick Jr., W. H., and Gambrell, R. P.: Field techniques for measuring wetland soil parameters, Soil Sci. Soc. Am. J., 53, 883–890, 1989.
15
Fiedler, S., Vepraskas, M. J., and Richardson, J. L.: Soil redox potential: importance, field mea-surements, and observations, Adv. Agron., 94, 1–54, 2007.
Frei, S., Knorr, K. H., Peiffer, S., and Fleckenstein, J. H.: Surface micro-topography causes hot spots of biogeochemical activity in wetland systems: a virtual modeling experiment, J. Geophys. Res.-Biogeo., 117, G00N12, doi:10.1029/2012JG002012, 2012.
20
Gleason, R. A., Euliss Jr., N. H., Hubbard, D. E., and Duffy, W. G.: Effects of sediment load on emergence of aquatic invertebrates and plants from wetland soil egg and seed banks, Wetlands, 23, 26–34, 2003.
Gorham, E., Dean, W. E., and Sanger, J. E.: The chemical composition of lakes in the north-central United States, Limnol. Oceanogr., 28, 287–301, 1983.
25
Grootjans, A. P., Adema, E. B., Bleuten, W., Joosten, H., Madaras, M., and Jan ´akov ´a, M.: Hydrological landscape settings of base-rich fen mires and fen meadows: an overview, Appl. Veg. Sci., 9, 175–184, 2006.
Harris, K. L., Moran, S. R., and Clayton, L.: Late Quaternary Stratigraphic Nomenclature, Red River Valley, North Dakota and Minnesota, North Dakota Geol. Surv., Miscellaneous Series
30
52, 47 pp., 1974.
HESSD
10, 699–728, 2013Monitoring wetlands with field pH and EC
P. J. Gerla
Title Page
Abstract Introduction
Conclusions References
Tables Figures
◭ ◮
◭ ◮
Back Close
Full Screen / Esc
Printer-friendly Version Interactive Discussion
Discussion
P
a
per
|
Dis
cussion
P
a
per
|
Discussion
P
a
per
|
Discussio
n
P
a
per
|
Houlahan, J. E. and Findlay, C. S.: The effects of adjacent land use on wetland amphibian species richness and community composition, Can. J. Fish. Aquat. Sci., 60, 1078–1094, 2003.
International Water Institute: available at: http://www.iwinst.org/lidar/, last access: 31 December 2012.
5
IUPAC: Compendium of Chemical Terminology – International Union of Pure and Applied Chemistry Recommendations, Blackwell Science Ltd., Oxford, England, 1997.
Kolka, R. K. and Thompson, J. A.: Wetland geomorphology, soils and formative processes, in: Ecology of Freshwater and Estuarine Wetlands, edited by: Batzer, D. P. and Sharitz, R. R., University of California Press, Los Angeles and Berkeley, California, USA, 7–42, 2006.
10
Krupa, S. and Nosal, M.: Rainfall composition in Minnesota: integrating the chemistry, synoptic meteorology and numerical modelling, Environ. Pollut., 104, 477–483, 1999.
Lent, R. M., Weiskel, P. K., Lyford, F. P., and Armstrong, D. S.: Hydrologic indices for nontidal wetlands, Wetlands, 17, 19–30, 1997.
Lindberg, R. D. and Runnells, D. D.: Ground water redox reactions: an analysis of
equilib-15
rium state applied to Eh measurements and geochemical modeling, Science, 225, 925–927, 1984.
Marsalek, J.: Road salts in urban stormwater: An emerging issue in stormwater management in cold climates, Water Sci. Technol., 48, 61–70, 2003.
McCormick, P. V., Newman, S., and Vilchek, L. W.: Landscape responses to wetland
eutrophi-20
cation: loss of slough habitat in the Florida Everglades, USA, Hydrobiologia, 621, 105–114, 2009.
North Dakota Agricultural Weather Network: available at: http://ndawn.ndsu.nodak.edu/, last access: 31 December 2012.
US Fish and Wildlife Service National Wetlands Inventory: available at: http://www.fws.gov/
25
wetlands/, last access: 31 December 2012.
Parkhurst, D. L. and Appelo, C. A. J.: User’s guide to PHREEQC (version 2). A computer pro-gram for speciation, batch-reaction, one-dimensional transport, and inverse geochemical cal-culations, US Geological Survey, Water-Resources Investigations Report 99-4259, 312 pp., 1999.
30
Penman, H. L.: Natural evaporation from open water, bare soil, and grass, P. Roy. Soc., A193, 120–145, 1948.
HESSD
10, 699–728, 2013Monitoring wetlands with field pH and EC
P. J. Gerla
Title Page
Abstract Introduction
Conclusions References
Tables Figures
◭ ◮
◭ ◮
Back Close
Full Screen / Esc
Printer-friendly Version Interactive Discussion
Discussion
P
a
per
|
Dis
cussion
P
a
per
|
Discussion
P
a
per
|
Discussio
n
P
a
per
|
Runnells, D. D. and Lindberg, R. D.: Selenium in aqueous solutions: the impossibility of ob-taining a meaningful Eh using a platinum electrode, with implications for modeling of natural waters, Geology, 18, 212–215, 1990.
ˇ
Sim ˚unek, J., Van Genuchten, M. T., and ˇSejna, M.: Modeling subsurface water flow and solute
transport with HYDRUS and related numerical software packages, in: Proceedings of the
5
International Workshop on Numerical Modelling of Hydrodynamics for Water Resources – Numerical Modelling of Hydrodynamics for Water Resources, Zaragoza, Spain, 2008. Winckler, S.: Prairie: A North American Guide, University of Iowa Press, Iowa City, Iowa, US,
146 pp., 2004.
Winter, T. C.: Relation of streams, lakes, and wetlands to groundwater flow systems,
Hydro-10
HESSD
10, 699–728, 2013Monitoring wetlands with field pH and EC
P. J. Gerla
Title Page
Abstract Introduction
Conclusions References
Tables Figures
◭ ◮
◭ ◮
Back Close
Full Screen / Esc
Printer-friendly Version Interactive Discussion
Discussion
P
a
per
|
Dis
cussion
P
a
per
|
Discussion
P
a
per
|
Discussio
n
P
a
per
|
Table 1.Results of ion, nutrient, and dissolved carbon analyses of selected water sample sites.
T◦C pH EC mV Ca Mg Na NH
4 Cl NO3-N SO4 IC Tot P Rctv P OC
Caribou WMA 2.2 7.4 354 131 44.0 17.1 5.3 <0.018 14 ND ND 53 0.01 ND 18 Deerwood Marsh 2.7 7.1 599 118 79.0 37.1 2.4 0.05 3 <0.1 8.6 101 0.02 0.02 31 Skull Lake WMA (1) 4.3 6.6 21 179 2.3 1.0 1.2 0.03 0.2 ND ND 3 0.02 0.01 32 Skull Lake WMA (2) 5.1 6.6 44 143 3.0 1.7 2.0 <0.018 0.5 ND 1 14 0.06 0.02 35 Skull Lake WMA (3) 6.0 7.3 299 137 43.9 12.2 3.2 <0.018 7 0.12 1.7 48 0.03 0.01 21 Skull Lake WMA (4) 5.0 7.6 26 116 4.5 1.9 1.0 <0.018 0.2 ND 2.4 6 0.01 ND 20 TNC Caribou Tract (1) 6.0 8.5 333 126 37.4 19.1 0.7 0.03 1.2 ND 0.3 49 0.12 0.09 11 TNC Caribou Tract (2) 8.5 6.9 2510 92 379 158 22.0 0.07 0.8 ND 1530 128 0.01 ND 19 TNC Caribou Tract (3) 9.4 6.9 1330 87 193 52.1 7.9 0.06 1 ND 433.2 95 0.01 ND 25 Twistal Marsh 2.6 7.3 832 130 107 29.0 57.2 0.05 121 <0.1 5.1 96 0.08 0.06 26
EC in µS cm−1, mV=millivolts, remaining analytes are all in mg L−1, ND – not detected, IC – inorganic carbon,
HESSD
10, 699–728, 2013Monitoring wetlands with field pH and EC
P. J. Gerla
Title Page
Abstract Introduction
Conclusions References
Tables Figures
◭ ◮
◭ ◮
Back Close
Full Screen / Esc
Printer-friendly Version Interactive Discussion
Discussion
P
a
per
|
Dis
cussion
P
a
per
|
Discussion
P
a
per
|
Discussio
n
P
a
per
|
Table 2.Model rainfall composition and PHREEQC input data.
Rainfall composition(adapted from Krupa and Nosal 1999): temperature=15◦C, pH
=5.5 pe in equilibrium with the atmosphere in equilibrium with CO2at 10−
3.5 atm
Ca2+=0.233, Mg2+=0.043, Na+=0.038, K+=0.033, Cl−
=0.053, C(4)=0.1, S(6)=1.097 (all in mg L−1 ) Initial reactions:
(a) 1 : 4 molar ratio of calcite (cc) to organic carbon (oc) (b) 1 : 1 molar ratio of calcite (cc) to organic carbon (oc) react rainfall with the following reactions:
CaCO3+H+=Ca
2++HCO−
3 CH2O+H2O=CO2(gas)+4H++4e−
using 2.5×10⁻⁴moles in 20 sequential steps, for a total of 5×10⁻³moles
Latter reactions:
react the final solution composition from (b) above with – CO2(gas)+H2O=HCO−3and evaporation of pure H2O in seven steps:
path A and C – CO2gas reacted: 1×10⁻⁸, 1×10⁻⁷, 1×10⁻⁶, 5×10⁻⁶, 1×10⁻⁵, 5×10⁻⁵, and 1×10⁻⁴moles
path B and D – CO2gas reacted: 1×10⁻⁶, 1×10⁻⁵, 1×10⁻⁴, 5×10⁻⁴, 1×10⁻³, 5×10⁻³, and 1×10⁻²moles
path A and B – H2O lost: 1×10⁻⁶, 1×10⁻⁵, 1×10⁻⁴, 5×10⁻⁴, 1×10⁻³, 5×10⁻³, and 1×10⁻²moles
path C and D – H2O lost: 1×10− 4
HESSD
10, 699–728, 2013Monitoring wetlands with field pH and EC
P. J. Gerla
Title Page
Abstract Introduction
Conclusions References
Tables Figures
◭ ◮
◭ ◮
Back Close
Full Screen / Esc
Printer-friendly Version Interactive Discussion
Discussion
P
a
per
|
Dis
cussion
P
a
per
|
Discussion
P
a
per
|
Discussio
n
P
a
per
|
• by definition Isolution = 0.5 Σ ( zi 2
mi )
• assume all dissolved constituents are Ca2+ and HCO 3
-• charge balance requires 2 m(HCO3) = m(Ca)
• m(Ca) = mx and m(HCO3) = 0.5 mx
combining gives I = 0.5 * [(4 * mx) + (1 * 0.5 * mx)] = 2.25 mx
• I / 2.25 = m(Ca) and I / 4.5 = m(HCO3)
• converting to concentration (conc) in mg L-1:
conc total = (1000 mg g-1) (40.08 g mole-1) (I / 2.25) + (1000 mg g-1) (61.01 g mole-1) (I / 4.5)
or
31,371 * I = approximate concentration in mg L-1
Fig. 3.Computational steps relating ionic strength to approximate total dissolved solid
concen-tration for systems dominated by carbonate reactions. The variablez represents ionic charge
HESSD
10, 699–728, 2013Monitoring wetlands with field pH and EC
P. J. Gerla
Title Page
Abstract Introduction
Conclusions References
Tables Figures
◭ ◮
◭ ◮
Back Close
Full Screen / Esc
Printer-friendly Version Interactive Discussion
Discussion
P
a
per
|
Dis
cussion
P
a
per
|
Discussion
P
a
per
|
Discussio
n
P
a
per
|
5.0 5.5 6.0 6.5 7.0 7.5 8.0 8.5 9.0 9.5
0 300 600 900 1200 1500
pH
electrical conductivity (µS / cm)
TNC Caribou Tract Skull Lake WMA Deerwood Marsh
Caribou WMA
approximate total dissolved solids (mg/L)
0 180 360 540 720 900
Twistal Marsh
HESSD
10, 699–728, 2013Monitoring wetlands with field pH and EC
P. J. Gerla
Title Page
Abstract Introduction
Conclusions References
Tables Figures
◭ ◮
◭ ◮
Back Close
Full Screen / Esc
Printer-friendly Version Interactive Discussion
Discussion
P
a
per
|
Dis
cussion
P
a
per
|
Discussion
P
a
per
|
Discussio
n
P
a
per
|
5.5 6 6.5 7 7.5 8 8.5 9 9.5
0.01 0.1 1
mea
n
p
H
sample standard deviation
0 200 400 600 800 1000 1200 1400
1 10 100 1000
E
C
(µ
S
/
cm)
sample standard deviation
HESSD
10, 699–728, 2013Monitoring wetlands with field pH and EC
P. J. Gerla
Title Page
Abstract Introduction
Conclusions References
Tables Figures
◭ ◮
◭ ◮
Back Close
Full Screen / Esc
Printer-friendly Version Interactive Discussion
Discussion
P
a
per
|
Dis
cussion
P
a
per
|
Discussion
P
a
per
|
Discussio
n
P
a
per
|
Fig. 6.Sketch showing the general groundwater flow pattern (arrows) in the beach-ridge (A–
organic substrate andB– mineral substrate) and lake-plain(C)wetlands. Gray shading shows
HESSD
10, 699–728, 2013Monitoring wetlands with field pH and EC
P. J. Gerla
Title Page
Abstract Introduction
Conclusions References
Tables Figures
◭ ◮
◭ ◮
Back Close
Full Screen / Esc
Printer-friendly Version Interactive Discussion
Discussion
P
a
per
|
Dis
cussion
P
a
per
|
Discussion
P
a
per
|
Discussio
n
P
a
per
|
5 5.5 6 6.5 7 7.5 8 8.5 9
0 0.003 0.006 0.009 0.012 0.015
approximate concentration in mg L-1 (as Ca2+ and HCO
3-)
pH
ionic strength
cc:oc = 1:4
cc:oc = 1:1
A
B
C
D
0 100 200 300
HESSD
10, 699–728, 2013Monitoring wetlands with field pH and EC
P. J. Gerla
Title Page
Abstract Introduction
Conclusions References
Tables Figures
◭ ◮
◭ ◮
Back Close
Full Screen / Esc
Printer-friendly Version Interactive Discussion
Discussion
P
a
per
|
Dis
cussion
P
a
per
|
Discussion
P
a
per
|
Discussio
n
P
a
per
|
0
100
200
300
400
500 0
50 100 150 200 250 300
rainfall (mm) normal monthly total rainfall (mm) total Penman PET (mm)
Fig. 8. Precipitation and Penman evapotranspiration records from the Greenbush NDAWN (North Dakota Agricultural Weather Network, 2012) weather station, approximately 11 km west