Chemotaxis Receptor Complexes: From Signaling
to Assembly
Robert G. Endres1*, Joseph J. Falke2, Ned S. Wingreen1
1Department of Molecular Biology, Princeton University, Princeton, New Jersey, United States of America,2Department of Chemistry and Biochemistry, University of Colorado Boulder, Boulder, Colorado, United States of America
Complexes of chemoreceptors in the bacterial cytoplasmic membrane allow for the sensing of ligands with remarkable sensitivity. Despite the excellent characterization of the chemotaxis signaling network, very little is known about what controls receptor complex size. Here we use in vitro signaling data to model the distribution of complex sizes. In particular, we model Tar receptors in membranes as an ensemble of different sized oligomer complexes, i.e., receptor dimers, dimers of dimers, and trimers of dimers, where the relative free energies, including receptor modification, ligand binding, and interaction with the kinase CheA determine the size distribution. Our model compares favorably with a variety of signaling data, including dose-response curves of receptor activity and the dependence of activity on receptor density in the membrane. We propose that the kinetics of complex assembly can be measured in vitro from the temporal response to a perturbation of the complex free energies, e.g., by addition of ligand.
Citation: Endres RG, Falke JJ, Wingreen NS (2007) Chemotaxis receptor complexes: From signaling to assembly. PLoS Comput Biol 3(7): e150. doi:10.1371/journal.pcbi. 0030150
Introduction
The chemotaxis network allows bacteria to sense and swim toward attractants (nutrients such as amino acids and sugars) and away from repellents. For this purpose, cells are equipped with;10,000 chemoreceptors, forming large arrays at one or both cell poles. The chemotaxis network has remarkable properties, including signal integration by multi-ple types of chemoreceptors [1], precise adaptation to persistent stimulation [2,3], and high sensitivity to changes in ligand concentration [1] over several orders of magnitude of background concentrations. These signaling properties are thought to originate from strongly coupled receptor com-plexes [4,5]. Specifically, in vivo fluorescence resonance energy transfer (FRET) measurements of receptor sensitivity [1] and Hill coefficients [6] indicate coupled complexes of up to 10–20 receptor homodimers [6–10]. Despite the impor-tance of complex size to signaling, little is known about what controls receptor complex size (for recent reviews see [11,12]). In vivo observation of complex size and dynamics, e.g., by fluorescence recovery after photobleaching (FRAP), is currently not practical because of limited spatial resolution. However, the close relation between complex size and the sensitivity and cooperativity of signaling means that receptor activity can be used to probe complex size [8]. To demonstrate the potential of this approach, we analyze in vitro receptor-activity data [13–15] and present a simple biophysical model for the energetics of complex assembly.
Here we mainly focus on data from Bornhorst and Falke [13], whose in vitro receptor-activity assay employed a chemotaxis null strain ofEscherichia coli overexpressing one of the five receptor types, the high-abundance receptor Tar. The Tar receptor specifically binds aspartate and its non-metabolizable analogue methyl-aspartate (MeAsp). The cyto-plasmic membranes were isolated, and incubated with purified CheW, CheA, and CheY proteins. In vivo, CheW enhances complex formation and mediates binding to the kinase, CheA. Active CheA autophosphorylates using ATP
and transfers the phosphate to the response regulator, CheY. Phosphorylated CheY diffuses to the flagellar motor and induces clockwise rotation and cell tumbling. In vitro, CheA kinase activity was measured by assaying the rate of phosphorylation of CheY using radiolabeled ATP. CheA activity is inhibited by an increase of attractant concen-tration. For the assay, receptors were genetically engineered to have either a glutamate (E) or a glutamine (Q) at each of four specific modification sites in the cytoplasmic domain. In vivo, these four modification sites are used for adaptation, with the enzyme CheR methylating glutamates to increase the kinase activity, and the enzyme CheB demethylating methy-lated glutamates to decrease the kinase activity. In chemo-taxis, a Q is functionally similar to a methylated E. For instance, TarfQQQQg is highly active at zero attractant concentration, while TarfEEEEgis generally inactive.
Figure 1 shows experimental in vitro dose-response curves from Bornhorst and Falke [13], i.e., CheA activity versus stimulation by different amounts of attractant, for Tar receptors in defined modification states. Hill coefficients are smaller (and sensitivities are lower) than typical for in vivo studies of cells overexpressing Tars [6,8], indicating smaller in vitro clusters. The in vitro Hill coefficients (nH’2–
3) are in line with expectations from partial crystal structures [16] and cross-linking experiments [17,18] indicating that receptors oligomerize into mixed trimers of homodimers as
Editor:Edmund J. Crampin, University of Auckland, New Zealand
ReceivedFebruary 8, 2007;AcceptedJune 15, 2007;PublishedJuly 27, 2007
A previous version of this article appeared as an Early Online Release on June 15, 2007 (doi:10.1371/journal.pcbi.0030150.eor).
Copyright:Ó2007 Endres et al. This is an open-access article distributed under the terms of the Creative Commons Attribution License, which permits unrestricted use, distribution, and reproduction in any medium, provided the original author and source are credited.
Abbreviations: E, glutamate; MeAsp, methyl-aspartate; MWC model, Monod-Wyman-Changeux model; Q, glutamine
the smallest unit of complexes. In vivo, larger complexes possibly form with a hexagonal lattice structure [19,20]. Modeling in vitro data using receptor complexes of a single fixed size (e.g., trimers of dimers) does not describe the data well (inset Figure 1). Here we examine a model in which the receptor modification state determines the amount of trimers of dimers, yielding a significantly better fit to the data (solid lines in Figure 1) and suggesting that receptor modification may vary complex size, possibly along with other parameters [21].
In this paper, we analyze in detail the in vitro activity data from Bornhorst and Falke [13], Shrout et al. [14], and Lai et al. [15]. We model homodimers of Tar receptors in membranes as an ensemble of different species, including single dimers, dimers of dimers, trimers of dimers, and the signaling complex formed by the kinase CheA bound to trimers of dimers, in line with recent experiments [22]. The relative free energies of these species determine their equilibrium distribution, accounting for the different amounts of actively signaling trimers of dimers indicated by the data. We further propose that the kinetics of receptor-cluster assembly can be measured experimentally by perturbing the receptor free energies, e.g., through addition of ligand.
Results
The experimental dose-response curves in Figure 1 for Tar receptors in different modification states were obtained from in vitro reaction mixtures which always contained the same total amounts of receptor, adapter protein CheW, kinase CheA, and response regulator CheY [13]. Addition of MeAsp inhibits the kinase activity, while the number of Qs per receptor increases the kinase activity. Previously, similar dose-response curves from living cells, obtained by in vivo fluorescence resonance energy transfer (FRET), were success-fully modeled using the Monod–Wyman–Changeux (MWC) model [23] of strongly coupled two-state receptors [24], and
single Tar receptor. The free-energy difference of a single receptor has two contributions. One contribution, De(m), depends on receptor modification level,m, and ranges from positive for fully demethylated (m¼0) receptors to negative for fully methylated (m¼8) receptors. The other contribution arises from attractant binding and depends on the ligand dissociation constantsKonD andKoffD of the on and off states, respectively. If the activity is low in the absence of ligand (e.g., for demethylated receptors), the inhibition constant (ligand concentration at half maximal activity) isKi’KDoff/Nand the Hill coefficient isnH’1. In contrast, if the activity is high in
the absence of ligand (e.g., for highly methylated receptors), the inhibition constant isKiKDoffand the Hill coefficient is
nH’N, whereNis the number of receptors in the complex
([8], see Methods). Inspection of the experimental dose-response curves in Figure 1 shows that the inhibition constant of the low-activity QEEE curve is about Ki’0.01 mM MeAsp
and that Hill coefficients of the other curves arenH’2–3.
Hence, based on the MWC model and the previously determined valueKoffD ¼0.02 mM for Tar receptors binding MeAsp [8], the signaling complexes responsible for the data in Figure 1 are likely to be trimers of dimers.
Indeed, the MWC model usingN¼3 for trimers of dimers and a differentD2(m) for each receptor modification statem
(Equations 1 and 2) fits the shapes of the in vitro curves well, while allowing each curve to have a free amplitudeam(solid
curves in Figure 1). However, in the MWC model, D2(m) is also supposed to determine the relative amplitudes of the curves. Although amplitudes still depend systematically on the number of Qs (m), the relative amplitudes from the MWC model are substantially different and do not describe the data well (inset in Figure 1). Hence, each dose-response curve is well described by the MWC model for trimers of dimers, but the MWC model does not describe the relative amplitudes correctly. (Use of a two-state model without cooperativity [21] or use of an alternative MWC model with a methylation-dependentKoff
D to fit experimental amplitudes both produce lower than observed Hill coefficients.) The discrepancy in amplitudes raises the following question—given that all experiments use the same total amount of receptor, why should the amplitudes systematically differ from the MWC model predictions for different receptor-modification states? According to recent in vitro experiments, only receptors in trimers of dimers can signal [22]. Therefore, the presence of some receptors as (inactive) single dimers and dimers of dimers could account naturally for the different amplitudes observed in Figure 1. We therefore suggest that in the in vitro assays not all receptors form trimers of dimers, some also partition into single dimers and dimers of dimers, with the fraction in trimers of dimers depending on the receptor-modification state. In fact, such a partition is required by
thermodynamic equilibrium, with entropy favoring single dimers and dimers of dimers over trimers of dimers. In the following, we formulate an equilibrium model to predict the amounts and activities of trimers of dimers as a function of receptor-modification state. For this purpose, we include CheA binding to trimers of dimers only, leading to an equilibrium between free trimers of dimers, without signaling capability, and CheA-bound trimers of dimers, the signaling complex. (For simplicity, we assume that CheW is present at saturation.)
In our model for Tar receptors in membranes, we consider single dimers, dimers of dimers, trimers of dimers, and CheA-bound trimers of dimers. These different species can either be active (on) or inactive (off) as illustrated in Figure 2, but only active CheA-bound trimers of dimers can signal. The relative free energies of the various species determine their equilibrium distribution. To compare the free energies of the different species, we introduce homodimer–homodimer coupling energies, which can be different between active homodimers (Jon) and between inactive homodimers (Joff).
We also include a chemical potential,l, to adjust the receptor density. The resulting free-energy expressions are given in Equations 3–10. To facilitate calculations, we treat the membrane as a lattice where each site can be either empty, or occupied by a single dimers, a dimer of dimers, a trimer of dimers, or a CheA-bound trimer of dimers, yielding the partition function in Equation 11. To model the in vitro experiments, in which the same total amount of receptor was used for each assay, we multiply the probability that a given CheA-bound trimer of dimers is active by the fraction of receptors in CheA-bound trimer of dimers (cf. Equation 14 in Methods).
This equilibrium-assembly model (dashed lines in Figure 1) describes the data as well as the ad hoc model with free amplitudes (solid lines in Figure 1). Specifically, the equili-brium-assembly model accounts for the systematic depend-ence of the dose-response curve amplitudes on receptor modification state. Since for each curve we assume a fixed fraction of CheA-bound trimers of dimers, set by the incubation conditions, the shape of each curve is still determined by the MWC model with N¼3 (Equation 13 in Methods). While the equilibrium-assembly model requires seven parameters,KonD,KoffD ,Jon,Joff,2A,l, anda, plus an offset
energy, D2, for each receptor-modification state, some of these parameters are nearly redundant. For example,D2and
JonJoffplay nearly equivalent roles, as doland (JonþJoff)/2,
differing only in their effects on the ratio of dimers of dimers and trimers of dimers. Therefore, our parameter choices represent only one consistent set of values.
In their data, Bornhorst and Falke [13] observed a strong correlation between the activity in the absence of MeAsp and the inhibition constant Ki. Figure 3A shows this correlated
data for all possible modification states except EEEE, for which the measured activity was zero. The observed func-tional relation between activity and Ki supports our
suggestion that not all receptors form CheA-bound trimer of dimers. To illustrate, in Figure 3A we have plotted, as a dotted curve, the expected relation between activity andKiif
all receptors did form CheA-bound trimers of dimers. The curve has a noticeably different shape from the experimental data. In contrast, the equilibrium-assembly model, with the same parameters as in Figure 1, is able to capture the observed relation between activity andKi(dashed curve). In
either case, the one-to-one relation between activity andKi
follows because both quantities depend uniquely on the receptor offset energyD2. For ease of comparison, we used the same amplitude parameter a ¼ 10 for both curves in Figure 3A. This means that the ratio of the two curves gives the fraction of receptors in CheA-bound trimers of dimers in the equilibrium-assembly model, because only those recep-tors in CheA-bound trimer of dimers contribute to the activity. The actual fraction of receptors in CheA-bound trimers of dimers (and in all trimers) is shown in Figure 3B, both for the equilibrium-assembly model and, by inference,
Figure 2.Schematic of Membrane-Bound Chemoreceptor Complexes Membrane contains equilibrated mixture of active (black) and inactive (white) single dimers, dimers of dimers, trimers of dimers, and bound trimers of dimers, where CheA is shown in yellow. Only CheA-bound trimers of dimers can signal. Red and green lines indicate interactions among active and inactive receptors, respectively. doi:10.1371/journal.pcbi.0030150.g002
Figure 1.In Vitro Dose-Response Curves and Fits from Models Activity of CheA complexed to Tar receptors of defined modification state (QQQQ, QEQQ, QEQE, QEEE) for different MeAsp attractant concentra-tions. Data (mean and standard deviation of three measurements) are taken from in vitro activity assays of Bornhorst and Falke [13]. All measurements used the same total amount of receptor. Least-squares fits: solid curves, simple model of signaling by trimers of dimers, where the amplitude of each curve (e.g., QQQQ) is an independent fitting parameter; dashed curves, equilibrium-assembly model of an ensemble of single dimers, dimers of dimers, trimers of dimers, and CheA-bound trimers of dimers, where only CheA-bound trimers of dimers can signal. Inset: all receptors assumed to form trimers of dimers. The MeAsp dissociation constantsKDoff¼0.02 mM andKDon¼0.5 mM are taken from [8].
for the in vitro data. Why does the fraction of receptors in CheA-bound trimers of dimers increase withKi? Within the
model, the inhibition constant Ki increases as the offset
energyD2decreases; this behavior follows because decreasing
D2 favors the active state of receptors, and therefore more attractant is required to inactivate them. The same shift of receptors toward higher activity causes the fraction of receptors in CheA-bound trimers of dimers to increase, both because Jon , Joff implies a stronger tendency of active
receptors to form trimers of dimers, and simply because increasing the total concentration of active receptors increases their equilibrium partition into trimers of dimers.
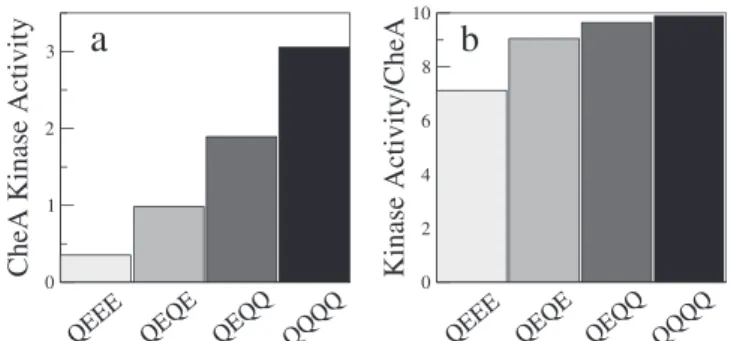
Our suggestion that not all receptors form trimers of dimers or CheA-bound trimers of dimers is given further experimental support by Shrout et al. [14] and Lai et al. [15] who used a receptor-activity assay similar to that of Bornhorst and Falke but with E. coli Tar receptors. Shrout et al. measured the kinase activity for different modification states of cytoplasmic Tar-receptor fragments at zero attrac-tant concentration. While the measured activities depended strongly on modification state, the same activities normalized by the amount of bound CheA were almost independent of modification state. We find the same behavior in our equilibrium-assembly model. Figure 4 shows the calculated activity and activity per CheA (activity divided by the fraction of receptors in CheA-bound trimers of dimers) for four different receptor-modification states (cf. Figure 1). We observe qualitative agreement with the data in Figure 2A of
Shrout et al. [14], although their receptor fragments tend to be more active than complete receptors [25]. In the equilibrium-assembly model, if the CheA-bound trimers of dimers were always fully active (on), the normalized activities would be completely independent of the modification state. However, for receptors with few Qs, the CheA-bound trimers of dimers are not fully active even at zero attractant concentration, resulting in the weak modification-level dependence of the normalized activity seen in Figure 4B.
If an equilibrium exists among single dimers, dimers of dimers, trimers of dimers, and CheA-bound trimers of dimers, one would expect changes in the receptor density to affect the distribution of different sized receptor clusters. Consistent with this expectation, Lai et al. [15] reported the activity per TarfQEQEg receptor, in the absence of attractant, as a function of the receptor fraction of total membrane protein. As shown in Figure 5, they observed an increase in and saturation of the activity per receptor with increasing receptor fraction. We interpret their data to mean that at low receptor fractions (densities), it is thermodynamically unfavorable for receptors to come together and form trimers of dimers (or even dimers of dimers), and consequently single dimers, which lack signaling capability, predominate. This density-dependent activity per receptor is captured by our equilibrium-assembly model, as shown in Figure 5 (solid lines), using the same parameters as in Figure 1. The calculated activity is scaled by an overall factor to convert to the activity scale of Lai et al. [15], and the calculated receptor density (Equation 15) is also rescaled. Within the equilibrium-assembly model, the kinase activity per receptor increases with receptor density entirely because of the increasing fraction of receptors in CheA-bound trimers of dimers expected from thermodynamics.
The large amount of in vitro data from Bornhorst and Falke [13] can be used to test an additional hypothesis. Specifically, do the offset energies from each of the four modification sitesD2i¼1,2,3,4contribute additively to give the
total offset energyD2? The total offset energyD2for each of the 15 modification states can be obtained from the inhibition constants Ki [13] based on our model that only
CheA-bound trimers of dimers can signal (see Methods). This value can be compared with the additive model, where the
D2iare treated as fitting parameters. Figure 6 shows that the additive model for the total offset energy is indeed a
Figure 4.Kinase Activity per Receptor-Bound CheA
(A) CheA kinase activity at zero attractant concentration for four different receptor modification states within the equilibrium-assembly model (Figure 1, dashed curves).
(B) Kinase activity per receptor-bound CheA, i.e., activity from (A) divided by fraction of receptors in CheA-bound trimers of dimers (cf. Figure 3B). doi:10.1371/journal.pcbi.0030150.g004
Figure 3.Kinase Active Receptors Are in CheA-Bound Trimers of Dimers (A) CheA kinase activity at zero MeAsp concentration versusKi, defined
as the MeAsp concentration required to reduce activity by one-half, for Tar receptors in different modification states. Data (mean and standard deviation of three measurements) are taken from in vitro activity assays and Hill fits of Bornhorst and Falke [13]. All measurements used the same total amount of receptor. Dotted curve, all receptors assumed to form CheA-bound trimers of dimers (A:TDs), with maximal activitya¼10. Dashed curve, equilibrium-assembly model with samea(cf. Figure 1, dashed curves).
(B) Left axis, fraction of receptors in A:TDs, i.e., ratio of data or dashed curve to the dotted curve in (A). Right axis, fraction of receptors in all trimers (TDs and A:TDs), equal to the fraction of receptors in A:TDs multiplied by 1þexp(2A), where2Ais the binding energy of CheA (see
Methods). The MeAsp dissociation constantsKDoff¼0.02 mM andKDon¼
0.5 mM are taken from [8].
reasonably good approximation. Interestingly, modification sites 1 to 3 make a similar contribution (approximately0.5 to 0.6 kBT ) while site 4 makes a smaller contribution
(approximately0.3kBT) to the offset energy (see Methods).
This may have to do with the fact that, relative to the CheA binding site, modification sites 1 to 3 are nearby on the N-terminal side of the receptor and modification site 4 is on the C-terminal side of the receptor.
Discussion
The chemotaxis network of E. coli exhibits remarkable sensing and signaling properties that rely on receptor complexes. Despite recent high resolution electron micro-scopy [19,20], fluorescence images [26–28], and in vivo fluorescence recovery after photobleaching (FRAP) measure-ments of protein dynamics (V. Sourjik, personal correspond-ence), very little is known about what determines receptor-complex size [11,12]. Interestingly, because receptor-complex size and signaling sensitivity or cooperativity are closely related [8], receptor kinase activity can be used to probe complex size. Starting from in vitro dose-response data of the activity of Tar receptors in native membranes [13–15], we presented a simple biophysical model for the energetics of complex assembly that can account for these and other data. An essential feature of the model is that not all receptors form signaling complexes, i.e., kinase CheA-bound trimers of dimers. Our model for receptor complexes is based on an MWC model, with constantsKonD andKoffD , in which receptor modification state affects complex size only through the offset energyD2(which depends additively on contributions from the four modification sites). At this stage, we cannot rule out alternative models, e.g., in which modification state affects other parameters as well [21].
In our model, Tar receptors form an ensemble of different species, including single dimers, dimers of dimers, trimers of dimers, and CheA-bound trimers of dimers, as illustrated in Figure 2. The different species can either be active (on) or inactive (off), but only active CheA-bound trimers of dimers can phosphorylate CheY. This is in line with recent in vitro experiments where trimers of dimers were found to signal, but single dimers and dimers of dimers did not signal [22]. The relative free energies of the various species determine their equilibrium distribution, leading naturally to the observed variation in the signaling activity of receptors in different modification states (cf. Figures 1, 3, 4, 5). We find that the fraction of receptors in trimers of dimers and CheA-bound trimers of dimers increases with the number of Qs at the modification sites (or withKi, see Figure 3B). Within this
picture, the‘‘superactivity’’of certain mutant receptors can be attributed to more efficient complex formation rather than enhanced CheA binding or kinase velocity [25].
Our free-energy model assumes that complex assembly/ disassembly is slow compared with changes in signaling. For instance, if attractant is added together with ATP to initiate the activity measurement, the ensemble of clusters is assumed to stay frozen, i.e., the ratio of fsingle dimersg:fdimers of dimersg:ftrimers of dimersg:fCheA-bound trimers of dimersg is assumed to be unaffected by the addition of attractant, even though the kinase activity is immediately affected. This separation of time scales is reflected in Equation 14, where the fraction of receptors in CheA-bound trimers of dimers (first factor) is evaluated at the incubation attractant concentration ([L0]¼0), while the activity (second
factor) is evaluated in the presence of the added attractant ([L]). To model the case where attractant is added during incubation, one only needs to set [Lo]¼[L]. In this case, shown
by solid curves in Figure 7, inhibition occurs at lower
Figure 6.Additivity of Offset Energies from Four Modification Sites Test of additivity of the contributions of the four modification sites to the total offset energy D2, based on the in vitro data for 15 receptor modification states (all possible combinations of Es and Qs, except EEEE) from Table I of [13]. Horizontal axis,D2obtained from experimentalKi
values (see Methods); vertical axis,D2determined from the sum of the offset energies from the four individual modification sitesD2itreated as
v2fitting parameters (see Methods). Inset, histogram ofv2values after minimization for 1,000 randomized permutations of the data;v2¼0.67 of the unrandomized data is the lowestv2(see Methods).
doi:10.1371/journal.pcbi.0030150.g006
Figure 5.Kinase Activity versus Receptor Fraction of Total Membrane Protein
The data for TarfQEQEgreceptors (mean and standard deviation of three measurements) are taken from in vitro activity assays of Lai et al. [15]. All measurements used the same amount of receptor. Solid curves for receptors in different modification states were calculated with param-eters obtained from the equilibrium-assembly model (Figure 1, dashed curves). Calculated activities are scaled by 0.9 to convert to activity of Lai et al. [15], and receptor density is scaled by 5.3 to convert to receptor as a fraction of total protein.
attractant concentrations, in agreement with the data of Lai et al. [15] for TarfQEQEg incubated in the presence of MeAsp (solid symbols). In the model, the inhibition at lower attractant concentrations can be traced to the loss of trimers of dimers in favor of single dimers and dimers of dimers in the new equilibrium produced by incubation with attractant (see inset Figure 7). Incubation with attractant is exactly the opposite of adding Qs in terms of receptor free energies, and therefore favors smaller rather than larger complex sizes.
The dose-response curves in Figure 7 for incubation without attractant (dashed curves) and with attractant (solid curves) are easily distinguishable, which suggests a way to measure the kinetics of complex assembly. During the period after the addition of attractant, as the clusters re-equilibrate, the dashed curves must evolve toward the solid curves. The rate of evolution can be quantified by measuring the kinase activity at specific times following the addition of attractant. In this way, information can be obtained about the kinetics of assembly and disassembly of receptor complexes. Our equilibrium-assembly model, augmented by kinetic rate constants, provides an appropriate theoretical framework for planning and interpreting kinetic experiments of this type.
There are previously published models for chemoreceptor complex assembly. These models, however, do not consider the effects of ligand binding, and hence cannot address dose-response data. Furthermore, Lai et al. [15] assume all receptors form trimers of dimers, hence their model cannot explain the activity versus receptor density data in Figure 5. Shrout et al. [14] assume that CheA binding directly depends on the receptor modification state. While this assumption can explain the increase of activity with modification level, it violates the conventional view of precise adaptation based on the two-state receptor model, where receptors are either on
receptor activity determines cluster assembly and, conse-quently, CheA recruitment and activity (see also Li and Weis [29]).
An approach similar to ours may allow measurement of the kinetics of receptor complexes in living cells. Complex sizes of 10–20 receptors or more have been inferred from in vivo dose-response curves [6–10] and, in E. coli cells lacking an adaptation system, polar clustering appears to depend on receptor-modification level ([28,30,31]; V. Sourjik, personal correspondence). This suggests that dose-response curves can be used to measure the real-time evolution of in vivo cluster sizes in response to perturbations of receptor free energy, e.g., addition of attractant or repellent. It is not clear why in vivo complexes are significantly larger than the trimers of dimers seen in vitro and why receptors localize predom-inately at the cell poles. It is known that receptors are inserted into the membrane by the Sec translocon machinery [32] in large cell-spanning spirals [33]. Once inserted into the membrane, receptors may localize at the cell poles due to the higher membrane curvature [34] and/or different lipid composition [35–37] at the poles. A means to probe receptor-assembly kinetics may help reveal what determines complex size in vivo.
Compared with previous modeling of in vivo data [8–10], the offset energies,D2, obtained from in vitro data are much larger. This can be traced to the fact that we explicitly include homodimer–homodimer interactions, which lead to an effective offset energy for each receptor in a trimer of dimer ofD2 þJonJoff, close to estimated in vivo values. However,
in a large in vivo complex, if each receptor participates in six homodimer–homodimer interactions, as on a hexagonal lattice, the effective offset energy per receptor would beD2 þ 3(Jon Joff), which is much more negative than the
estimated in vivo values. One possible resolution might be that, in an in vivo cluster, homodimers in different trimers of dimers are coupled together more weakly than homodimers within a trimer of dimers. However, the coupling between trimers of dimers must still be strong enough to cause clusters of 10–20 receptors to switch on and off together. An important open question is what mediates the interactions among receptor homodimers in trimers of dimers, or between trimers of dimers? One way to address this question may be to measure in vitro or in vivo dose-response curves of mutant receptors specifically engineered to interrupt or strengthen homodimer–homodimer interfaces. Possible in-sight can be gained from the observation of large in vitro Tsr clusters [29], pointing toward a difference between Tsr:Tsr and Tar:Tar interfaces [15].
We expect that a better understanding of the assembly ofE. colichemoreceptor complexes may provide insights into the oligomerization of other membrane proteins, including
Figure 7.From Signaling to Assembly Kinetics
bacterial outer membrane proteins such as porins (e.g., LamB). For other membrane-bound receptors that form complexes, including ryanodine receptors [38,39] and rho-dopsin [40], we hope that analysis of complex size and assembly kinetics based on dose-response curves may also prove feasible.
Methods
Review of in vitro activity assay. We mainly model the data of Bornhorst and Falke [13], who used an in vitro activity assay to study
chemotaxis signaling. Briefly, Tar receptors ofSalmonella typhimurium
were engineered to be in a particular modification state, e.g., QQQQ, QEQQ, QEQE, or QEEE, where Q is approximately equivalent to a
methylated E. Using a chemotaxis null strain of E. coli, the Tar
receptor was overexpressed from a plasmid. Cytoplasmic membranes were isolated in which Tar receptors constituted approximately 5%– 10% of total membrane protein. Reaction mixtures of the same total amount of Tar and purified CheA, CheW, and CheY were prepared and incubated for 45 min to allow for complex formation in native membranes. Signaling was initiated by adding radiolabeled ATP. The activity of CheA was measured by assaying the rate of phosphor-ylation of CheY and normalized to QEQE (wild-type). Quantified attractant (MeAsp) was added with the ATP.
Monod–Wyman–Changeux model. In the MWC model [6,8,23], two-state receptors (homodimers) [24,41] form complexes with all receptors in a complex either on or off together. At equilibrium,
the probability that an MWC cluster of N Tar receptors will be
active is
pon¼
eNfon eNfon
þeNfoff¼
1
1þeNDf; ð1Þ
whereN fon(N foff) andfon(foff) are the free energies of the complex
as a whole and an individual receptor to be on (off), respectively. The individual receptor free-energy difference is given by
Df ¼fonðmÞ foff¼D2 ðmÞ þlog 1þ ½L=K
off D
1þ ½L=Kon
D
: ð2Þ
Here, [L] is the ligand (MeAsp) concentration,mis the number of
Qs per receptor (m ¼ 0,. . .,8), and KonD and KDoff are the ligand
dissociation constants in the on and off states, assumed to be
independent ofm. All energies are expressed in units of the thermal
energykBT.
In our model, Qs or methylated Es favor the on state of a receptor
by loweringD2(m), while attractant binding favors the off state, i.e.,
KoffD , KonD. Importantly, the model exhibits two regimes [8]. In
regime I, whereD2.0 (e.g., for TarfEEEEg), receptors have a low
activity and an inhibition constant (ligand concentration at half
maximal activity),Ki’KoffD /N, indicating anNtimes higher sensitivity
than for a single receptor. In regime II, where D2 , 0 (e.g., for
TarfQQQQg), receptors are highly active, and turn off at large
attractant concentrationKi’KDoffexp(jD2j) with high cooperativity,
i.e., a Hill coefficient nH ’ N. The possible MWC complexes
considered here are the single receptor dimer, the dimer of dimers,
and the trimer of dimers, corresponding to complex sizesN¼1, 2,
and 3, respectively.
Equilibrium-assembly model. We use statistical mechanics to predict the partitioning of receptors into active and inactive single dimers, dimers of dimers, trimers of dimers, and CheA-bound trimers of dimers, as illustrated in Figure 2. Since CheA-bound trimers of dimers are the signaling complex, only trimers of dimers can signal, not single dimers and dimers of dimers, in line with recent experiments [22]. To compare the energies of the different-sized complexes, we generalized the MWC model to include homodimer– homodimer interactions. The interaction energy between active
homodimers (Jon) and the interaction energy between inactive
homodimers (Joff) can be different. These homodimer–homodimer
interactions may originate from interactions of the periplasmic or cytoplasmic domains of the receptors, possibly mediated by the adapter protein CheW. Specifically, single dimers, dimers of dimers, and trimers of dimers (as well as CheA-bound trimers of dimers) have zero, one, and three homodimer–homodimer interactions,
respec-tively. We also introduce a receptor chemical potential,l, which
determines the receptor density,q, in the membrane, and a free
energy,2A, for the binding of the kinase CheA to trimers of dimers
(assuming for simplicity an equilibrium between bound CheAs and
free CheAs at some invariant concentration). The resulting complex free energies for a single dimer (SD), a dimer of dimers (DD), a trimer of dimers (TD), and a CheA-bound trimer of dimers (A:TD) are given by
FSDon¼D2 logð1þ ½L=Kon
DÞ l ð3Þ
FSDoff¼ logð1þ ½L=Koff
D Þ l ð4Þ
FDDon¼2ðD2 logð1þ ½L=Kon
DÞ lÞ þJon ð5Þ
FSDoff¼2ðlogð1þ ½L=Koff
D Þ lÞ þJoff ð6Þ
FTDon¼3ðD2 logð1þ ½L=Kon
DÞ lþJonÞ ð7Þ
FTDoff¼3ðlogð1þ ½L=Koff
D Þ lþJoffÞ ð8Þ
FAT:Don ¼3ðD2 logð1þ ½L=Kon
DÞ lþJonÞþ 2A ð9Þ
FAToff:D¼3ðlogð1þ ½L=KoffD Þ lþJoffÞþ 2A ð10Þ
To regularize our calculations, we treat the membrane as a lattice where each lattice site can be either empty, or occupied by a single dimer, a dimer of dimers, a trimer of dimers, or a CheA-bound trimer of dimers, determined by their relative free energies. The equilibrium partition function of a single lattice site is given by
Z¼1þeFonSDþeFoffSD
þeFon DDþeFoffDD
þeFon TDþeFoffTD
þeFonA:TDþeFoffA:TD
ð11Þ
The probability that a site is occupied by species s (¼SD, DD, TD,
or A:TD) is given by
Ps¼ eFon
s þeF of f s
Z ð12Þ
The probability that a particular CheA-bound trimer of dimers is active is given by the MWC model (cf. Equation 1), now also
depending onJonJoff,
pA:TDon ¼
1
1þeFon
TDFoffTD
¼ 1
1þe3ðDfþJonJof fÞ ð13Þ
To compare with experiments on a per receptor basis, the probability that each CheA-bound trimer of dimers is active needs to be multiplied by the fraction of receptors in CheA-bound trimers of dimers, i.e.,
A¼a 3PA:TD
PSDþ2PDDþ3ðPTDþPA:TDÞ
½L0 pAon:TDð½LÞ ð14Þ
whereais an overall amplitude parameter, and can be interpreted as
the maximal possible activity, which would be achieved if all receptors were in active CheA-bound trimers of dimers. The ligand
concentrations [L0] and [L] indicate that the ensemble of species can
equilibrate at one ligand concentration, e.g., [L0]¼0, while signaling
can be measured at another concentration, [L].
Assuming a constant density,q, of receptors in the membrane, we
find the chemical potential,l, that yields this density. The definition
of the density,
q¼PSDþ2PDDþ3ðPTDþPA:TDÞ; ð15Þ
can be solved forlby solving the cubic equation
qþ ðq1Þaxþ ðq2Þbx2þ ðq3Þcx3¼0 ð16Þ
forx¼eland choosing the largest real root. The coefficients are given
by
a¼eF~onSDþeF~offSD ð17Þ
b¼eF~onDDþeF~offDD ð18Þ
c¼eF~onTDþeF~offTDþeF~onA:TDþeF~offA:TD; ð19Þ
Additivity of offset energies.We test whether modifications of the
four receptor sites contribute additively to the total offset energyD2.
From the measured inhibition constants,Ki,of 15 different receptor
modification states (QEEE, etc., except EEEE) [13], the totalD2can be
calculated from Equation 13, assuming only CheA-bound trimers of dimers can signal
D2 ðKiÞ ¼
1
3log
1þKi=KoffD
1þKi=KonD
3
2
" #
JonþJoff ð20Þ
withJonJoff¼ 3.39 from the previous paragraph. These values for
the total offset energies can be compared with the corresponding values within an additive model
D2 ¼X4 i¼0
D2i: ð21Þ
whereD2i¼1,. . .,4is the contribution to the total offset energy from
the presence of a Q at sitei. The values D2i¼0,. . .,4are treated as
fitting parameters obtained from minimizing
v2¼ X
15
M¼1
ðDeðKiðMÞÞ X4
i¼0
DeiðMÞÞ2; ð22Þ
With M indexing the 15 modification states. D20 allows a fully
Supporting Information
Accession NumbersThe primary protein accession numbers from the Swiss-Prot
data-bank (http://www.ebi.ac.uk/swissprot/) for the E. coli proteins
men-tioned in the text are: Tar MCP2 ECOLI (P07017), Tsr MCP1 ECOLI (P02942), CheW O157 CHEW ECO57 (P0A966), CheA CHEA ECOLI (P07363), and CheY O157 CHEY ECOLI (P0AE67).
Acknowledgments
The authors thank Joshua Bornhorst, Ranjan Mukhopadhyay, Tom Shimizu, and Monica Skoge for valuable suggestions. RGE thanks Run-Zhi Lai from the Manson lab for providing data for Figures 5 and 7. RGE and NSW acknowledge funding from the Human Frontier Science Program (HFSP).
Author contributions.RGE, JJF, and NSW analyzed the data. RGE and NSW conceived and designed the model. RGE performed the model calculations. RGE, JJF, and NSW wrote the paper.
Funding.The authors received no specific funding for this study.
Competing interests.The authors have declared that no competing interests exist.
References
1. Sourjik V, Berg HC (2002) Receptor sensitivity in bacterial chemotaxis. Proc Natl Acad Sci U S A 99: 123–127.
2. Berg HC, Brown DA (1972) Chemotaxis inEscherichia colianalyzed by three-dimensional tracking. Nature 239: 500–504.
3. Alon U, Surette MG, Barkai N, Leibler S (1999) Robustness in bacterial chemotaxis. Nature 397: 168–171.
4. Bray D, Levin MD, Morton-Firth CJ (1998) Receptor clustering as a cellular mechanism to control sensitivity. Nature 393: 85–88.
5. Duke TA, Bray D (1999) Heightened sensitivity of a lattice of membrane receptors. Proc Natl Acad Sci U S A 96: 10104–10108.
6. Sourjik V, Berg HC (2004) Functional interactions between receptors in bacterial chemotaxis. Nature 428: 437–441.
7. Mello BA, Tu Y (2005) An allosteric model for heterogeneous receptor complexes: Understanding bacterial chemotaxis responses to multiple stimuli. Proc Natl Acad Sci U S A 102: 17354–17359.
8. Keymer JE, Endres RG, Skoge M, Meir Y, Wingreen NS (2006) Chemo-sensing inEscherichia coli: Two regimes of two-state receptors. Proc Natl Acad Sci U S A 103: 1786–1791.
9. Skoge S, Endres RG, Wingreen NS (2006) Receptor–receptor coupling in bacterial chemotaxis: Evidence for strongly coupled clusters. Biophys J 90: 4317–4326.
10. Endres RG, Wingreen NS (2006) Precise adaptation in bacterial chemotaxis through‘‘assistance neighborhoods.’’Proc Natl Acad Sci U S A 103: 13040– 13044.
11. Kentner D, Thiem S, Hildenbeutel M, Sourjik V (2006) Determinants of chemoreceptor cluster formation inEscherichia coli. Mol Microbiol 61: 407– 417.
12. Kentner D, Sourjik V (2006) Spatial organization of the bacterial chemo-taxis system. Curr Opin Microbiol 9: 619–624.
13. Bornhorst JA, Falke JJ (2001) Evidence that both ligand binding and covalent adaptation drive a two-state equilibrium in the aspartate receptor signaling complex. J Gen Physiol 118: 693–710.
14. Shrout AL, Montefusco DJ, Weis RM (2003) Template-directed assembly of receptor signaling complexes. Biochemistry 42: 13379–13385.
15. Lai RZ, Manson JM, Bormans AF, Draheim RR, Nguyen NT, et al. (2005) Cooperative signaling among bacterial chemoreceptors. Biochemistry 44: 14298–14307.
16. Kim KK, Yokota H, Kim SH (1999) Four-helical-bundle structure of the cytoplasmic domain of a serine chemotaxis receptor. Nature 400: 787–792.
17. Ames P, Studdert CA, Reiser RH, Parkinson JS (2002) Collaborative signaling by mixed chemoreceptor teams inEscherichia coli. Proc Natl Acad Sci U S A 99: 7060–7065.
18. Studdert CA, Parkinson JS (2004) Crosslinking snapshots of bacterial chemoreceptor squads. Proc Natl Acad Sci U S A 101: 2117–2122. 19. McAndrew RS, Ellis EA, Manson MD, Holzenburg A (2004) TEM analysis of
chemoreceptor arrays in native membranes ofE. coli. Microsc Microanal 10: 416.
20. Zhang P, Khursigara CM, Hartnell LM, Subramaniam S (2007) Direct visualization of Escherichia coli chemotaxis receptor arrays using cryo-electron microscopy. Proc Natl Acad Sci U S A 104: 3777–3781. 21. Bornhorst JA, Falke JJ (2003) Quantitative analysis of aspartate receptor
signaling complex reveals that the homogeneous two-state model is inadequate: Development of a heterogeneous two-state model. J Mol Biol 326: 1597–1614.
22. Boldog T, Grimme S, Li M, Sligar SG, Hazelbauer GL (2006) Nanodiscs separate chemoreceptor oligomeric states and reveal their signaling properties. Proc Natl Acad Sci U S A 103: 11509–11514.
23. Monod J, Wyman J, Changeux JP (1965) On the nature of allosteric transitions: A plausible model. J Mol Biol 12: 88–118.
24. Asakura S, Honda H (1984) Two-state model for bacterial chemoreceptor proteins. The role of multiple methylation. J Mol Biol 176: 349–367. 25. Asinas AE, Weis RM (2006) Competitive and cooperative interactions in
receptor signaling complexes. J Biol Chem 281: 30512–30523.
26. Maddock JR, Shapiro L (1993) Polar location of the chemoreceptor complex in theEscherichia colicell. Science 259: 1717–1723.
27. Gestwicki JE, Lamanna AC, Harshey RM, McCarter LL, Kiessling LL, et al. (2000) Evolutionary conservation of methyl-accepting chemotaxis protein location in Bacteria and Archaea. J Bacteriol 182: 6499–6502.
28. Liberman L, Berg HC, Sourjik V (2004) Effect of chemoreceptor modification on assembly and activity of the receptor-kinase complex in Escherichia coli. J Bacteriol 186: 6643–6646.
29. Li G, Weis RM (2000) Covalent modification regulates ligand binding to receptor complexes in the chemosensory system ofEscherichia coli. Cell 100: 357–365.
30. Lybarger SR, Nair U, Lilly AA, Hazelbauer GL, Maddock JR (2005) Clustering requires modified methyl-accepting sites in low-abundance but not high-abundance chemoreceptors ofEscherichia coli. Mol Microbiol 56: 1078–1086.
localization of a chemoreceptor via its covalent modifications and its communication with a different chemoreceptor. J Bacteriol 187: 7647– 7654.
32. Gebert JF, Overhoff B, Manson MD, Boos W (1988) The Tsr chemosensory transducer ofEscherichia coliassembles into the cytoplasmic membrane via a SecA-dependent process. J Biol Chem 263: 16652–16660.
33. Shiomi D, Yoshimoto M, Homma M, Kawagishi I (2006) Helical distribution of the bacterial chemoreceptor via colocalization with the Sec protein translocation machinery. Mol Microbiol 60: 894–906.
34. Shih YL, Kawagishi I, Rothfield L (2005) The MreB and Min cytoskeletal-like systems play independent roles in prokaryotic polar differentiation. Mol Microbiol 58: 917–928.
35. Dowhan W, Mileykovskaya E, Bogdanov M (2004) Diversity and versatility of lipid-protein interactions revealed by molecular genetic approaches. Biochim Biophys Acta 1666: 19–39.
36. Kawai F, Shoda M, Harashima R, Sadaie Y, Hara H, et al. (2004) Cardiolipin domains inBacillus subtilismarburg membranes. J Bacteriol 186: 1475–1483. 37. Huang KC, Mukhopadhyay R, Wingreen NS (2006) A curvature-mediated mechanism for localization of lipids to bacterial poles. PLoS Comput Biol 2: e151.
38. Franzini-Armstrong C, Protasi F, Ramesh V (1999) Shape, size, and distribution of Ca(2þ) release units and couplons in skeletal and cardiac muscles. Biophys J 77: 1528–1539.
39. Yin CC, Lai FA (2000) Intrinsic lattice formation by the ryanodine receptor calcium-release channel. Nat Cell Biol 2: 669–671.
40. Fotiadis D, Liang Y, Filipek S, Saperstein DA, Engel A, et al. (2003) Atomic-force microscopy: Rhodopsin dimers in native disc membranes. Nature 421: 127–128.