Inequity in hospitalization care: a study on utilization of
healthcare services in West Bengal, India
Montu Bose1,*, Arijita Dutta2
Abstract
Background: Out of eight commonly agreed Millennium Development Goals (MDG), six are related to the attainment of Universal Health Coverage (UHC) throughout the globe. This universalization of health status suggests policies to narrow the gap in access and benefit sharing between different socially and economically underprivileged classes with that of the better placed ones and a consequent expansion of subsidized healthcare appears to be a common feature for most of the developing nations. The National Health Policy in India (2002) suggests expansion of market-based care for the affording class and subsidized care for the deserving class of the society. So, the benefit distribution of this limited public support in health sector is important to examine to study the welfare consequences of the policy. This paper examines the nature of utilization to inpatient care by different socio-economic groups across regions and gender in West Bengal (WB), India. The benefit incidence of public subsidies across these socio-economic groups has also been verified for different types of services like medicines, diagnostics and professional care etc.
Methods: National Sample Survey Organization (NSSO) has collected information on all hospitalized cases (60th round, 2004) with a recall period of 365 days from the sampled households through stratified random sampling technique. The data has been used to assess utilization of healthcare services during hospitalization and the distribution of public subsidies among the patients of different socio-economic background; a Benefit Incidence Analysis (BIA) has also been carried out. Results: Analysis shows that though the rate of utilization of public hospitals is quite high, other complementary services like medicine, doctor and diagnostic tests are mostly purchased from private market. This leads to high Out-of-Pocket (OOP) expenditure. Moreover, BIA reveals that the public subsidies are mostly enjoyed by the relatively better placed patients, both socially and economically. The worse situation is observed for gender related inequality in access and benefit from public subsidies in the state.
Conclusion: Focused policies are required to ensure proper distribution of public subsidies to arrest high OOP expenditure. Drastic change in policy targeting is needed to secure equity without compromising efficiency.
Keywords: Access to Hospitalization Care, Universal Health Coverage (UHC), Inequity, Utilization of Healthcare Services, Benefit Incidence Analysis (BIA)
Copyright: © 2015 by Kerman University of Medical Sciences
Citation: Bose M, Dutta A. Inequity in hospitalization care: a study on utilization of healthcare services in West Bengal, India. Int J Health Policy Manag 2015; 4: 29–38.doi: 10.15171/ijhpm.2015.05
*Correspondence to:
Montu Bose
Email: monbose@gmail.com Article History:
Received: 15 July 2014 Accepted: 18 December 2014 ePublished: 22 December 2014
Original Article
htp://ijhpm.com
Int J Health Policy Manag 2015, 4(1), 29–38 doi10.15171/ijhpm.2015.05
Implications for policy makers
• The high demand for public institutions for inpatients care, especially for the socio-economically disadvantageous groups, as posited by the paper highlights that the state should continue more investment in the sector to offer Universal Health Coverage (UHC).
• However, as most of the patients are forced to purchase other healthcare services like tests and medicines from the market, policies to improve the availability of these services in the public institutions can surely reduce the Out-of-Pocket (OOP) health expenditure in West Bengal (WB). • Given the situation that most of the public subsidy is extracted by the socio-economically better-off sections, regular governance of the
distribution of public subsidies can bring lot of changes in the equity scenario.
• Considering the miserable scenario in the state in terms of incidence of access to healthcare facilities and benefits across gender, targeted policies for females can ensure equitable access and benefits derived from different healthcare services.
Implications for public
The study shows that utilization of public healthcare facilities for hospitalization is pretty high in West Bengal (WB). Moreover, it is observed that socio-economically disadvantageous people are utilizing the public inpatient care in a significant manner. However, on the flip side, unavailability of other healthcare services during hospitalization compels the patients to purchase these services from the market and leads to high Out-of-Pocket (OOP) expenditure. Additionally, socio-economically weaker patients who have access to the healthcare services, fail to enjoy enough subsidy benefits provided by the state. The analysis across gender suggests that females are in the most vulnerable position regarding healthcare equity in access and subsidy benefits.
Introduction
At the policy level, India has initiated the Universal Health Coverage (UHC) in the 12th Five Year Plan (2012–7) based on
the recommendation of the High Level Expert Group (HLEG). The policy ensures ‘equitable access for all Indian citizens’ (1). It requires the provision of accessible necessary services for the population without imposing any unaffordable burden on individual or households (2). More specifically, healthcare services should be provided with the notion of ‘horizontal equity’, which means that access is dependent on ‘need’ and not on other socio-economic or demographic factors (3). It is planned to redesign financial system to ‘ensure efficient utilization of available resources and better health outcome’ following the method of ‘vertical equity’1.
The earlier National Health Policy document of India (4)
suggests expansion of market-based care for the affording class and subsidized care for the deserving class2 of the society.
Specifically, it identifies a paradigm shift at policy level resulting in market segmentation, whereby public resources were to be used only for the deserving section of the society, while the affording population was expected to purchase medical care services from the private sector. The pro-poor subsidy spending from public is endorsed for its instrumental value in improving the health of the population and so the productivity of the labour force and consequently, economic growth (5). The issue of health should ideally not be looked at as an engine for economic growth or enhancement of social welfare in isolation. Health has a larger implication in enhancing capability and functioning of a person. In fact, it has an enormously wide reach and relevance in human life and freedom as it grips the issues of fairness and justice in social arrangements (6). However, if the rich people use and grab the subsidies in public health facilities for curative care, this deprives the poor people from using those services due to insufficient facilities with public health sector, resulting in partial crowding in. Thus it becomes extremely important for a government to target the subsidies well to cover the poor population with needed timely health interventions. On the other hand, with macroeconomic crises and fiscal austerity in the milieu, India, like most of the developing nations, found herself in the quagmire of limited public investment in healthcare, which resulted in inequality in access, utilization and finance of healthcare. Traditionally, Indian healthcare system is referred to as a mixed system where government and individuals share the burden of healthcare costs. However, the investment of the government for public provisioning of healthcare and finance social insurance in India has been extremely limited and hence Out-of-Pocket (OOP) expenditure by individuals comprise a major part of health finance (7). The public share in total health expenditure has never exceeded 30% in this overtly populous country. Public expenditure on health in India remained stagnant near one percent of GDP till 2010, with an urban-centric policy orientation. Given the insufficient
1.According to vertical equity, people with unequal need should be treated unequally.
2
.
Affording class has been deined as the section of the society who can bear the health expenditure without serious consequence or adverse effect. Here we denote deserving class as the inancially weaker sections of the society who needs inancial assistance to meet their healthcare needs.public provision and finance, it is thus crucial to identify the nature of access as well as the distribution of benefits from public subsidies in a typical developing country setting. West Bengal (WB), a middle-income state in the eastern region of India is a medium performer in terms of health, with fourth lowest infant mortality and full vaccination coverage above the national average (8). It has the oldest and probably the largest public health and hospital-based healthcare delivery infrastructure and network among the states of India
(9). Census of India (10) pointed out that WB is home to a significantly higher share of socially disadvantageous groups than the Indian average. According to NSSO (11), over 27% of the population still lived below the poverty line and more than 70% of the hospitalized seek treatment in government run hospitals (against the national average of 40%). However, nearly 30% of the households have to incur catastrophic health expenditure, spending more than 40% of their annual income on healthcare in the state. Therefore, it will be interesting to study the causes of high OOP expenditure even in the public sector hospitals. The state has also implemented the UHC policy to provide better healthcare services of its citizen3. To
establish a system of UHC, 12th Five Year Plan strategy has
focused on different parts of the country to ‘prevent, detect and manage each of the unique challenges’. In this backdrop, the objectives of this present study are:
• To analyze the utilization pattern of hospitalization in public run hospitals across different socio-economic and demographic classes in the state. It will capture the picture of horizontal equity in the state and;
• To investigate the distribution of public subsidies enjoyed by these classes giving an indicator of vertical equity. An attempt has been made to find out the utilization and benefits incidence of different services provided to the inpatients of different socio-economic groups. Creating just access to hospitalization does not necessarily offer coverage from huge OOP expenditure. Purchasing of other healthcare services are important component of OOP health expenditure. NSSO provides information on utilization of and expenditure on different healthcare services like bed, medicine, diagnostic tests, etc. during hospitalization. Analysis has been carried out across these healthcare services to find out the causes of high OOP expenditure even in the public hospitals. More specifically, there has been no study on benefit incidence for separate services categories, which are largely used for hospitalized care. This paper attempts to fill this gap. Access and distribution of public subsidies has been verified from three distinct angles: Monthly Per Capita Expenditure (MPCE) to capture economic class, Social Groups (SG) to represent social classes and sex (SEX) to include demographic factor.
Literature survey
Access to healthcare is a central issue in public health policy and health services research. It is a multidimensional and complex notion. Access to healthcare is defined as the
potential and actual entry of a given individual or population
group into the healthcare delivery system (12,13). Penchansky and Thomas (14) described access as the ‘degree of fit’ between clients and the health system depending up on acceptability, affordability, availability, physical accessibility and accommodation. Access to health services varies significantly with one’s financial position, social affiliation, geographical location and gender. These factors have also been recognized as the important components for national health policies to expand the healthcare services for the poor and socially vulnerable population groups (15). Studies from India portrays the widening gap between the ‘urban and rural’ and the ‘haves and have-nots’ with focus on SG and gender (16–18). There is a clear distinction between access and utilization of healthcare. Access may or may not translate into service utilization, as for various reasons, those in equal need and with equal access may not make equal utilization of services (19). A study by Palmer (20) presents a vast literature on utilization by socio-economic status or other equity-related subgroups. The paper reveals that the poor will receive the poorest quality of care. Wide-ranging package of interventions have been suggested to correct the social inequity in access.
However, gaining access is not synonymous to gaining benefits out of public subsidies. Measuring the benefits of publicly provided goods to individuals is a matter of longstanding concern in the literature. For market-based goods and services, the prices consumers pay can be taken as reflecting underlying values or shadow prices4 and can
be used to yield measures of welfare that can be compared across individuals. When governments subsidize the provision of goods and services like health, education etc. supply is usually rationed and the price paid (if any) does not necessary reflect the shadow price to an individual consumer (5,22). To measure the value to the beneficiaries of government-subsidized goods and services, one can use Benefit Incidence Analysis (BIA) which has been broadly applied in many studies. Public healthcare can be treated as an instrument of poverty alleviation and redistribution policy when redistribution polices are severely impeded by information and administrative constrains. The justifications for public spending depend on the distribution of the benefits from this spending. Therefore the crucial question arises that ‘who is reaping the benefit of this public spending?’ Or does a substantial proportion, even a disproportionate proportion, of the spending go to the socio-economically better-off? These are the questions addressed by the BIA describes the distribution of public subsidies across individuals ranked by their living standards. It is an accounting procedure that seeks to establish who receives how much of the public spending (23).
A recent paper by McIntyre and Ataguba (22) provides detail method of the BIA analysis with a critical review of its limitations. Using data from the VHLSS5 Wagstaff (24)
examined the basic methodology of BIA and its assumptions.
4
.
Shadow price is an imputed valuation of a commodity or service which has no market price. It represents the opportunity cost of producing or consuming a commodity which is generally not traded in the economy. Even in a market economy certain outputs such as health, education do not attract a market price (21).5. Vietnam Household Living Standards Survey, 2006.
The study suggests few more plausible assumptions to calculate the benefit incidence and verify pro-richness and pro-poorness of the subsidy under different assumptions. Another study on the same country by O’Donnell et al.(5)
showed that the inpatient care receives largest share of public spending and how the pro-richness of subsidy to hospital care and total subsidy are raising the absolute gap using BIA and concentration curve analysis. Halasa et al.(25) conducted the BIA for the year 2000 on various data sources of Jordon and demonstrate that the government subsidy in-kind is reaching the poor. To study the distribution of social spending for reduction of poverty and gender inequality in health and education in Kenya, Demery and Gaddis (26) have used BIA in their analysis. Results were pro-poor in nature and the average spending on healthcare and education benefitted the poor more significantly. Glick and Mamisoa (27) did a BIA for Madagascar and found that the disparities lie not only across economic classes but also between rural and urban sector of the economy. Using data from the Living Standards Measurement Survey (LSMS), Castro-Leal et al.(28) did a benefit incidence study of spending on curative healthcare across seven African countries. They found that the richer class accessed publicly funded healthcare considerably more than the poor. Selden and Wasylenko (29) reviewed the literatures on benefit incidence and offer suggestions concerning future research, focusing particular attention on benefit incidence in developing countries.
Studies on India have used National Sample Survey Organization (NSSO) data for their study and found that in terms of curative care and tertiary level hospital services richer section of the society are enjoying more benefits than their poorer counterparts. High state level variation is also observed. A comparative BIA analysis on two India states— Tamil Nadu and Orissa—shows that, for all services in Tamil Nadu public spending has become more pro-poor than before (30–32).
Methods
Data
For the present study, NSSO 60th round data (collected during
January-June 2004) on “Morbidity, HealthCare and the Conditions of the Aged” (25th schedule) has been used. Data
was collected from all Indian states and Union Territories (UTs) through stratified random sampling technique. NSSO provides information on different household level information (like house type, structure, social group, religion, monthly expenditure of household, type of latrine, drainage, etc.) along with the detail individual level characteristics (like age, gender, education, marital status, relation to head of the household, etc.). The survey provides information on inpatient and outpatient healthcare particulars of the individuals along with the cost as well as sources of finances for the services. For the inpatient care the reference period was 365 days. OOP expenditure for hospitalization (inpatient care) is recorded in NSSO along with detail expenditure for bed, medicines6,
diagnostic test, fees for doctors and physiotherapists and other services like blood, food, transport, etc. Information on type
of hospital accessed (public or private) for treatment is also available. In WB, for 60th round NSSO data, the sample size
was 16,111 individual for rural sector and 8,793 individual for the urban sector living in 5,049 households (3,170 rural and 1,879 urban). Present study concentrates on the inpatient care of WB where the relevant size is 1,449 individuals for rural and 895 individuals for urban sector. Sample size for patients hospitalized in public sector health facilities was 1,110 individuals for rural sector and 585 for urban sector.
Socio-economic groups
In NSSO data information on MPCE of the household7 is
also available; it has been used as a proxy for income and financial condition of a family. Due to difference in cost-of-living the MPCE classes in rural and urban areas do not always correspond. However, in each region the total sample is spread over 12 MPCE classes. So, we have clubbed three consecutive classes in each economic sub-stratum and formed four broad group viz. Poorest (P), Lower Middle (LM), Upper Middle (UM) and the Richest (R)8. Four SG have
been reported in NSSO 60th round data viz. Schedule Tribes
(STs), Schedule Casts (SCs), Other Backward Casts (OBCs) and others9. We have clubbed STs, SCs and OBCs as socially
disadvantageous class (officially termed as backward class) and others as general class. Information on five different services accessed by individuals during hospitalization at the public hospitals and dispensaries are recorded in the data. They have been clubbed into four broad categories – Bed (BED), Medicines from hospitals (MED), diagnostic tests (TEST) and Professional care (DOC)10.
Methodology
Utilization of publicly provided healthcare services (like bed, medicine etc.) and the distribution of subsidy benefit among different socio-economic groups can be estimated by the BIA. To estimate benefit incidence, information is needed on the share of group j in the utilization of service i (αij/αi×N/n) and the government’s net expenditure on service i (ρi). Steps to calculate BIA have been well specified in the literature and these steps have been followed for the present analysis. In short, the steps are:
1
.
Using a measure of socio-economic (or demographic) status, population has been ranked from poorest to richest;2
.
Utilization rate of different types of health services has been calculated for each socio-economic group; 3.
Net public subsidy has been calculated for each type ofhealth service for each individual;
4. Each individual’s net public subsidy amount has been weighted by their utilization rate.
7
.
Recall period of one month.8
.
Summary tables for data grouping is reported in the Appendix section.9
.
In the Constitution of India STs, SCs and OBCs have been recognized as the group of historically disadvantaged people. It is well documented in the hierarchical structure of the Indian population that these groups are lagging behind on a range of development outcomes – income, poverty, education, health and so on. Efforts have been made by the government to improve their condition, however, recent studies have shown that they are still lagging far behind compared to the others (33).10. Professional care includes doctor’s/surgeon’s service and physiotherapy.
Mathematically, benefit incidence is estimated by the formula:
( )
i
ij ij
j i
i N n
ρ
η
=∑
α
α
× =∑
θ
ρ
Where, ηj= benefit of public subsidy enjoyed by group j, αij= utilization of service i by group j, αi= utilization of service i by all groups together, ρi= government’s net expenditure on service I, N= total sample size, n= sample size of a particular group and, Ɵij= group j’s share of utilization of service i, (αij/αi×N/n).
Utilization
Access to healthcare services is assessed on the basis of Yes/ No responses available from NSSO data and it has been used to calculate the utilization rate. For each MPCE class (similar method has been followed for the social group and gender) we have counted the number of patients who have accessed a particular service (say diagnostic tests) during hospitalization in public sector (αij). Then the share of a particular MPCE class in utilization of the service has been calculated. To get the utilization rate of the service for each MPCE class (Ɵij) the utilization share has been normalized by their sample proportion in the data.
Public subsidy and benefit incidence
To calculate public subsidy (or expenditure) on inpatient care across rural and urban areas no specific information was available in a readily usable form. We have calculated the ailment11 wise Per Capita Private Expenditure (PCPE) for a
particular service for each MPCE class separately for rural and urban WB. Then, to calculate the net-subsidy (ρi), PCPE for each MPCE and ailment class has been deducted from the OOP expenditure of each patients of the corresponding MPCE and ailment group who have accessed the service during public sector hospitalization. The private expenditure for a healthcare service has been taken as the proxy for the actual cost of the government to provide the service. It is indeed true that costs in public and private sectors may vary. But, the proxy used can be justified from different angles. First, there are different types of private facilities available for hospitalization in the state and prices also differ across regions, ailments and the quality of the services. To normalize the variation in prices analysis has been made using unit level large dataset. Moreover, an attempt has also been made to reduce variation in prices, if exists, by analyzing the data separately for sector, ailment group and MPCE class. Secondly, the aim of this paper is to compare the relative position of the different socio-economic groups in access and benefit of public subsidy distribution. Therefore, some level of over or under estimation of actual amount of public subsidy hardly affect the relative position of different socio-economic classes in subsidy benefit ladder. Finally, apart from the public sector the remaining option available for treatment is the private sector hospitals. Therefore, the difference between the expenditure on services in private and public sector hospitalization is the best available proxy for the shadow price
of subsidy in the public sector. Multiplying the net subsidy (ρi) amount with the initially calculated utilization ratio (Ɵij) we can have the measure of Benefit Incidence (BI) for the service (ηj).
Results
Prevalence of morbidity and access to healthcare
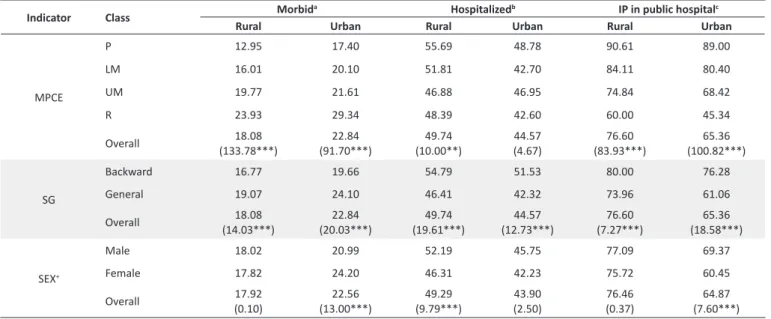
Access to healthcare facilities is an important policy tool for managing healthcare provision and reducing health inequity across different socio-economic groups. Therefore it is crucial to study the prevalence of morbidity across people of different socio-economic background and their accessibility to healthcare institutions, especially publicly funded hospitals during illness. Table 1 reports prevalence of morbidity, access to hospitalization and access to public institutions across three indicators, MPCE, SG and SEX for rural and urban sector separately. Overall reporting of morbidity for the urban sector is higher than the rural sector. But rural hospitalization rate is more than its urban counterpart. Similar picture reflects for hospitalization in public institutions.
Income class wise prevalence of morbidity shows that for each income class urban sector has reported more morbidity compared to the rural sector and there is a positive association between income class and morbidity prevalence, i.e. prevalence rate increases as higher income class is considered for both the sectors. It is observed that for both the regions poorest income class has the maximum hospitalization in the state. Lowest access to hospitals has been counted for upper middle-income class of the rural sector and for the urban areas it was the richest class who has the minimum utilization of the inpatient services. Highest utilization of public institution for hospitalization is undertaken by the poorest class of both rural and urban sector. In both the regions of the state access to public hospitals falls with rising income levels.
Morbidity-prevalence across SG showed higher reporting
by the general class compared to the backward class for both rural and urban areas. However, the hospitalization rate and utilization of public institution for inpatient care is higher for the backward class in both the regions. Morbidity prevalence for the male is higher than the female in the rural sector, whereas, for the urban sector female morbidity is found to be more than the male morbidity. But female of both the regions of the state are experiencing lower hospitalization and access to public institutions during inpatients care.
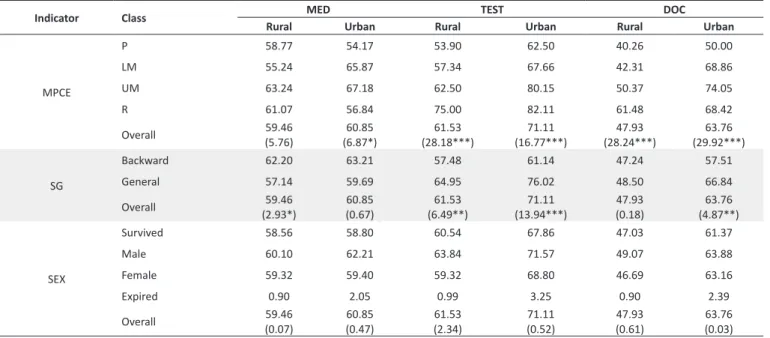
Access to healthcare services
Being admitted as inpatients everyone has an access to BED service; however, it does not necessarily conirm the access to services, like MED, TEST, DOC, etc. Access to other services during hospitalization has been presented in Table 2. Overall access to services is higher for urban sector compared to its rural counterparts for all three services. Overall access ranges from 48% to 62% in rural sector and 61% to 71% in urban sector. In the rural sector, LM (55.24%) has the lowest access to MED followed by the Poorest (58.77%). For other two services (TEST and DOC) in the rural sector and all three services in urban sector, the poorest class has the lowest access among all income classes. Access to services is the maximum either for the UM or for the R and this observation is uniform across both the sectors. Access to MED is the maximum for the backward class in both rural and urban sector (62.20% and 63.21% respectively) compared to their general counterparts. But TEST and DOC for general class (64.95% and 48.50% respectively in rural sector and 76.02% and 66.84% respectively in urban sector) shows higher access than the backward class in both the sectors. Gender speciic access to healthcare services shows that males have the maximum access to all services compared to females in both rural and urban sector.
Table 1. Morbidity prevalence and access to hospital across region in WB (%)
Indicator Class Morbid
a Hospitalizedb IP in public hospitalc
Rural Urban Rural Urban Rural Urban
MPCE
P 12.95 17.40 55.69 48.78 90.61 89.00
LM 16.01 20.10 51.81 42.70 84.11 80.40
UM 19.77 21.61 46.88 46.95 74.84 68.42
R 23.93 29.34 48.39 42.60 60.00 45.34
Overall 18.08
(133.78***) (91.70***)22.84 (10.00**)49.74 (4.67)44.57 (83.93***)76.60 (100.82***)65.36
SG
Backward 16.77 19.66 54.79 51.53 80.00 76.28
General 19.07 24.10 46.41 42.32 73.96 61.06
Overall 18.08
(14.03***) (20.03***)22.84 (19.61***)49.74 (12.73***)44.57 (7.27***)76.60 (18.58***)65.36
SEX+
Male 18.02 20.99 52.19 45.75 77.09 69.37
Female 17.82 24.20 46.31 42.23 75.72 60.45
Overall 17.92
(0.10) (13.00***)22.56 (9.79***)49.29 (2.50)43.90 76.46(0.37) (7.60***)64.87
WB= West Bengal; MPCE= Monthly Per Capita Expenditure; P= Poorest; LM= Lower Middle; UM= Upper Middle; R= Richest; SG= Social Groups; SEX= sex. a Percentage of people morbid (both inpatient and outpatient); b Percentage of people who are admitted to hospitals among the morbid individuals; c Percentage of people hospitalized in public institutions among the inpatients. + Percentages only include those persons who have survived.
Table 2. Access to healthcare services from public institutions during hospitalization (%)
Indicator Class MED TEST DOC
Rural Urban Rural Urban Rural Urban
MPCE
P 58.77 54.17 53.90 62.50 40.26 50.00
LM 55.24 65.87 57.34 67.66 42.31 68.86
UM 63.24 67.18 62.50 80.15 50.37 74.05
R 61.07 56.84 75.00 82.11 61.48 68.42
Overall 59.46
(5.76) (6.87*)60.85 (28.18***)61.53 (16.77***)71.11 (28.24***)47.93 (29.92***)63.76
SG
Backward 62.20 63.21 57.48 61.14 47.24 57.51
General 57.14 59.69 64.95 76.02 48.50 66.84
Overall 59.46
(2.93*) 60.85(0.67) (6.49**)61.53 (13.94***)71.11 (0.18)47.93 (4.87**)63.76
SEX
Survived 58.56 58.80 60.54 67.86 47.03 61.37
Male 60.10 62.21 63.84 71.57 49.07 63.88
Female 59.32 59.40 59.32 68.80 46.69 63.16
Expired 0.90 2.05 0.99 3.25 0.90 2.39
Overall 59.46
(0.07) 60.85(0.47) 61.53(2.34) (0.52)71.11 (0.61)47.93 (0.03)63.76
MPCE= Monthly Per Capita Expenditure; P= Poorest; LM= Lower Middle; UM= Upper Middle; R= Richest; SG= Social Groups; SEX= sex Chi-Square values are in the parenthesis; * Signiicant at ≤ 10%, ** Signiicant at ≤ 5%, *** Signiicant at ≤ 1%.
Source: Analyzed from NSSO 60th round dataset.
Benefit incidence of public subsidy
Table 3 presents the average per-capita benefit-subsidy from four services during hospitalization in public sector. Overall benefits from all services shows that urban sector of the state has higher benefits of public subsidy compared to the rural sector. Overall benefits are the highest for the lower-middle-income class of the rural WB followed by the richest lower-middle-income class and the minimum benefit of public subsidy is observed for the poorest class. Overall benefit is highest for the upper middle class followed by the richest and the lower middle class in the urban WB, whereas poorest class has the lowest share of subsidy benefit. Comparing the service specific per capita subsidy benefit for rural and urban sector of the state, it can be observed that rural sector enjoys more subsidy benefit from MED and TEST compared to the urban counterparts. But for BED and DOC urban sector has higher subsidy benefits than the rural sector. In rural WB per capita benefit ranges from
Rs. 365.77 to Rs. 2,995.81 and in the urban sector the range is between Rs. 219.69 to Rs. 4,382.80.
For BED, richest class has the highest and poorest class has the lowest amount of benefit in both rural and urban sector. Lower middle class of rural WB enjoys the maximum benefit from MED, whereas poorest class has the lowest amount of subsidy followed by the richest income class. Urban WB, on the other hand, shows the highest benefit share for the richest income group and for the poorest it was the minimum for MED. Richest class of both rural and urban WB reaps the maximum benefit from subsidies on TEST. In the rural sector, the lowest amount of subsidy benefit is counted by the upper middle class and poorest class of the urban WB are getting lowest benefit subsidy from TEST. Lower middle and upper middle class of WB has highest benefit share from DOC in rural and urban sector respectively. But for both the sectors poorest class counts for the lowest subsidy benefit from DOC.
Table 3. Per capita beneit-subsidy across types of service, economic class and region (Rs.)
Area MPCE BED MED TEST DOC All
Mean Median Mean Median Mean Median Mean Median Mean Median
Rural
P 673.95 324.86 365.77 241.03 902.38 926.95 546.01 721.04 2798.28 2661.02
LM 1001.47 1007.31 2443.73 2828.01 1055.65 835.79 2995.81 3153.49 7807.92 8423.67
UM 1373.81 1401.42 1031.39 1003.89 685.61 741.15 1775.86 1763.12 5352.12 5487.31
R 1794.45 2044.29 767.77 741.42 1643.90 1438.59 727.98 0.00 6956.61 6086.48
Overall 1208.86 1183.23 1363.58 1102.81 1036.23 853.11 1766.93 1763.12 6126.33 5803.50
Urban
P 865.56 1115.64 219.69 157.15 647.03 493.99 493.69 200.45 2831.71 3058.46
LM 1216.02 1306.06 974.63 876.02 1031.63 763.53 1751.02 1645.04 5256.07 5236.54
UM 1203.19 1570.94 1678.35 1710.61 871.64 1002.03 4382.80 3172.44 8513.90 8411.46
R 1591.09 1431.26 1698.74 1756.40 1132.79 779.33 3431.91 3387.04 8390.82 8058.66
Overall 1248.83 1242.88 1311.10 1497.63 956.52 1006.06 3064.79 2852.47 6728.73 6774.91
MPCE= Monthly Per Capita Expenditure; P= Poorest; LM= Lower Middle; UM= Upper Middle; R= Richest; BED= Bed; MED= Medicines from hospitals; TEST= Diagnostic tests; DOC= Professional care
Mean subsidy benefit amount for some cases are pretty close to their median, indicating negligible intra-class disparity or skewness in the distribution. For example, we can see in the rural sector for BED of the lower middle class, for MED of the upper middle class both the mean and median values are close to each other. Similarly, for some cases there are huge diferences between the mean and median values signifying intra-class diferences in subsidy distribution (e.g. for DOC in rural sector for richest class or for TEST in urban sector for lower middle class).
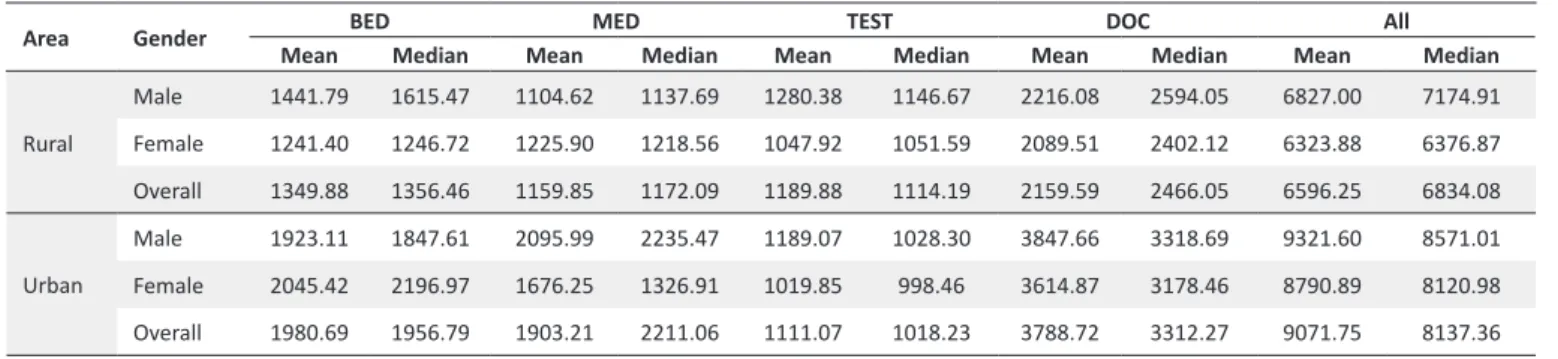
Table 4 presents the social group wise average per capita subsidy beneit during hospitalization in public institutions of WB. Overall beneit for the backward class is higher than the general class in the rural sector, but a reverse scenario is observed in the urban sector. Here most of the subsidy beneit is counted by the general class. For BED general class have the higher subsidy share for both the geographical sectors of the state. A similar pattern is observed for the MED in rural sector, where general class have more subsidy share compared to the backward class. But in the urban sector, the backward class enjoys more subsidy beneit in comparison to its general counterpart. Beneit share for TEST shows that general class reaps higher proportion of subsidy in both the sectors. But for DOC backward class enjoys higher subsidy beneit in the rural areas while general class enjoys more beneit in the urban sector of the state. Subsidy distribution across gender has been reported in Table 5. It can be seen that males of both the regions have more overall subsidy beneits compared to the females. Moreover, males have higher beneits for most of the services in both the sectors. Only for MED in rural sector and for BED in urban sector females have more beneits share
than males.
Discussion
In the present study the NSSO 60th round data collected
from WB in 2004 has been analyzed to study the utilization of healthcare facilities and benefit incidence of public subsidies in WB. It has been observed that due to better information, perception and availability of services, urban sector is reporting more morbidity compared to its rural counterpart. Similarly, people of the higher socio-economic strata report more morbidity due to better perception and knowledge of the diseases. However, the nature of utilization of hospitalization or public institutions that was observed across income class and SG does not replicate the same story across gender in both the sectors of the state. Lack of availability, time and cost of hospitalization puts a barrier to access IP care for the rural females. However, in a recent study on outpatient care of WB, Bose and Dutta (35) have shown that females of both the sectors of the state report higher morbidity compared to the males. It is observed from the present analysis that utilization of public institution for hospitalization is quite impressive across the economic and social classes in WB. In fact, financially and socially weaker sections have the highest access to public sector institutions for hospitalization. This essentially clarifies that the horizontal equity is held in access to hospitalization services in the state. However, the possibility that higher utilization in public sector can be as a result of inability of the poor to access costly private services cannot be denied. Similar results has been found in a study on North Indian states (36).
However, disparity in access across gender is strong for public
Table 4. Per capita beneit-subsidy across types of service, social group and region (Rs.)
Area Social Group BED MED TEST DOC All
Mean Median Mean Median Mean Median Mean Median Mean Median
Rural
Backward 1306.17 1220.24 1063.79 1257.90 999.92 1105.79 2521.42 2652.57 6620.45 7031.52
General 1397.12 1464.80 1147.33 1047.07 1328.44 1166.40 1992.90 2106.16 6560.20 5977.31
Overall 1355.50 1355.13 1107.33 1183.89 1187.99 1108.12 2231.33 2288.89 6587.77 6564.83
Urban
Backward 1360.09 1349.28 2020.93 2011.62 935.94 1097.23 2565.98 2762.20 7323.65 7586.68
General 2072.21 2112.62 1630.31 1660.26 1121.74 1135.09 3671.10 3684.78 8906.68 9203.01
Overall 1837.27 1838.90 1764.17 1680.67 1069.04 1134.02 3342.23 3269.13 8384.42 8619.50
BED= Bed; MED= Medicines from hospitals; TEST= Diagnostic tests; DOC= Professional care Source: Analyzed from NSSO 60th round dataset.
Table 5. Per capita beneit-subsidy across types of service, gender and region (Rs.)
Area Gender BED MED TEST DOC All
Mean Median Mean Median Mean Median Mean Median Mean Median
Rural
Male 1441.79 1615.47 1104.62 1137.69 1280.38 1146.67 2216.08 2594.05 6827.00 7174.91
Female 1241.40 1246.72 1225.90 1218.56 1047.92 1051.59 2089.51 2402.12 6323.88 6376.87
Overall 1349.88 1356.46 1159.85 1172.09 1189.88 1114.19 2159.59 2466.05 6596.25 6834.08
Urban
Male 1923.11 1847.61 2095.99 2235.47 1189.07 1028.30 3847.66 3318.69 9321.60 8571.01
Female 2045.42 2196.97 1676.25 1326.91 1019.85 998.46 3614.87 3178.46 8790.89 8120.98
Overall 1980.69 1956.79 1903.21 2211.06 1111.07 1018.23 3788.72 3312.27 9071.75 8137.36
sector hospitalizations in WB, where males utilize more hospitalization compared to their female counterparts. It is also observable that hospitalization in public institutions does not necessary mean the utilization of other related, but essential, services (like MED, TEST, DOC) during their treatment. Most of the patients are purchasing other services from the market, though they have been admitted in public hospitals. This dependence on the private market for healthcare services leads to huge OOP expenditure during hospitalization even in the public hospitals.
On the other hand, those socio-economically weaker patients who can manage to get an access to other services from the public institutions during hospitalization, fail to reap the benefits of the public subsidies on the services, as most of such benefits are enjoyed by the socially or financially better off strata in the state. This clearly depicts violation of vertical equity in public hospitals in WB. However, the degree of inequity varies across classes and regions; e.g. higher ranges of variation of per capita subsidy in urban areas alludes significantly higher inequity in this area.
In short, the study clearly posits that after introduction of specific policies for offering subsidy benefits to the poorest and most vulnerable class, the state of WB was able to create enough access to hospitalization for them. However, the point of concern lay deeper as access to hospital beds was not enough to create access to subsidize ‘other’ essential services like medicines, doctor’s advice, diagnostic tests etc. This resulted in huge OOP expenditure for hospitalization episodes and the relatively better off people managed to grab most of the benefits of the subsidy, thus directly contradicting the basic policy orientation of the government.
Methodologically, BIA suffers from a number of limitations that should be taken into account when considering the usefulness of the method. Firstly, estimates of benefit incidence often represent average incidence. This means that BIA does not provide information on who benefits or suffers from an expansion or contraction in public spending. Lanjouw and Ravallion (37) and Younger (38) have provided a method to calculate the benefit incidence in these cases (Marginal Benefit Incidence). Secondly, without specifying the model underlying the behavior of either government or the individuals, BIA represents an equilibrium outcome of their decisions. Thirdly, usually implemented BIA does not cover the entire cost of providing public services (e.g. cost of tax administration), including pecuniary and non-pecuniary costs.
Similarly, the present study had some data limitations also. Duration of the 60th round NSSO survey was six months;
therefore, from the data it is not possible to capture any seasonal variation in morbidity. The data has been collected from the households and provides information for the demand side only. However, supply side factors play an important role in healthcare system. The data does not provide any information for those people who are seeking for hospitalization but have no facilities for it or they cannot access it due to financial or other barriers.
In order to correct this inequality and to manage healthcare expenditure in health, policies should be taken to provide
other essential healthcare services during hospitalization in public institutions. Access and benefit of the female
should be considered with utmost seriousness. As medicine constitutes a large share of the total hospitalization cost in the state, availability of the drugs in public hospitals can control the huge OOP expenditure. Proper regulations on pricing of the drugs and supplying the low cost essential medicines can improve the scenario. Few Indian states like Tamil Nadu, Rajasthan have taken policies to provide free essential medicines to all patients in the public sector. WB can also implement similar policies. Recently policies have been taken to provide diagnostic facilities in the public run hospitals on Public-Private Partnership (PPP) basis in WB. It has to be extended in the remote villages to improve the access of diagnostic test facilities by the people of different regions of the state. Inadequacy of trained medical personnel puts a barrier to access their services during ailments, even during hospitalization. Improving the outreach program and increasing the availability of doctors in Sub-Centers (SCs) and Primary Health Centers (PHCs) can change the access scenario. A National Telemedicine Task Force was set up by the Ministry of Health and Family Welfare in the year 2005; extending the telemedicine facilities can help to cover hard-to-reach areas of the state. This program, if successful, will help to ensure better access for those in the remote areas and for those who cannot take a trip to a hospital/dispensary due to high opportunity cost of time and therefore, expected to be especially effective in reducing intra-household gender difference in access.
To provide financial protection against high OOP expenditure, Government of India has introduced National Health Insurance Policy or Rashtriya Swastha Bima Yojana (RSBY). The scheme provides insurance coverage for selected hospitalization in secondary sector hospitals to people below the poverty line (39). Thus a protection against financial risk is provided to the Below Poverty Line (BPL) population. However, in WB only 2.88% of the BPL population is taking advantage of the RSBY scheme, hinting towards low outreach of the program due to inadequate infrastructure in remote areas and/or the presence of high OOP expenditure related to non-medical items not covered under RSBY is imparting detrimental effect.
Conclusion
coverage of different health insurance schemes can arrest high OOP expenditure and change the health scenario of the state. Already some policy changes have been introduced in the state to correct the existing anomalies, whose evaluation in near future is called for.
Acknowledgements
The authors are thankful to Professor Sarmila Banerjee, Rajiv Gandhi Chair Professor of Eco-systems and Sustainable Development, Department of Economics, University of Calcutta for her detailed comments, suggestions and constant encouragement. Thanks also go to the anonymous referees of the journal for constructive suggestions and criticism that contributed significantly in highlighting the core issue and improving the final presentation and treatment. The study is partly funded by a Global Network for Health Equity (GNHE) research scholarship (2013-4).
Ethical issues
The ethical issue was not applicable for this study. This work was sponsored by the Global Network for Health Equity.
Competing interests
The authors declare that they have no competing interests.
Authors’ contributions
MB and AD were involved in the design of the study. MB undertook the study under the supervision of AD. MB wrote the first draft of the paper. AD reviewed and commented on all drafts.
Authors’ affiliations
1Public Health Foundation of India, New Delhi, India. 2Department of Economics,
University of Calcutta, Kolkata, West Bengal, India.
References
1. Planning Commission of India. High Level Expert Group Report on Universal Health Coverage for India; 2011.
2. Harris B, Goudge J, Ataguba JE, McIntyre D, Nxumalo N, Jikwana S, et al. Inequities in access to health care in South
Africa. J Public Health Policy 2011; 32 Suppl 1: S102-23. doi:
10.1057/jphp.2011.35
3. Garcia-Subirats I, Vargas I, Mogollón-Pérez AS, De Paepe P, da Silva MR, Unger JP, et al. Inequities in access to health care
in different health systems: a study in municipalities of central Colombia and north-eastern Brazil. Int J Equity Health 2014; 13:
10. doi: 10.1186/1475-9276-13-10
4. National Health policy of India. Ministry of Health and Family Welfare; 2002.
5. O’Donnell O, Doorslaer EV, Wagstaff A, Lindelow M. Analyzing Health Equity Using Household Survey Data: A Guide to techniques & their Implementation. Washington DC: The World
Bank; 2008.
6. Sen A. Why Health Equity? In: Anand S, Peter F, Sen A, editors.
Public Health, Ethics and Equity. Oxford: Oxford University
Press; 2006.
7. World Health Organization (WHO). World Health Statistics 2014 [internet]. 2014. Available from: http://www.who.int/mediacentre/ news/releases/2014/world-health-statistics-2014/en/
8. The Indian Census. Sample Registration System [internet]. 2013. Available from: http://www.censusindia.gov.in/2011
-common/Sample_Registration_System.html
9. West Bengal State Drug Policy [internet]. 2004. Available from: http://www.wbhealth.gov.in/download/state%20drug%20
policy,%20west%20bengal%20-%202004.pdf
10. Census of India [internet]. 2011. Available from: http:// censusindia.gov.in/Tables_Published/SCST/dh_st_westbengal.
11. National Sample Survey Organization (NSSO) [internet]. Available from: http://mospi.nic.in/Mospi_New/Admin/
publication.aspx
12. Aday LA, Andersen R. A framework for the study of access to medical care. Health Serv Res 1974; 9: 208-20.
13. Kirby JB, Kaneda T. Neighborhood Socioeconomic Disadvantage and Access to Health Care. J Health Soc Behav 2005; 46: 15-31.
doi: 10.1177/002214650504600103
14. Penchansky R, Thomas JW. The concept of access: definition and relationship to consumer satisfaction. Med Care 1981; 19:
127-40. doi: 10.1097/00005650-198102000-00001
15. Davis K. Inequality and Access to Health Care. Milbank Q 1991;
69: 253-73. doi: 10.2307/3350204
16. Dilip TR. Extent of Inequality in Access to Health Care Services in India. CEHAT; 2005.
17. Lingam L. Emergent Issues beyond Equitable Access. Presentation made at Forum 11, Beijing, China, 2007. 18. Sen G, Iyer A. Who gains, who loses and how: leveraging gender
and class intersections to secure health entitlements. Soc Sci Med 2012; 74: 1802-11. doi: 10.1016/j.socscimed.2011.05.035
19. Oliver A, Mossialos E. Equity of access to health care: outlining the foundations for action. J Epidemiol Community Health 2005;
58: 655-8. doi: 10.1136/jech.2003.017731
20. Palmer N. Access and Equity: Evidence on the Extent to Which Health Services Address the Needs of the Poor. In: Bennett S, Gilson L, Mills A, editors. Health, Economic Development and Household Poverty. London: Routledge; 2008. p. 61-74.
21. The MIT Dictionary of Modern Economics. 3rd edition. Cambridge: MIT Press; 1986
22. McIntyre D, Ataguba JE. How to do (or not to do) ... a benefit incidence analysis. Health Policy plan 2011; 26: 174-82. doi:
10.1093/heapol/czq031
23. Bose M. Access to In-Patient Healthcare in West Bengal: A Benefit Incidence Analysis. International Institute for Population Sciences; 2014.
24. Wagstaff A. Benefit-incidence analysis: are government health expenditures more pro-rich than we think? Health Econ 2012;
21: 351-66. doi: 10.1002/hec.1727
25. Halasa Y, Nassar H, Zaky H. Benefit-incidence analysis of government spending on Ministry of Health outpatient services in Jordan. East Mediterr Health J 2010; 16: 467-73.
26. Demery L, Gaddias I. Social Spending, Poverty and Gender Equity in Kenya: A Benefit Incidence Analysis. Kenya: Support
to Public Finance Management Reforms; 2009.
27. Glick P, Razakamanantsoa M. The Distribution of Social Service in Madagascar – 1993-99. Strategies and Analysis for Growth and Access. Working Paper; 2002.
28. Castro-Leal F, Dayton J, Demery L, Mehra K. Public Social Spending in Africa: Do the Poor Benefit? World Bank Res Obs
1999; 14: 49-72. doi: 10.1093/wbro/14.1.49
29. Selden TM, Wasylenko MJ. Benefit Incidence Analysis in Developing Countries, No 1015, Policy Research Working Paper Serie. The World Bank; 1992.
30. Mahal A, Yazbeck AS, Peters DH, Ramanan GN. The Poor and Health Service Use in India. Health, Nutrition and Population (HNP), Discussion Paper; 2001.
31. Chakraborty L, Singh Y, Jacob JF. Public Expenditure Benefit Incidence on Health: Selective Evidence from India. New Delhi:
National Institute of Public Finance and Policy; 2011.
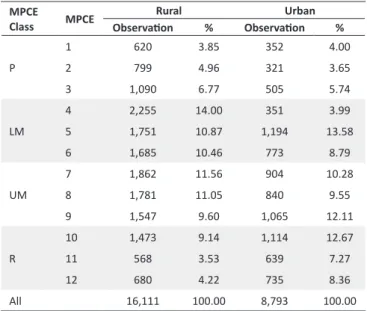
Appendix 1
Table A1. Distribution of sample across MPCE classes and region
MPCE
Class MPCE
Rural Urban
Observaion % Observaion %
P
1 620 3.85 352 4.00
2 799 4.96 321 3.65
3 1,090 6.77 505 5.74
LM
4 2,255 14.00 351 3.99
5 1,751 10.87 1,194 13.58
6 1,685 10.46 773 8.79
UM
7 1,862 11.56 904 10.28
8 1,781 11.05 840 9.55
9 1,547 9.60 1,065 12.11
R
10 1,473 9.14 1,114 12.67
11 568 3.53 639 7.27
12 680 4.22 735 8.36
All 16,111 100.00 8,793 100.00
MPCE= Monthly Per Capita Expenditure; P= Poorest; LM= Lower Middle; UM= Upper Middle; R= Richest
Table A2. Distribution of sample across gender and region
Gender Rural Urban
Observaion % Observaion %
Male 8,126 50.44 4,488 51.04
Female 7,985 49.56 4,305 48.96
All 16,111 100.00 8,793 100.00
Table A3. Distribution of sample across social group and region
Class Social Group
Rural Urban
Observaion % Observaion %
Backward
ST 1,237 7.68 146 1.66
SC 4,790 29.73 1,909 21.71
OBC 884 5.49 443 5.04
General Others 9,200 57.10 6,295 71.59
All 16,111 100.00 8,793 100.00
ST= Schedule Tribe; SC= Schedule Cast; OBC= Other Backward Cast
Analysis in Tamil Nadu and Orissa. CREHS; 2011.
33. Thorat S, Dubey A. Has Growth been Socially Inclusive during 1993-94 – 2009-10? Economic & Political Weekly [Serial on
the internet]. [updated March 2012]. Available from: http:// www.epw.in/special-articles/has
-growth-been-socially-inclusive-during-1993-94-2009-10.html
34. World Bank. World Development Report: Investing in Health.
New York: Oxford University Press; 1993.
35. Bose M, Dutta A. Access to Non-hospitalization Care in West Bengal: A Demand-side Assessment Based on NSS Data. Indian Journal of Human Development 2014: forthcoming.
36. Prinja S, Kanavos P, Kumar R. Health care inequities in north India: role of public sector in universalizing health care. Indian J Med Res 2012; 136: 421-31.
37. Lanjouw P, Ravallion M. Benefit incidence, public spending reforms, and the timing of program capture. World Bank Econ Rev 1999: 13: 257-73.
38. Younger SD. Benefits on the Margin: Observations on Marginal Benefit Incidence. World Bank Econ Rev 2003: 17: 89-106.
39. Shahrawat R, Rao KD. Insured yet Vulnerable: Out-of-Pocket Payments and India’s Poor. Health Policy Plan 2012; 27: 213-21.