Claudiu CICEA1 Cristian BUŞU2
ABSTRACT
A well known truth to both the experts and the population states that health should be seen as an investment too in the most important factor of production, the human factor. In the following paper we analyzed the economic efficiency in the sanitary field using some specific indicators such as net present value, internal rate of return, cost/ benefit ratio.
KEYWORDS: efficiency, health care, internal rate of return, net present value.
JEL CLASSIFICATION: C60, I10, I15.
INTRODUCTION
The concept of "human capital" had over time many meanings. Organization for Economic Cooperation and Development (OECD) considers human capital as "knowledge, skills, competencies and other attributes held by individuals and which have relevance to economic activity" (OECD, 1998). Investors in human capital are composed of individuals, families, society and private organizations. Each player spends time and financial resources in order to obtain a reward, in a quantifiable form (profit or additional income) or as non-quantifiable form (social status, individual wealth etc.). Unlike the economic sphere, the investor in human capital may not be the owner of this "asset" which is subject of that investment. Thus, the society as a whole or a private company are investing in health, while
the investment’s owner is an individual that can "use" the result of this investment
(reflected in his state of health) in another company (abroad) or in other private company.
Following this way of looking at health, to assess the efficiency of this work we use the methodology and the classical instruments of feasibility studies (especially cost - benefit analysis). We make from the beginning two fundamental explanations for the entire study:
whatever the results of this analysis, health remains the most valuable asset of any individual, regardless of cost and effort to get it (Donatelle, 2008). In this paper we want only to discover if, in addition to this fundamental truth, the work in the sanitary field
is "efficient" strictly from the economic point of view (or "profitable”), both for individuals
and for society;
in this paper we’ll make a clear distinction between cost - effectiveness analysis used in sanitary field, considered in the past by several authors (Gold et al., 1996; Jamison, 2002; Musgrove & Fox-Rushby, 2006; Muenning, 2007) and cost-benefit analysis in the economic sense (Boardman et al., 2005; European Commission, 2008). The first of
1
The Bucharest Academy of Economic Studies, Romania, [email protected] 2
these studies the effectiveness by identifying and analyzing, especially, the unquantifiable and non-measurable, in monetary units, effects. (i.e. improving the patient’s health state, a response to a specific medical treatment etc.). The second approach studies the effectiveness of an activity by identifying all effects that can be quantified in monetary form. In what follows we will try to adjust cost - benefit analysis to the specific sanitary field activities.
1. METHODS
Given that information, we’ll determine three indicators specific to cost - benefit analysis, in any investment project:
1. The benefit/cost ratio – is an indicator that allows a comparison between the total effects obtained for the entire duration of the investment and all efforts necessary to realize the investment (Campbell, 2003). To allow comparability of these indicators, which are obtained in different time periods, the discount technique is used. The calculus relation is (Vasilescu et al., 2000):
act act C
V R
h
(1)
where:
R – is the ratio of revenues and total costs at their present value; Vact – present value of total revenues (effects);
Chact– present value of total costs (efforts).
An investment (including that in human factor) can be considered efficient only if R > 1. This relationship expresses the fundamental law of human activity which supposes to fully recover costs incurred and to make a certain profit. This indicator depends on the size of
“a” discounting coefficient that is taken into account (Mishan. & Quah, 2007). The lower the coefficient is, the higher the benefit/cost ratio is, considering the same conditions. 2. The net present value (NPV), an indicator that allows to determine the difference between the total effects obtained for the entire existence period of the investment and total costs (efforts) needed to realize it.
Analytical expression of the indicator net present value (NPV) is as follows (Vasilescu et al., 2000):
act act
Ch
V
NPV
(2)According to this indicator, any investment is considered efficient only if the net present value is greater than zero. This indicator is particularly significant for assessing the efficiency of the investment as in a market economy, we are interested in obtaining a higher profit; this indicator expresses net income or net profit obtained from operating the investment in the entire D period of time.
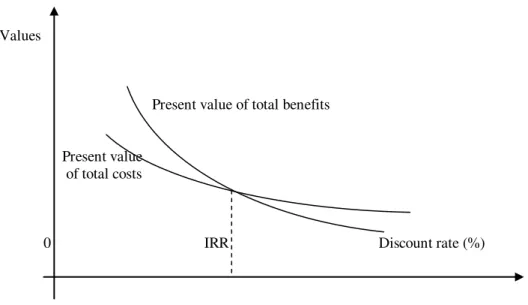
3. The internal rate of return on investment (IRR). The internal rate of return on an investment expresses the discount rate for which total present revenues equals total present costs. In other words, the internal rate of return is the discount rate for which the discounted net revenue is 0.
441 Values
Present value of total benefits
Present value of total costs
0 IRR Discount rate (%)
Figure 1 Evolution of total gross revenues and of production costs at different discount rates
Source: authors
It follows that the internal rate of return is the rate at which the net present value (NPV) is zero (Adler & Posner, 2001).
Applied in the public health sector, the internal rate of return is, to some extent a cost - benefit analysis, meaning that balances on one hand the income that the individual is expected to obtain as a result of the benefit of health services, and on the other hand, the costs of such care. Depending on the level at which the analysis is done, this indicator takes two forms, namely: social internal rate of return (for the analysis of the whole society level)
and individual internal rate of return (for the analysis of the patient’s level).
Using the internal rate of return in the social - cultural field (such as the activity in the sanitary field) has two advantages:
allows comparison with other types of investments, both in the social sphere and especially the economic one;
the internal rate of return is a concept widely understood by all economists, facilitating communication with other areas of social or economic activity.
However, its use has some limitations. The main drawback is that considering benefits it takes into account only monetary income, excluding profits from non-quantifiable sources (Iman et al., 2005), which are numerous in this field and with significant implications in the life of the individual (social status, job satisfaction, etc.).
2. TERMINOLOGY AND HYPOTHESES
The study is based on the fundamental assumption that work in sanitary field is seen as an investment in the most important factor of production, human capital (Gates, 2005). Therefore, to assess the efficiency of this activity we will use the economic instruments of cost-benefit analysis. Consequently, we can define the following hypotheses of rank two:
b) the entire investment process duration is the average time between two consecutive hospitalizations (or the average between two medical interventions of any kind). For Romania, this term is approximated to an average of 60 months (5 years);
c) the term of “realizing the investment“ (d) is the average length of
hospitalization of a patient in Romania. This period in Romania (as well as in all European
Union) is less than 15 days. In calculations we’ll consider that theperiod of “realizing the investment“ is one month, for two reasons: a) first, after discharge, the patient does not return immediately to work and thus does not produce immediate economic effects; b) approximation to a month does not produce relevant distortions regarding the proposed analysis;
d) the “exploitation of investment” (D) is the length between the time of
completion of medical intervention (discharge from hospital) and the moment subjected to a new medical intervention. In Romania, this time is approximated to the value of 59 months;
e) during the d, both the firm and the individual does not record economic effects of monetary nature;
3. RESULTS
Calculations will be made separately for the individual analysis and for the social analysis.
3.1. Social analysis
The first step to be done in order to achieve social analysis refers to the estimates of revenue and expenditure involved by activity in the sanitary field, to the whole society level. In the literature, there are many authors who have examined the issue of assessing the costs and revenues generated by the health system, both at the individual and at the whole society level (Baker, 1998; Phillips, 2005; Mahar, 2006). In what follows we will consider some of these income and expenditure categories, considered significant for analysis, in Romania.
Assessment of revenues:
Undoubtedly, at the company level, the recorded revenues of the company for the public health activity are shown by the value of all goods and services which the person, who has received medical assistance, realizes from the moment she/he was discharged until the next medical intervention of any kind (D = 59 months); this value is difficult, almost impossible to assess. The better approximation is the monthly gross domestic product per capita (Mankiw, 2008).
According to World Bank data (World Bank Report, 2009), the situation of gross domestic product per capita in Romania is as follows:
Table 1. Gross domestic product per capita in Romania
Source: World Bank Report (2009)
443
Table 2. Monthly gross domestic product per capita in Romania
Indicator m.u. 2011 2012 2013 2014 2015
Annual GDP USD 7537.14 7650.2 7803.2 8037.3 8358.79 Percentage of
increase % 0.5% 1.5% 2% 3% 4% Monthly GDP USD 628.095 637.517 650.267 669.775 696.566
Source: authors
Since not all people receiving medical care contribute to gross domestic product (by,
among others, the phenomenon of unemployment), a correction of the company’s income
with the unemployment rate should be made (as GDP). According to International Labor Organization (International Labor Organization Report, 2009) the predicted unemployment
rate in Romania for 2011 is 7.5%. Accordingly, we’ll reduce with this percentage the
monthly GDP among 2011 – 2015, in order to obtain a higher fidelity results.
Another explanation to be made is that not the entire Romanian population needs medical care, within the range of 5 years. From statistics, less than half of the population has undergone a medical intervention (of any kind) in the last five years. In other words, the health system's role in creating the gross domestic product occurred to less than half the population within five years. Accordingly, we will reduce by 50%the monthly gross domestic product per capita (as income indicator for society).
Assessment of costs:
The cost supported by society from following the medical healthcare provided to a person is composed of two components:
a) The cost during the “realization" of the investment (during the medical care). In
turn, it is composed of:
direct cost, noticeable, concerning budget expenditure for medical facilities, for medical staff salaries, for necessary equipment, etc. This cost can be approximated by the state budget expenditure related to the health care system per capita, in the year 2011 (World Bank Report, 2009).
Table 3. Per capita health expenditure
Source: World Bank Report (2009)
Given this statistical evolution and economic situation of Romania in the year 2010, we will consider the level of health spending per capita of 525 dollars for 2011.
b) The cost during the "operating” of the investment (for the entire duration of the “operation” after completion of medical intervention). In general, after a medical
intervention, the patient can return into the system to perform analyses, regular checks, purchase of drugs and others. As a result, society as a whole supports during the
investment’s “operating” period a certain level of spending. This cost can be approximated
by a certain percentage of health expenditure per capita (which in 2011 was projected at 525 dollars). The percentage is considered 50% (in the sense that not all people who have suffered a medical intervention return into the system, and furthermore, do not return each month). Accordingly, for 2011 a level of this monthly cost of 21.875 USD was taken into account, following that for the 2012-2015 period to apply a similar percentage increase in GDP (shown in Table 2)
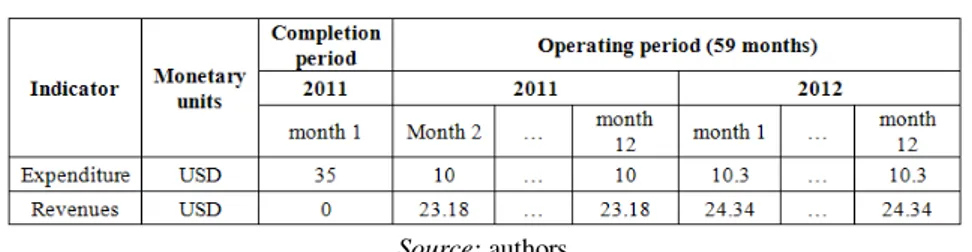
Based on these considerations, the table necessary to calculate the three indicators (the benefit / cost ratio, net present value and internal rate of return) is made up.
Table 4. Expenditure and revenues for 2011 and 2012 operating period
Source: authors
Table 5. Expenditure and revenues for 2013, 2014 and 2015 operating period
Source: authors
In calculations we will use an annual discount rate of 2%, given that Romania is a member of the European Union (Evans D., 2006). This makes use of a monthly discount rate of 0.1652%.
Therefore, we calculate the three indicators of specific cost-benefit analysis.
1. Benefit/cost ratio for social analysis
53 . 10 46 . 1615
57 . 17021 C
V R
act act
S
h
(3)
The indicator expresses that for each dollar total present costs (total present efforts) a total present value of 10.53 USD will be recorded.
2. Net present value for social analysis
USD
h
445 3. Social internal rate of return (SIRR)
% 36 . 80
SIRR (5)
This internal rate of return expresses that, from an economic perspective, the investment in sanitary field has the ability to provide positive net present value till a discount rate of 80.36%.
3.2. Individual analysis
As with social analysis, we must start with estimating revenues and expenditure involved in sanitary system, at the individual level.
Assessment of revenues:
At the individual level, the effects of the public health system are represented by monthly income (salary, dividends, rent) that the person who received medical assistance realizes as soon as it was discharged until the next medical intervention of any kind (D = 59 months). Because the vast majority of revenues are salary, we estimate the effect of the public health system on the individual with the average wage. For the year 2010, this was worth 1836 RON (approximately 573 USD).
For the period 2011 – 2015, we consider a 5% annual growth.
As with social analysis, we must adjust the level of average monthly wage (representing income at the individual level as a result of the public health sector of activity). A first adjustment is due to unemployment; so we will reduce the monthly income for 2011 – 2015 period by 7.5% (representing the unemployment rate forecasted for 2011). The second adjustment refers to the fact that less than 50% of the population require care within five years; therefore, will reduce the monthly income on the 2011-2015 period by 50%.
Assessment of costs:
a) The cost during the “realization period” of the investment (during medical
intervention). This is the direct cost, noticeable, referring to the costs that a patient must bear during medical intervention. Till 2010, this cost was 0, in the public health system.
Since 2011, the Ministry of Health has introduced the “co-payment” system for all medical services rendered to the public. This co-payment is different according to type of required service, starting from 5 lei (about 2 USD) for consultation at family doctor and reaching up to 200 lei (about 60 USD) for complex investigation services (Ministry of Health, 2010).
Therefore, we’ll consider an average value of co-payment of 35 USD.
b) The cost during the “operating period” of the investment (after medical intervention). This cost is very difficult (if not impossible) to assess, meaning the costs that a patient makes, after medical intervention as an exclusive result of it. In some cases, these costs are zero (when the patient no longer needs further treatment), while in other cases the
costs may have significant value. Moreover, the period of costs’ occurrence varies (for
some individuals it may be several months, to others can reach the entire interval of 59 months). Given these issues, in what follows we consider an average cost of 10 USD per month for 2011 and then an annual growth of 3% to the end of the analysis.
Table 6. Expenditure and revenues for 2011 and 2012 operating period
Source: authors
Table 7. Expenditure and revenues for 2013, 2014 and 2015 operating period
Source: authors
As for social analysis, we will use a 2% annual rate of discount, which means a monthly discount rate of 0.1652%. Therefore, we will calculate the three indicators specific to cost-benefit analysis.
1. Benefit/cost ratio for social analysis
27 . 2 32 . 630
73 . 1436 C
V R
act act
I
h
(6)
The indicator expresses that for each 1 USD total present costs (total present efforts) will be recorded total present revenues of 2.27 USD.
2. Net present value for social analysis
USD
h
NPV
I
V
act
C
act
1436
.
73
630
.
32
806
.
4
(7)3. Individual internal rate of return (IIRR)
% 76 . 37
RIRI (8)
This internal rate of return expresses that, from an economic perspective, the investment in healthcare has the ability to provide positive net present value to a discount rate of 37.76%.
CONCLUSIONS
The indicators of social and individual analysis are summarized as follow : The benefit/cost ratio
For social analysis (RS) – 10.53;
447 Net present value
For social analysis (NPVS) – 15406.1 USD;
For individual analysis (NPVI) – 806.4 USD The internal rate of return
social (SIRR) – 80.36%;
individual analysis (IIRR) – 37.76%.
A first conclusion to be drawn by analyzing the values of the six indicators is that investment in human capital (embodied here in the sphere of health services) is efficient. This conclusion is based on the following observations:
the present income/costs ratio is greater than 1, both for social and individual analysis. By default, the net present value is greater than 0 for both types of analysis.
Higher levels of internal rates of return, both for social (80.36%) and for the individual analysis (37.76%) are expressing a high efficiency, well above the average efficiency across the national economy.
Another conclusion that emerges from this calculation made refer to the fact that individual analysis indicators are more unfavorable than indicators of social analysis. This is because the income received by individuals during the period after medical intervention are lower than for an individual analysis than for a social analysis (the difference is similar to the difference between gross domestic product per capita and salary income per capita). A third conclusion that emerges is considering individual analysis. The analyzed variant takes into account an average cost incurred by a patient during medical intervention (represented by co-payment, amounting to 35 USD monthly) and an average cost during the
“operating” period of the investment (a monthly value of 10 USD) . In practice, the value of
these costs varies from one individual to another. In the following we’ll consider two
diametrically opposed versions as follows:
the most favorable variant in economic terms (the patient bears a simple medical intervention with a co-payment of 25 USD without any further expenditure during
the “operating” period of the investment);
the most unfavorable variant from an economic point of view (the patient supports a costly medical intervention, with a co-payment of 150 USD and then monthly support costs are 15 USD).
Between those two extremes variants there are many combinations that may define the situation at a time of a patient. In the following we will determine the individual analysis indicators for the two extreme variants with results as follow:
The benefit/cost ratio – 57.56; Net present value – 1411.77 USD; The internal rate of return – 92.76%. The benefit/cost ratio – 1.44; Net present value – 445.78 USD; The internal rate of return – 5.96%.
Large amount of the revenue expenditure-to-date (as is and the other two indicators) is
explained by the fact that the investment in human capital (both life costs “achieved” investment and “exploitation” of it) are very small.
allowed. Thus, the benefit/cost ratio approaches the unit value, while the individual internal rate of return approaches the reference value of 5%.
As we stated at the beginning of this work, health is the fundamental good of any individual. It is the engine that can generate all other effects that a person can record during its existence; in the same time a lack of it can cause not only a major reduction of individual income, but also the appearance of adverse effects difficult (or impossible) to quantify (depression, altered mental status, etc.). In extreme cases, a neglect of health can mean the disappearance of the individual. Therefore, whatever the results of this study, activity in the health sector (that support the health of the population) should be supported without any restraint.
In this paper we only wanted to apply an economic set of instruments to assess the efficiency from economic sphere to social sphere, considering the financial support of the health system is the most important investment (investment in health, more important than investment in education, culture etc.) into the most important factor of production (human, more important than capital or nature).
ACKNOWLEDGEMENTS
The paper is a dissemination of the scientific results and was cofinanced from the research project PNII - IDEAS no. 789/2009, CNCSIS Code ID_1839, entitled “Social and economic efficiency within public health services, in the connection to the European Community space norms and standards”, project director Claudiu Cicea PhD.
REFERENCES
Adler, M. & Posner, E. (2001). Cost-Benefit Analysis: Economic, Philosophical, and Legal Perspectives, University of Chicago Press Journals
Baker, J. (1998). Activity-Based Costing and Activity-Based Management for Health Care, Aspen Publisher
Boardman, E., Greenberg, D., Vining, A. & Weimer, D. (2005). Cost-benefit analysis: Concepts and Practice, 3rd edition, Prentice Hall
Campbell, H. & Brown, R. (2003). Benefit-Cost Analysis: Financial and Economic Appraisal using Spreadsheets, Cambridge University Press
Donatelle, R. (2008). Health: the Basics, 8th edition, Benjamin Cummings Publishing House
Evans, D. (2006). Social discount rates for the European Union, Dipartimento di Scienze Economiche Aziendale e Statistiche, Italy, Retrieved from http://www.economia.unimi.it European Commission, (2008). Guide to cost-benefit analysis of investment project, Directorate General Regional Policy, Retrieved from http://ec.europa.eu/ regional_policy/sources/docgener/guides/cost/guide2008_en.pdf
Gates, H. (2005). Human capital investment in health: a measurement framework and estimates for the United States, 1952–78, published in The Review of Income and Health, 30 (4), 39-52
Gold, M. R., Siegel, J.E., Russell, L.B. & Weinstein, M.C. (1996). Cost-Effectiveness in Health and Medicine, Oxford University Press, New York
449
International Labor Organization, (2009). International Labor Organization Report, Retrieved from http://laborsta.ilo.org
Jamison, D.T. (2002). Cost-Effectiveness Analysis: Concepts and Applications, Oxford Textbook of Public Health, 4th edition, ed. R. G. Detels, J. McEwen, R. Beaglehole, and H. Tanaka, Oxford University Press,Oxford, U.K. 903–19. Also published as Disease Control Priorities Project Reprint 3.
Mahar, M. (2006). Money-Driven Medicine: The Real Reason Health Care Costs So Much, Collins Publishing House
Mankiw, N. (2008). Principles of Microeconomics, 5th Edition, South Western College Pub Ministry of Health, (2010). Introducerea sistemului de coplată, prin tichetul moderator
pentru sănătate, Comunicat de presă 24.03.2010, Retrieved from http://www.ms.ro/?pag=62&id=8217&pg=1
Mishan, E. & Quah, E. (2007). Cost – benefit analysis, Routledge Publishing House Muenning, P. (2007). Cost-Effectiveness Analysis in Health: A Practical Approach,
Jossey-Bass Publishing House
Musgrove, P. & Fox-Rushby, J. (2006). Cost-Effectiveness Analysis for Priority Setting, Disease Control Priorities in Developing Countries, 2nd edition, chapter 15, International Bank for Reconstruction and Development, Washington
OECD, (1999). Human Capital Investment: An International Comparison, OECD Publishing
Philips, C. (2005). Health Economics: An Introduction for Health Professionals, BMJ Books Publishing House
Vasilescu, I., Românu, I. & Cicea, C. (2000). Investitii, Economica Publishing House, Bucharest