ABSTRACT
Purpose: To compare perceptions of the quality of ophthalmological services offered to outpatients from the public healthcare system to those from the private healthcare system, and to determine which measures are seen as necessary and a priority for improving the quality of care.
Methods: This was a prospective observational study on 200 patients, 101 and 99 of whom were from the public and private healthcare systems, respectively. All patients underwent an ophthalmological examination at an ophthalmology hospital in Belo Horizonte, Minas Gerais, Brazil. Personal interviews were conducted using two structured questionnaires adapted from the modified SERVQUAL scale.
Results: Overall, patients from the private healthcare system were significantly more dissatisfied than those from the public healthcare system. In both systems, reliability was considered to be the most important determinant of quality, and it presented the highest level of dissatisfaction. Satisfaction with the public healthcare system was significantly greater than that with the private healthcare system in terms of the tangibles, reliability, responsiveness, and assurance determinants of the SERVQUAL scale.
Conclusions: Institutions must plan, execute, evaluate, and monitor measures that seek to improve the overall patient satisfaction with the quality of services provided, particularly in the private healthcare system, and special attention must be paid to reliability in both healthcare systems. The identification and monitoring of the quality of healthcare services through the periodic use of the SERVQUAL scale may provide healthcare managers with information so that they can identify, plan, and monitor necessary and priority measures. This could be a key strategy for improving the quality of outpatient health services in the public and private systems.
Keywords: Ophthalmology; Health services; Quality indicators, healthcare; Am-bulatory care; Quality assurance, healthcare
RESUMO
Objetivo: Comparar a percepção da qualidade dos serviços oftalmológicos pres-tado aos pacientes ambulatoriais do sistema público com a do sistema privado e detectar quais ações são percebidas como necessárias e prioritárias para melhorar a qualidade do atendimento.
Métodos: Foi realizado estudo prospectivo observacional de 200 pacientes sendo 101 do sistema público de saúde e 99 do sistema privado submetidos a exame oftalmológico em Hospital Especializado em Oftalmologia (HEO) - Belo Horizonte - MG - Brasil. Realizaram-se entrevistas pessoais, mediante a aplicação de dois questionários estruturados adaptados da escala SERVQUAL modificada.
Resultados: No geral, detectou-se que pacientes do sistema de saúde privado, estão significativamente mais insatisfeitos que aqueles do sistema público de saú de. Em ambos os sistemas a confiabilidade foi considerada o determinante de qualidade mais importante e o que apresentou o maior índice de insatisfação. No sistema público a satisfação foi significativamente superior à do sistema privado a nível dos determinantes da escala SERVQUAL: tangibilidade, confiabilidade, atendimento e segurança.
Conclusões: A instituição deve planejar, executar, avaliar e monitorar ações que bus-quem melhorar a satisfação geral dos pacientes com a qualidade do serviço recebido, principalmente do sistema privado, com atenção especial à confiabilidade nos dois sistemas. A identificação e monitorização da qualidade dos serviços de saúde, em-pregando periodicamente a escala SERVQUAL, poderá fornecer in formações à adminis-tração dos serviços de saúde para que possam detectar, planejar e monitorizar as ações necessárias e prioritárias, podendo funcionar como chave estratégica para o aprimoramento da qualidade dos serviços de saúde ambulatoriais públicos e privados.
Descritores: Oftalmologia; Serviços de Saúde; Indicadores de qualidade em assis tência à saúde; Assistência ambulatorial; Garantia da qualidade dos cuidados de saúde
Quality of the ophthalmological service to outpatients of the public and
private healthcare systems
Qualidade do serviço oftalmológico prestado aos pacientes ambulatoriais dos sistemas de
saúde público e privado
Benigno Vicente SantoS HercoS1,2, adriana BerezoVSky1
Submitted for publication: February 13, 2017 Accepted for publication: June 27, 2017
1 Department of Ophthalmology and Visual Sciences, Escola Paulista de Medicina (EPM), Universidade
Federal de São Paulo (UNIFESP), São Paulo, SP, Brazil.
2 Department of Ophthalmology, School of Medicine, Universidade Federal do Triângulo Mineiro
(UFTM), Uberaba, MG, Brazil.
Funding: No specific financial support was available for this study.
Disclosure of potential conflicts of interest: None of the authors have any potential conflict of interest to disclose.
Corresponding author: Benigno Vicente Santos Hercos. Rua Antares, 145/202 - Belo Horizonte - MG - 30360-110 - Brazil - E-mail: [email protected]
Approved by the following research ethics committee: Universidade Federal de São Paulo (UNI-FESP) (#CAAE: 13986613.0.0000.5505).
INTRODUCTION
The quality of health care has become increasingly important in the medical field. With globalization, consumers are becoming more and more critical of and informed about healthcare services(1).
In developed countries such as the United States, the healthcare system is largely privatized; however, low-income populations and the elderly receive government assistance(2).
In developing countries, the private sector provides a large por-tion of the primary care for low-income patients. Therefore, these care providers play a fundamental role in the improvement of health
outcomes(3). The highly competitive private healthcare sector is under growing pressure to provide a higher quality of care(4).
In Brazil, the public healthcare system is utilized by most of the population. It is one of the largest public healthcare systems in the world, and is the only one to offer comprehensive and free care to the entire population. Public institutions participate in this system, and private institutions are involved in a complement the public healthcare service(2).
expan-sion of the healthcare network and of the necessary infrastructure to support it. This has led to a reduction in the quality of public health services(5). Given this new situation, combined with the incorporation of technological advancements in healthcare, it has become necessary to perform periodic evaluations of healthcare services. These evalua-tions serve as a fundamental incentive for improving professional and organizational practices(6-8).
The quality of service can be defined as the difference between patients’ expectations and their final perceptions(9). Measurement of the quality of care from the patient’s perspective is being increasingly used and accepted in healthcare research(10-12).
The SERVQUAL scale is a market research technique used worldwide to evaluate the quality of service by determining users’ expectations and final perceptions(13). This instrument was developed after conducting many empirical studies in the United States(14,15).
The SERVQUAL scale includes five determinants of the quality of service: tangibles (things that can be touched; such as the appea-rance of the facilities and equipment), reliability (the ability to convey con fidence and rigor in what has been promised), responsiveness (willingness to provide services to clients/patients), assurance (courtesy and knowledge when transmitting information), and empathy (atten-tion and affec(atten-tion in medical-patient rela(atten-tionships)(15).
The objectives of this study were to compare the perceptions of the quality of ophthalmological services offered to outpatients in the public healthcare system to those of the private system using two structured questionnaires adapted from the modified SERVQUAL scale(16), and to determine which measures are seen as necessary and a priority for improving the quality of care at anophthalmic hospital.
METHODS
This study was approved by the Research Ethics Committee of the Ophthalmology Hospital and by the Federal University of São Paulo (UNIFESP) under REC number 256961/2013, and followed the basic principles contained in the Declaration of Helsinki.
Personal interviews were conducted with 200 outpatients using two structured questionnaires adapted from the modified SERVQUAL scale. Overall, 101 and 99 patients were from the public and private healthcare systems, respectively. The patients underwent ophthal-mological examinations at the Specialized Ophthalmology Hospital (HEO) in Belo Horizonte, Minas Gerais, Brazil.
This hospital serves patients from both systems in different wards with similar infrastructures: air-conditioned consultation rooms and large, clean waiting rooms. The waiting time for a consultation is typically longer in the public system. In terms of the hospital staff, there are different teams of administrative and nursing staff for the two systems, and although there are specialist physicians in both systems, medical residents work in the public system only.
These questionnaires were translated into Portuguese and validated in our previous study. These Portuguese versions can be used to evaluate the quality of service through the measurement of expectations and perceptions regarding the critical determinants of quality(15,16).
The inclusion criterion was patients of both sexes (age range: 18-85 years), and the exclusion criteria were patients with mental illness or disorders, as well as patients whose cognitive abilities were substantially reduced according to information obtained from their legal representatives.
Trained interviewers from a specialized company administered the questionnaires to the patients. In special cases such as illiterates, patients with communication difficulties, these patients were helped by their legal representatives.
Before their ophthalmological consultations, the patients answered a series of questions that measured their expectations regarding the care they hoped to receive on a wide range of specific characteristics of the service, to evaluate the five dimensions of quality (Tangibles:
items 1-4, Reliability: items 5-9,Responsiveness: items 10-13, Assurance: items 14-17, and Empathy: items 18-22)(16).
After the consultations, the patients reported their perceptions of the care they received. If the scores assigned to the actual perfor-mance were lower than those assigned to the expectations, i.e., a negative result, it indicated that the perceived quality was lower than expected; the contrary would indicate that the perceived quality was higher than expected, and if the score was close to zero, it meant that the quality was satisfactory.
Within each of the five dimensions, there are several items mea-sured using 7-point rating scales ranging from completely disagree (1 point) to completely agree (7 points). Only the extreme points of each scale were labeled. Another questionnaire was also applied (scoring) to determine the importance of each of the five dimensions of service quality to the respondents.
This information was tabulated and used in both descriptive and statistical analysis. The sample size was calculated using the metho-dology proposed by Fleiss to compare two groups(17). The sample size was calculated in accordance with the power of the test to allow comparison of the perceptions of quality between the public and private systems. It was found that to obtain a level of significance of 5%, this is p<0.05.
For the statistical analysis, indices were created to measure pa-tient satisfaction for each determinant of the SERVQUAL scale. These satisfaction indices were created based on the average difference between the score for the care received (which corresponded to the perceptions of the care received by the patient after the consulta-tion) and the score attributed to the care that the patient considered as ideal (which corresponded to the patient’s expectations before the consultation-i.e., the care that could be considered as the gold standard).
The following formula was used to calculate the users’ satisfaction scores(18):
where Pi is the perception evaluated in question i, Ei is the ideal situation evaluated in question i, and nj is the number of questions belonging to metric j.
The statistical analysis included the bootstrap method, the Kruskal-Wallis test, the Nemenyi test, the Mann-Whitney test, and Spearman’s correlation. The level of significance was set at 5%, this is p<0,05.
RESULTS
Two hundred outpatients, 101 and 99 of whom were from the public and private health systems, respectively, were evaluated. Of the total number of patients (public and private) interviewed, 37% were male and 63% were female; there was no statistical difference between the public and private systems in relation to the distribution by sex.
The mean patient age was 51.01 years (standard deviation: 18.25 years) in the public system and 44.41 years (standard deviation: 16.04 years) in the private system.
Higher levels of education (college or higher) were observed in 5.9% of the public system patients and 50.5% of the private system patients. Illiterate patients and patients who had completed only primary education (up to fourth grade) represented 31.7% and 9.1% of the public and private systems, respectively.
Eighteen of the 23 questions (78.2%) asked of this group received a satisfactory score; conversely, in the private system group, only 5 of the 23 questions (21.7%) asked received a satisfactory score.
The item “The HEO must perform its activities at the scheduled time” received the highest level of dissatisfaction in both groups, and was higher in the private system (-0.96) than in the public system (-0.81).
Public system patients were satisfied or slightly unsatisfied with all of the other items. In the private system, however, substantial dissatisfaction was found with the following item: “The HEO must provide services within the promised timeline” (-0.71).
The analysis of the overall quality of ophthalmological care as perceived by the patients found dissatisfaction in both groups; this dissatisfaction was significantly higher in the private system, with a score of -0.60 (-0.81;-0.4) (mean [95% confidence interval]), than in the public system, which had a score of -0.18 (-0.34;-0.04). There were no characteristics for which satisfaction was higher in the private system than in the public system.
Table 2 shows that private system patients are significantly more unsatisfied with the tangibles, reliability, responsiveness, and assu-rance dimensions of quality.
Reliability was the determinant that had the highest dissatis-faction score in both systems. In the private system, the score for responsiveness (-0.43) also reflected an important level of dissatisfac-tion. Public system patients were found to be satisfied with tangibles, responsiveness, and empathy, but were unsatisfied with assurance and reliability.
Conversely, private system patients were only satisfied with empathy. Patients in the public and private systems were found to
be significantly satisfied and unsatisfied, respectively, with tangibles (public system: 0.06 [-0.06; 0.18], private system: -0.18 [-0.29; -0.07]) and responsiveness (public system: -0.02 [-0.18; 0.14], private system: -0.43 [-0.64; -0.25]) (Table 2). With respect to the “overall satisfaction score,” there was significantly higher dissatisfaction in the private system (-0.59) than in the public system (-0.18).
Table 3 shows that public system patients considered reliability to be the most important determinant (27.03%), whereas private sys-tem patients attributed more importance to reliability (25.03%) and assurance (24.42%). Empathy was the least important determinant for both patient groups.
The Kruskal-Wallis test showed that satisfaction with tangibles was significantly higher (p=0.026) among patients with a higher edu-cation (0.38) than among patients who only completed high school (-0.12) and among illiterate patients (-0.06).
The Mann-Whitney test showed that the importance attributed to the dimensions of quality did not vary significantly between the sexes in either of the systems.
Table 4 shows that satisfaction with tangibles was significantly higher (p=0.010) in the public system (0.06) than in the private sys-tem (-0.18); satisfaction with reliability in the public syssys-tem (-0.28) was significantly higher (p=0.038) than in the private system (-0.58); satisfaction with responsiveness in the public system (-0.02) was significantly higher (p=0.000) than in the private system (-0.43); and satisfaction with assurance was significantly higher (p=0.023) in the public system (0.10) than in the private system (-0.34). The overall satisfaction score demonstrated that patients in the private system were significantly more unsatisfied (p=0.001) than those in the public system.
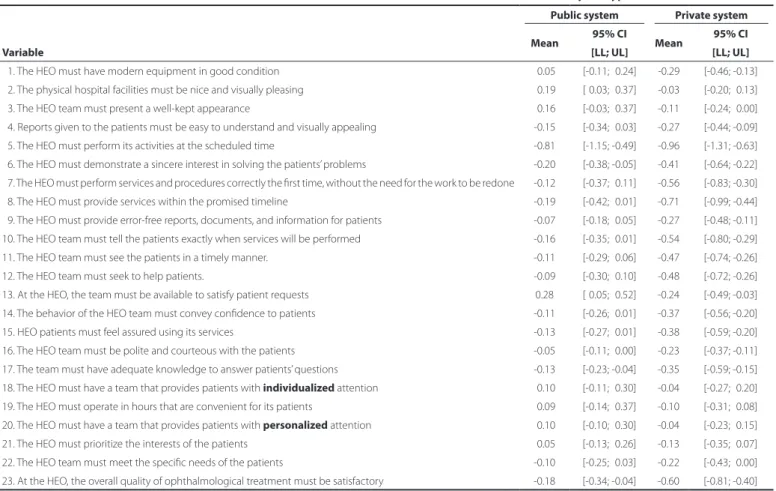
Table 1. Mean and 95% conidence interval of the satisfaction index for all items of the instrument, stratiied by the type of care
Public system Private system
Variable Mean
95% CI
Mean 95% CI
[LL; UL] [LL; UL]
01. The HEO must have modern equipment in good condition -0.05 [-0.11; -0.24] -0.29 [-0.46; -0.13]
02. The physical hospital facilities must be nice and visually pleasing -0.19 [-0.03; -0.37] -0.03 [-0.20; -0.13]
03. The HEO team must present a well-kept appearance -0.16 [-0.03; -0.37] -0.11 [-0.24; -0.00]
04. Reports given to the patients must be easy to understand and visually appealing -0.15 [-0.34; -0.03] -0.27 [-0.44; -0.09]
05. The HEO must perform its activities at the scheduled time -0.81 [-1.15; -0.49] -0.96 [-1.31; -0.63]
06. The HEO must demonstrate a sincere interest in solving the patients’ problems -0.20 [-0.38; -0.05] -0.41 [-0.64; -0.22]
07. The HEO must perform services and procedures correctly the first time, without the need for the work to be redone -0.12 [-0.37; -0.11] -0.56 [-0.83; -0.30]
08. The HEO must provide services within the promised timeline -0.19 [-0.42; -0.01] -0.71 [-0.99; -0.44]
09. The HEO must provide error-free reports, documents, and information for patients -0.07 [-0.18; -0.05] -0.27 [-0.48; -0.11]
10. The HEO team must tell the patients exactly when services will be performed -0.16 [-0.35; -0.01] -0.54 [-0.80; -0.29]
11. The HEO team must see the patients in a timely manner. -0.11 [-0.29; -0.06] -0.47 [-0.74; -0.26]
12. The HEO team must seek to help patients. -0.09 [-0.30; -0.10] -0.48 [-0.72; -0.26]
13. At the HEO, the team must be available to satisfy patient requests 0.28 [-0.05; -0.52] -0.24 [-0.49; -0.03]
14. The behavior of the HEO team must convey confidence to patients -0.11 [-0.26; -0.01] -0.37 [-0.56; -0.20]
15. HEO patients must feel assured using its services -0.13 [-0.27; -0.01] -0.38 [-0.59; -0.20]
16. The HEO team must be polite and courteous with the patients -0.05 [-0.11; -0.00] -0.23 [-0.37; -0.11]
17. The team must have adequate knowledge to answer patients’ questions -0.13 [-0.23; -0.04] -0.35 [-0.59; -0.15]
18. The HEO must have a team that provides patients with individualized attention -0.10 [-0.11; -0.30] -0.04 [-0.27; -0.20]
19. The HEO must operate in hours that are convenient for its patients -0.09 [-0.14; -0.37] -0.10 [-0.31; -0.08]
20. The HEO must have a team that provides patients with personalized attention -0.10 [-0.10; -0.30] -0.04 [-0.23; -0.15]
21. The HEO must prioritize the interests of the patients -0.05 [-0.13; -0.26] -0.13 [-0.35; -0.07]
22. The HEO team must meet the specific needs of the patients -0.10 [-0.25; -0.03] -0.22 [-0.43; -0.00]
23. At the HEO, the overall quality of ophthalmological treatment must be satisfactory -0.18 [-0.34; -0.04] -0.60 [-0.81; -0.40]
The bootstrap method was used for the statistical analysis
We also found that patient satisfaction with reliability in the pri-vate system group was negatively correlated (r=-0.25, p=0.014) with the importance attributed to this determinant, i.e., the greater the importance attributed to reliability, the lower the satisfaction.
DISCUSSION
A strength of this study is the comparison of the quality of services between the two healthcare systems within the same hospital, which helped minimize the influence of external factors.
The results of the present study suggest that patients in the private system of this hospital are significantly more unsatisfied than those in the public system.
In contrast, patients hospitalized in private hospitals are reportedly more satisfied with the quality of service than those hospitalized in public hospitals(19).
The literature on healthcare quality suggests that patients tend to be very generous in their assessments of hospitals, which could be due to a fear of retaliation, gratitude for having survived, or low ex pectations. Institutions should not settle for positive evaluations, but should investigate any causes of dissatisfaction, which is where opportunities for improvement reside.The answers to these questio-nnaires must be analyzed by a decision maker, and specific measures need to be taken to generate results for those involved, both in terms of changes in procedures and rewards for professionals who are com-plimented and/or follow up on complaints(20).
A survey in eye care services reported that the barriers most fre-quently mentioned by respondents who needed but had not received eye care were the cost of consultations and difficulty in accessing the service(21).
After evaluating the quality of ophthalmological services in the public healthcare system in 2006, we found overall dissatisfaction scores that were approximately six times higher than those reported in the current study(16). However, these studies were conducted at diffe-rent institutions and at diffediffe-rent times, which hinders comparisons.
Camilleri and Callaghan reported that negative comments from private hospital patients indicate that these patients are more deman-ding. This factor must be taken into consideration by service providers in private hospitals when developing customized services that aim for patient satisfaction. Unlike the current study, Camilleri and Callaghan reported that both public and private services exceeded patient expectations and that, in Malta, private hospital services are considered to be superior to those provided by the public sector(22). In the private system, we found an overall dissatisfaction rate of 10%, which was lower than the value obtained in a study by Anbori et al. in their evaluation of patient satisfaction and loyalty in a private hospital using the modified SERVQUAL scale(23). This study found of respondents (34.2%) 34.2% of the interviewees reported perceptions of the overall quality of health services that were lower than their expectations. “ This is the quality of health sevices wasn’t satisfactory. These same authors stated that, to be successful, private hospitals must build patient loyalty.
Patient satisfaction is an effective way to achieve client loyalty. If administrators and service providers in the private system know which aspects of service are most important to their patients and if they have the mechanisms to prioritize them and guarantee that they are available, then patient satisfaction and willingness to use the services again will increase(23).
According to Burmester, the focus on loyalty is economically advan-tageous, because it is more expensive to obtain new clients than to maintain current ones. Institutions must be attentive to client expec-tations, to what the competition is doing, and to any new trends(24).
A previous study reported that waiting time is the item that recei-ves the lowest score among public system patients(25).
According to Burmester, criteria such as waiting time for appoint-ments, empathy from doctors or other caregivers, and treatment results
Table 3. Mean and 95% conidence interval for the characterization of subjects regarding the importance given to satisfaction indices stratiied by the type of care
Variable
Public system Private system
Mean
95% CI
Mean
95% CI
[LL; UL] [LL; UL]
Tangibles 18.99 [17.24-20.82] 18.34 [16.90-19.84]
Reliability 27.03 [24.95-29.26] 25.03 [23.33-26.93]
Responsiveness 18.86 [17.33-20.55] 16.87 [15.61-17.98]
Assurance 21.58 [19.65-23.47] 24.42 [22.18-27.03]
Empathy 13.54 [12.36-14.85] 15.33 [14.09-16.56]
The bootstrap method was used for the statistical analysis. CI= confidence interval; UL= upper limit; LL= lower limit.
Table 2. Mean and 95% conidence interval for the characterization of subjects regarding satisfaction indices stratiied by the type of care
Variable
Public system
Private system (insurance + paid)
Mean
95% CI
Mean
95% CI
[LL; UL] [LL; UL]
Tangibles -0.06 [-0.06; -0.18] -0.18 [-0.29; -0.07]
Reliability -0.28 [-0.44; -0.13] -0.58 [-0.80; -0.39]
Responsiveness -0.02 [-0.18; -0.14] -0.43 [-0.64; -0.25]
Assurance -0.10 [-0.19; -0.04] -0.34 [-0.53; -0.18]
Empathy -0.05 [-0.10; -0.18] -0.11 [-0.27; -0.06]
Overall quality -0.18 [-0.34; -0.03] -0.59 [-0.83; -0.40]
The bootstrap method was used for the statistical analysis. CI= confidence interval; UL= upper limit; LL= lower limit.
Table 4. Descriptive measures for the levels of satisfaction in the two types of health services
Variable Service N Mean SS 1ºQ 2ºQ 3ºQ P-value
Tangibles Private system 099 -0.18 0.06 -0.25 0.00 0.00 0.010
Public system 101 -0.06 0.06 -0.00 0.00 0.25
Reliability Private system 099 -0.58 0.11 -0.80 0.00 0.00 0.038
Public system 101 -0.28 0.08 -0.40 0.00 0.00
Responsiveness Private system 99 -0.43 0.10 -0.50 0.00 0.00 0.000
Public system 101 -0.02 0.08 -0.00 0.00 0.00
Assurance Private system 099 -0.34 0.08 -0.38 0.00 0.00 0.023
Public system 101 -0.10 0.04 -0.00 0.00 0.00
Empathy Private system 099 -0.11 0.08 -0.30 0.00 0.20 0.197
Public system 101 -0.05 0.07 -0.00 0.00 0.20
Overall satisfaction Private system 099 -0.60 0.11 -1.00 0.00 0.00 0.001
Public system 101 -0.18 0.08 -0.00 0.00 0.00
The Mann-Whitney test was used for the statistical analysis.
N= number of patients; SS= standard error; 1ºQ= first quartile; 2ºQ= second quartile; 3ºQ= third quartile.
Empathy was considered to be significantly more important (p=0.010) in the private system (15.33) than in the public system (13.54).
that are consistent with patient expectations influence satisfaction and, as a consequence, the economic aspects of the medical practice(24).
Thompson et al. found that the perception of a shorter waiting time than expected was associated with a very positive rate of satis-faction(26).
Our current study is in line with others studies using the SERVQUAL questionnaire and also found a higher level of dissatisfaction with reliability in both the public and private systems(16,27,28).
In addition to reliability, the responsiveness determinant was at an important level of dissatisfaction in the private system; the highest degree of dissatisfaction was reported for the item “The HEO team must tell the patients exactly when services will be performed.” Thompson et al. reported results that corroborate our findings, and they found that supplying this information is correlated with patient satisfaction(26). Empathy was the only determinant for which both groups were satisfied; it was found to be significantly more important in the private system than in the public system.
In their assessment of the quality of private and public hospital care, Camilleri and Callaghan found the most important aspects of the quality of service to be the quality of the technical and professio-nal care and the amount of individual attention given to each patient (personalized service)(22).
In our current study, patients from both systems attributed more importance to reliability, and those from the private system also attri-buted substantial importance to assurance. These results are similar to those of a previous study(29).
In the public system, patient satisfaction with tangibles, reliability, responsiveness, and assurance was statistically higher than that in the private system.
The importance given to reliability in the public system tended to be lower among older patients; it seems that older patients become less demanding and have lower expectations as they age in relation to reliability. Thus, measures that improve reliability are a priority for younger patients in the public sector because they appear to have higher expectations than older patients; the goal is to improve satis-faction with this determinant among these patients.
The importance attributed to assurance and empathy in the pu-blic system and to assurance in the private system tended to increase among older patients; this finding reflects the higher expectations, demanding among older patients and the need to increase the level of satisfaction or decrease the level of dissatisfaction with these de-terminants (assurance and empathy) to meet or even exceed older patients’ expectations.
In the private system, we found that the higher the importance attributed to reliability, the lower the satisfaction with this dimension. This finding suggests that the more importance patients attribute to this determinant, the higher their expectations for the healthcare service provider. The application of the servqual questionnaire may be a rich object of analysis for the companies in general. Ideally, com-panies would offer a level of service that is equivalent or superior to the importance given by the customer(30).
According to Vecina Neto and Malik, responsibility for quality cannot be attributed to a single agent. Quality should always be sought in an organized, collective, and synergetic fashion, unlike what currently occurs in healthcare services(20).
The evaluation, identification, and monitoring of the quality of healthcare services through the periodic use of the SERVQUAL scale may provide system administrators with information that allows them to identify, plan, act upon, and evaluate answers to monitor the necessary and priority measures. This could be a key strategy for improving the quality of outpatient health services in public and private systems.
REFERENCES
1. Bosmans J, Geertzen J, Dijkstra P. Consumer satisfaction with the services of prosthetics and orthotics facilities. Prosthet Orthot Int. 2009;33(1):69-77.
2. Brasil. Ministério da Saúde. Conselho Nacional de Secretários de Saúde.Saúde Suplemen-tar. Saúde Suplementar (Internet). Brasília: CONASS; 2007. [Coleção Progestores-Para entender a gestão do SUS,11]. (citado 2017 abr 4]. Disponível em: http://bvsms.saude. g.,ov.br/bvs/publicacoes/colec_progestores_livro11.pdf.
3. Berendes S, Heywood P, Oliver S, Garner P. Quality of private and public ambulatory health care in low and middle income countries: systematic review of comparative studies. PLoS Med. 201;8(4):e1000433.
4. Zarei A, Arab M, Froushani AR, Rashidian A, Ghazi TS. Service quality of private hospitals: the Iranian patients’ perspective. BMC Health Serv Res. 2012;12(1):31.
5. Nitão SRV. Regulation in Brazil’s Public Health Care System (SUS): The Next Battle [Internet]. Saúde Debate. 1989:24:24-5.
6. Akerman M, Nadanovsky P. Avaliação dos serviços de saúde: avaliar o quê?. Cad Saúde Pública. 1992;8(4):361-5.
7. Lemme AC, Noronha G, Resende JB. A satisfação do usuário em Hospital Universitário. Rev Saúde Pública. 1991;25(1):41-6.
8. Ramos DD, Lima MA. Acesso e acolhimento aos usuários em uma unidade de saúde de Porto Alegre, Rio Grande do Sul, Brasil. Cad Saúde Pública. 2003;19(1):27-34. 9. Parasuraman A, Zeithaml VA, Berry LL. A Conceptual model of service quality and its
implications for future research. J Marketing. 1985;49(4):41-50.
10. Rao KD, Peters DH, Bandeen-Roche K. Towards patient-centered health services in India-a scale to measure patient perceptions of quality. Int J Qual Health Care. 2006; 18(6):414-21.
11. van Duong D, Binns CW, Lee AH, Hipgravc DB. Measuring client-perceived quality of maternity services in rural Vietnam. Int J Qual Health Care. 2004;16(6):447-52. 12. Lin HC, Sudha X, Laditka JN. Perceptions of service quality in group versus solo practice
clinics. Int J Qual Health Care. 2004;16(6):437-45.
13. Lim PC, Tang NK. A study of patients’ expectations and satisfaction in Singapore hospitals. Int J Health Care Qual Assur Inc Leadersh Health Serv. 2000;13(6-7):290-9. 14. Parasuraman A, Berry LL, Zeithaml VA. Refinement and reassessment of the SERVQUAL
scale. J Retail. 1991;67(4):420-47.
15. Parasuraman A, Zeithaml VA, Berry LL. SERVQUAL: A multiple-item scale for measuring consumer perceptions of service quality. J Retail. 1988;64(1):12-39.
16. Hercos BVS, Berezovsky A. Qualidade do serviço oftalmológico prestado aos pacien-tes ambulatoriais do Sistema Único de Saúde-SUS. Arq Bras Oftalmol. 2006;69(2):213-9. 17. Fleiss JL. The design and analysis of clinical experiments. New York: Wiley & Sons; 1986. 18. Marchetti RZ, Prado PH. Um tour pelas medidas de satisfação do consumidor). RAE
Rev Adm Empresas FGV. 2001;41(4):56-67.
19. Taner T, Antony J. Comparing public and private hospital care service quality in Turkey. Int J Health Care Qual Assur Inc Leadersh Health Serv. 2006;19(2-3):i-x.
20. Vecina Neto G, Malik AM. Fronteiras da assistência à saúde. In: Vecina NG, Malik AM. Gestão em saúde. Rio de Janeiro: Guanabara Koogan; 2012. Part: 4; p. 325-8. 21. Pereira JM, Salomão SR, Cinoto RW, Werneck R, Mendieta L, Sacai PY, et al. Avaliação
dos serviços de assistência ocular em população urbana de baixa renda da cidade de São Paulo-Brasil. Arq Bras Oftalmol. 2009;72(3):332-40.
22. Camilleri D, Callaghan M. Comparing public and private hospital care service quality. Int J Health Care Qual Assur. 1998;11(4):127-33.
23. Anbori A, Ghani SN, Yadav H, Daher AM, SU TT. Patient satisfaction and loyalty to the private hospitals in Sana’a, Yemen. Int J Qual Health Care. 2010;22(4):310-5. 24. Burmester H. Gestão da qualidade hospitalar. 1a ed. São Paulo: Saraiva; 2013. 496 p. 25. Dìaz R. La calidad percibida en la sanidad pública. Rev Calidad Asistencial. 2005;20(1):
35-42.
26. Thompson DA, Yarnold PR, Willians DR, Adams SL. Effects of actual waiting time, perceived waiting time, information delivery, and expressive quality on patient satisfaction in the emergency department. Ann Emerg Med. 1996;28(6):657-65. 27. Casalino-Carpio GE. Calidad de servicio de la consulta externa de Medicina Interna de
un hospital general de Lima mediante la encuesta Servqual. Rev Soc Peru Med Intern. 2008;21(4):143-52.
28. Mohammadi A, Mohammadi J. Evaluating quality of health services in health centres of Zanjan district of Iran. Indian J Public Health. 2012;56(4):308-13.
29. Youssef FN, Nel D, Bovaird T. Health care quality in NHS hospitals. Int J Health Care Qual Assur. 1996;9(1):15-28.