Abstract— In order to progress in the present-day complex and unpredictable environment, the company must feature abilities of quick response and favorably reposition itself on the market. Acquisition and preservation of this capacity is the most difficult step for companies as it involves many endogenous and exogenous factors and the process is continuous, dynamic and hardly predictable. The paper goal is a new approach of the manufacturing systems - market assembly, with a view to finding the quantities that characterizes it, the laws that govern it, the relationships that describe it, and on this basis, to design a competitive management system of the assembly as a whole. The approach is general, but the application is focused on the manufacture of mechanical products, in small and medium series, always taking into account the dynamics of the interaction factors such as capital, market and system.
Index Terms—behavioral modeling, cost estimation, product time, manufacturing system.
I. INTRODUCTION
The system environment provides on-line data on the actions undertaken which, properly analyzed and correlated, will further generate solutions in order to develop said system and make it competitive.
The paper aims, in the field of manufacturing technologies, at approaching issues of manufacturing systems, in order to develop a new concept of management, which is in line with the current market dynamics.
The dynamic changes and the overall progress of society are reflected at company level by many orders in number, small in volume, very diverse, obtained through frequent auctions with short - term response, which leaves no time for a relevant analysis of said orders [1].
To be competitive, enterprise should be able to produce a variety of components at law costs and in a short time. In order to achieve this goal, during the negotiation process, the manager based on the product time and cost estimation has to decide quickly and correctly if the order is competitive. It is very important in winning an order if the response time requested by the client is short. A slow response can
Manuscript received March 4, 2011. This work was supported in part by the Romanian Ministry of Education, Research and Youth through Grant PN-II-ID-795/2008.
L. Daschievici, is with the Machining Manufacturing Department, “Dunarea de Jos” University of Galati, Romania (0403961527, fax: 0403961527; e-mail: [email protected]).
D. Ghelase is with the Machining Manufacturing Department, “Dunarea de Jos” University of Galati, Romania (e-mail: [email protected]) .
C. Falticeanu is with the Machining Manufacturing Department, “Dunarea de Jos” University of Galati, Romania (e-mail: [email protected]).
determine losing the order because the client may choose the offer from another competitor that submits a quotation faster. The cost estimation is used in price determination. If the price estimation is less than product cost then can be financial losses for the enterprise. On the other hand, if the price estimation is much higher than the product cost it is possible that the client to place his order with another company that offers a better price. The product time estimation is used to determine the date of the delivery. It is known that any delays in the product delivery can lead to financial loss.
The classification of the different methods and estimation models used to obtain a reliable quotation is presented in [6] as follows:
1) qualitative estimation methods; 2) quantitative estimation methods.
The study [6], that is a review of the different types of the product cost estimation, concludes that qualitative estimation methods are based on the analysis of the new product as compared to products developed previously. On the other hand, quantitative estimation methods are based on the analysis of detailed product design, its features and manufacturing process.
Qualitative estimation methods include:
a) Intuitive methods- based on the use of previous experience. Of them can be observed: Case-based methodology; Decision support systems;
b) Analogical methods- based on the similarity between the new product and past cases. These methods can be classified as: Regression analysis; artificial neural networks.
Qualitative estimation methods include:
a) Parametric methods- derived from the application of statistical methods to define the cost as a function of different product variables. These methods provide fast estimation; b) Analytical methods- based on the breakdown of the product into elements. Product cost is calculated as a sum of all of the components. Of these methods that are amongst the most reliable can be cited: Operation-based; Breakdown-based; Tolerance-based; Based on the product feature; ABC method (activity-based-costing).
Note that there is a classification of the traditional estimation methods as:
- Detailed breakdown methods;
- Simplified breakdown method (designed for estimation during the initial design phases);
- Methods based on the technological group (based on similarity);
- ABC method.
Manny researchers [3] consider that the use of a single estimation method is not enough to generate a estimation in the case of the initial phases because of the detailed information they require.
Modeling of the Market-Manufacturing System
Relationship
In this paper it is proposed a product time and cost estimation method taking account the market dynamics and manufacturing system competitiveness, based on the behavioral modeling (term introduced by the authors). The rest of the paper is structured as follows: section 2 presents problem formulation, section 3 describes behavioral modeling method, section 4 contains a case study and section 5 summarizes the main conclusions.
II. PROBLEM FORMULATION
The interaction between the economic environment and the manufacturing system is a major source of knowledge about the economic environment and the manufacturing system themselves. Product prices have a strong informational load.
They inform producers about the economic profit margin that they may receive by producing the products they offer. In determining a price of the product have to know the necessary costs of the product production.
In market economy conditions, a product cost estimation and time for achieving it are problems of concern to any enterprise manager.
The manager of an enterprise is in the situation that has to make a quotation of price for elaborate an offer in order to negotiate. Thus, the question that occurs is: What price must have product to win the auction? For this, manager is obliged to establish a link between task and market in terms of customer requirements.
Manager develops an action of exploiting already knows and an action of exploration in order to choose the better in the future. In order to face these situations, the manager has set specific goals, can realize the different aspects of the economic environment and can make choices after which selects the efficient actions. Result of the actions of an exhibition provides information about how effective was the action.
Consequently, the aim of this paper is the achievement behavioral modeling of the market-manufacturing system relationship to develop the strategic component of the competitive management, thus ensuring extension in time of the current performance.
III. BEHAVIORAL MODELING
By competitive management adaptation takes place of the manufacturing system for the purpose of profit maximization. To achieve adaptation, it is necessary to achieve modeling of the interaction between all elements of manufacturing system - market assembly, which shall be called behavioral modeling from now on.
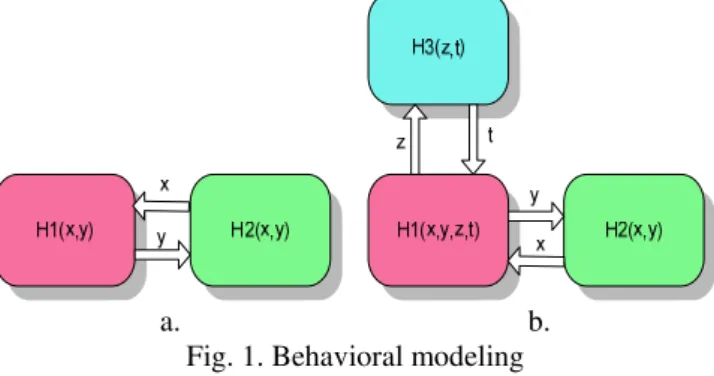
The term of behavioral modeling is introduced by the authors of this paper and, for presenting this notion, we shall consider two elements H1 and H2, which interact with each other (Fig. 1. a). Model H1 of the first element establishes a connection between the input x and output y). If x and y are at the same time input and output of another element, whose model is H2, then the two elements interact with each other.
Modeling their interaction (behavioral modeling) means setting the pairs of values (x, y) which satisfy the transfer functions H1 and H2. The multitude of solutions which satisfy both transfer functions H1 and H2 represent the
behavioral model because they describe the behavior of the elements during their interaction.
For instance, under the theme concerned, H1 could stand for the manufacturing system while H2, for the market .
a. b. Fig. 1. Behavioral modeling
Behavioral modeling becomes increasingly complex as the number of interacting elements is growing too.
For example, in case of Fig. 1.b, three elements interact and behavioral model represents the relationship between the values of x, y, z and t for which the three elements can interact.
The behavioral modeling method of the manufacturing system-market assembly is developed on these assumptions: - elements H1 (manufacturing system) and H2 (market) operate and are monitored on-line;
- during operation, elements H1 and H2 pass through differentstates, that meansthey operate with various values of the state parameters.
For example, H1, the manufacturing system, processes various products with various machining parameters and with various time, materials consumptions. Element H2, market, operate similarly, selling various products with various prices in various supply conditions.
- elements H1 and H2 interact, but not throughout their operation.
The algorithm used for modeling is based on states clustering and consists of following steps [2]:
Step 1: clustering of variables based on the causal relationships;
Step 2: states clustering;
Step 3: building of the mathematical model corresponding to the states cluster and variables cluster set.
Then the causality relationships between parameters are identified. Based on these relationships, clusters of independent variables are established. Further, based on the dataset to be used for the model fitting, a cluster of neighbouring states is made up, at the centre of which is the state to which the respective input data are related. Finally, a linear model whose variables are the variables of one of the clusters of identified variables is fitted on the manufacturing system states cluster. These input data are the ones which have been previously considered in the procedure of enclosing the manufacturing system states cluster.
monitoring the manufacturing system. The states cluster construction implies the using of the 2nd rank Minkowski distance for the classification of states. That is why only the variables representing these input data will be considered in the calculation of Minkowski distance.
Fig. 2. The interaction between task-manufacturing system and between market-task
The states cluster is to be obtained either by restricting the value of the distance or by restricting the number, k, of retained states or using these two conditions. The construction of the mathematical model is made by linear regression. It can be noted that this is a local model, as it is valid only in the vicinity of the state for which the model is interrogated. This model is meant to be used just once as, after the interrogation, it is given up.
In conclusion, the aim of the proposed method is to develop cost estimation for the required product in terms of time required by the customer.
To be sure winning the product auction, the manager must to apply an attractive price.
In determining the price of the product is necessary to know the product cost. Thus, for a specific task required and in imposed time conditions, through modeling are obtained the relations as:
Cost = f(task) (3) Time = f(task) (4) At the same time, the manager must have a model of the product markets by monitoring the auctions.
Auctions provide data on market price quotation. By modeling of market data it obtained a relationship of dependency as:
Market = f(task) (5) The method proposed for achievement of the three models consists of monitoring and recording the relevant state variables of the manufacturing system in a database (fig.2).
IV. STUDY CASE
In today’s economic context, the corporations and the business environment in general are producing data in enormous quantity and on daily basis.
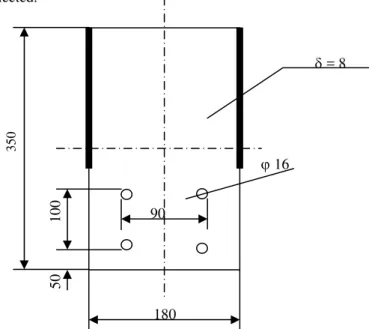
During the experiment data have been collected with regard to the manufacturing machines that had been used for manufacturing some important parts in the construction of dump truck bins, namely the attachment plate of the supplementary chassis of the dump truck bin (fig.3).
Data regarding the actual work times, data referring to the modes of operation, data regarding the amounts of resulted
wastes, data regarding all types of consumption, as well as data regarding the orders for delivered products were collected.
Fig. 3 Attachment plate of the supplementary chassis of the dump truck bin
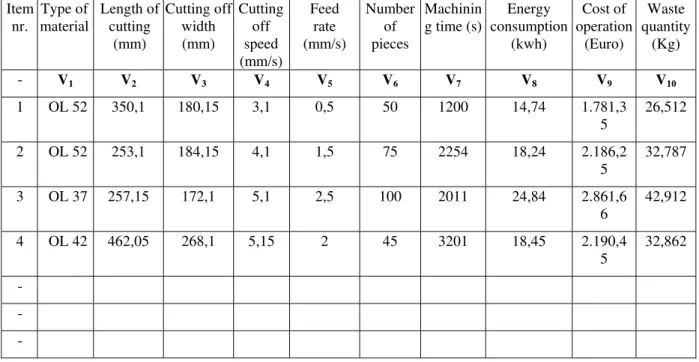
We use the database of a cutting process that has the following parameters: type of the material, length of cutting, cutting width, cutting speed, the advance of cutting, number of pieces, machining time, energy consumption, cost of operation and waste quantity, table 1.
Identification algorithm uses as input data a set of monitored variables, between which it exists an implicit relationship.
In order to succeed in demonstrating the viability of the solution to the problem of product time and cost estimation running of the modeled manufacturing systems, a practical database resulted from process measurements was obviously required.
For this, measuring and monitoring of the cutting process were made, whose results are summarized in the table 1.
Analysis of cluster is a descriptive technique used for grouping similar entities from a data set or equally for entities that present evidence substantial differentiation from the group.
Clustering techniques in clusters is based on algorithms from the neural networks.
Clustering variables consists in grouping variables which are variables in dependence.
Thus using "best NN model”, the choice of many consecutive columns and determination of the best links with the 1, 2 or i variable we determine the cluster of variables which are in the best relationship of dependency.
For example, in table 1, considering the cutting process variables that denote the V1, V2, ..., V10 and using the "best
NN model” facility, results the column V7 - time of cutting, as
the most influential variable in determining the time of operation.
There are the best relationships with dependent columns V2 and V4.
180
350
100
50
= 8
90
Clustering states:
Suppose that the manufacturing system is required to execute an operation that V2 = 150, and V4 = 3, where you
don’t find in our experiment.
Clustering states consists in identifying groups of related records that can be points of departure for further exploration of relationships. In the process of grouping elements is necessary to estimate the minimum distance between those elements with the function:
150
2 3
22 4
d V V (6)
The mathematical model
Mathematically can write a linear relationship: 4
7 2
V a V b V (7) Retaining the first 2 states, so for k = 2 according to k-NN algorithm can be written:
158, 25 1, 2 8201 158, 25 9, 25 8835
a b
a b
(8) which represents a system of two equations with two unknowns. Finding system solutions are obtained the values for a and respectively b which are replaced in the relationship (7) resulting relationship (9).
51, 225 78,75
7 2 5
V V V (9) Linear model so determined will be used in modeling task-time relationship. This is a local and ephemeral model.
Taking the reasoning again we modeled the relationship between task and cost. In this case we found that the influence
variable is variable V8, using "best NN model”. Similarly on
determine:
0,05 1,08
8 2 4
V V V (10) Returning to the our example above, the V2 = 150 and
V4 = 3, it follows the same steps as in modeling of
relationships: task-time and task-cost and obtain a mathematical relationship for model task-market model, taking V9 as the influence variable.
5,78 116,52
9 2 4
V V V (11) In conclusion, if we introduce variations of the process parameters and a variable restriction we can get a table of solutions that will help to find common solutions through negotiation between the customer's requirements and possibilities of economic and technical producer.
V. CONCLUSION
Note that we propose to give managers a model so that they can interact with the economic environment (market). Practically, this happens before the actual work of manufacturing system, so we have to do with a function of anticipation.
The proposed method has the advantage of being applicable to any manufacturing system, regardless the physical nature of the process and the product features.
The method provides the extended modeling of the relationship between manufacturing system- market.
The level of extension is only limited by the number of the monitored state variables.
The level of the modeling accuracy satisfies both the requirements specific to a contract negotiation and the ones specific to the operational management.
Table 1 - Example of experimental data regarding the process variables collected for the cutting off process Item
nr.
Type of material
Length of cutting
(mm)
Cutting off width (mm)
Cutting off speed (mm/s)
Feed rate (mm/s)
Number of pieces
Machinin g time (s)
Energy consumption
(kwh)
Cost of operation
(Euro)
Waste quantity
(Kg)
- V1 V2 V3 V4 V5 V6 V7 V8 V9 V10
1 OL 52 350,1 180,15 3,1 0,5 50 1200 14,74 1.781,3
5
26,512
2 OL 52 253,1 184,15 4,1 1,5 75 2254 18,24 2.186,2
5
32,787
3 OL 37 257,15 172,1 5,1 2,5 100 2011 24,84 2.861,6
6
42,912
4 OL 42 462,05 268,1 5,15 2 45 3201 18,45 2.190,4
5
32,862
-
-
The developed method allows the identification of the variables of one model that represents the relation between the output and the input model.
The proposed method develops cost estimation for the required product in terms of time required by the customer.
ACKNOWLEDGMENT
The authors gratefully acknowledge the financial support of the Romanian Ministry of Education, Research and Youth through grant PN-II-ID-795/2008.
REFERENCES
[1] European Manufacturing Companies Compete: Industrial Competitiveness, Employment and Growth in Europe” in European
Management Journal, Volume 25, Issue 4, 2007, 251-265.
[2] Epureanu A., Buruiana F., Ciuntu S., Susac F., “Algorithm for Economical Characteristics Identification a Machining System”, The
Annals of Dunarea de Jos University of Galati, Fasc. V, ISSN
1221-4566, 2007, 135-139.
[3] H’nida F., Martin P., Vernadat F. „Cost estimation in mechanical production:The Cost Entity approach applied to integrated product engineering”,International Journal of Production Economics, 103, 2006,17-35.
[4] Lerch F.J., Harter D.E., „Cognitive support for real-time dynamic decision making”, Information System Research, 12(1), 2001, 63-82. [5] Wang M,, Wang H., „From process logic to business logic- A cognitive
approach to business management”, Information &Management, 43, 179-193, 2006.