Injection into Light Oil Reservoirs: Potential Application in
Sindh Field
ABDUL HAQUE TUNIO*, HAFEEZ-UR-REHMAN MEMON**, AND SHAHEEN AZIZ***
RECEIVED ON 12.09.2010 D
RECEIVED ON 12.09.2010 D
RECEIVED ON 12.09.2010 D
RECEIVED ON 12.09.2010 D
RECEIVED ON 12.09.2010 DA
A
A
ATED ON 03.01.2011
A
TED ON 03.01.2011
TED ON 03.01.2011
TED ON 03.01.2011
TED ON 03.01.2011
ABSTRACT
Historical experimental work on the combustion oil recovery processes consists of both laboratory and field studies. Although field experiments are the ultimate test of any oil recovery process, they are costly, time consuming and difficult to analyze quantitatively. Laboratory CC (Combustion Cell) experiments are cost effective and less time consuming, but are subject to scaling and interpretation challenges. Experimental set up has been developed to understand air injection process for improving oil recovery from light oil reservoirs taking into account the sand pack petro physical and fluid properties. Some important design problems; operational criteria and considerations important to interpretation of results are pointed out. To replicate subsurface reservoir conditions or pressure and temperature, experiments up to 6895 KPa, at non-isothermal conditions with 5oC/min ramp-up are performed on
unconsolidated cores with reservoir oil samples. Correlations were obtained for low temperature oxidation rate of oil, the fuel deposition rate and the rate of burning fuel as a fuel concentration.
Various parameters such as (sand pack, pressure, oil saturation and flow rate/air flux) were changed to investigate their impact on reaction and chemical nature of the fuel burned. To determine the importance of distribution and pyrolysis on these reactions, the hydrogen-carbon ratio and m-ratio was calculated. For further confirmation Arrhenius graphs were drawn by assuming 1.0 order of reaction with carbon concentration which is also confirmed.
This research will contribute to the overall understanding of air injection process; help to determine the most appropriate IOR (Improved Oil Recovery) technique in the development of the tertiary phase of production in light oil reservoirs in Lower Indus Basin (Sindh) fields.
Key Words: Air Injection, Oil Recovery, Light Oil, Combustion Cell and Oxidation Kinetics.
1.
INTRODUCTION
* Associate Professor, Institute of Petroleum and Natural Gas Engineering, Mehran University of Engineering & Technology, Jamshoro.
** Professor, Institute of Petroleum and Natural Gas Engineering, Mehran University of Engineering & Technology, Jamshoro.
*** Assistant Professor, Department of Chemical Engineering, Mehran University of Engineering and Technology Jamshoro.
I
njection of air into depleted light oil reservoir may be regarded as a new alternative IOR method for both secondary and tertiary processes. Many field andAPPLICATION IN SINDH FIELD
the complex and costly nature of this type of investigation, it is not surprising that no complete theory of the nature of the forward combustion process is yet developed. However, gross effects are well understood and reasonable design procedure is available for planning field operations.
Laboratory combustion tube studies have already yielded important information regarding the combustion process. However, concerning the design, construction and operation of combustion tubes and combustion cells are not available in this region. Combustion tubes and CC used by various investigators vary in size, length and mode of the operation.
Therefore, one purpose of this paper is to present considerations important to the design, construction and operation of combustion cell in order to better understand the air injection process into oil reservoirs particularly for the Lower Indus Basin region. Nelson and McNeil [3-4] have published two comprehensive papers regarding design procedures. Greaves, M., suggested that, large field well spacing provides the more residence time required for complete oxygen utilization [5]. Gordon Moore has observed that, fire flooding of heavy oil deposits is much more displacement process than thermal process [6]. An accelerating rate calorimeter with adiabatic temperature control has also been employed to study oil reactivity [7]. Laboratory experiments and computer simulations show that air injection is feasible for IOR after water flooding in light oil fractured chalk reservoir [8-9]. The air injection project in WBRRU (West Buffalo Red River Unit) has been technically more successful in terms of incremental, quick response and higher production as compared to the water flood project in WBRRU [10].
The air injection LTO (Low Temperature Oxidation) process works by removing the oxygen from the injected air through LTO with oil in the reservoir [11-12]. Unlike in-situ combustion, a stabilized high temperature front, or combustion zone, is not necessary. The LTO reaction is spontaneous and independent of oxygen partial pressure so that complete oxygen consumption can be achieved in
the reservoir. A small amount of oxygen will be left in the oil if there is an insufficient reactive component left to react with the oxygen. The process is quite flexible regarding air injection rate. The only restriction on the air injection rate is to ensure a sufficiently long residence time in the reservoir for complete oxygen removal. This will not present any problem in reservoirs with a fairly long well spacing. In light oil reservoirs, well spacing between injection and production wells is hundreds of feet or meters Greaves, M., et. al. [5, 11].
2.
EXPERIMENTAL SET-UP
Experimental apparatus was constructed in the Institute of Petroleum & Natural Gas Engineering, Mehran University of Engineering and Technology, Jamshoro, Pakistan, for understanding air injection process for depleted light oil reservoirs.
Fig. 1 shows the schematic diagram of the air injection experimental apparatus with GC (Gas Chromatograph). The CC and assembly were enclosed in an angle iron frame 6x4x2 ft. Components mounted in this frame include the pressure shell, and combustion cell with the necessary heating device, temperature processor controller, digital temperature indicator, product separation, recording equipment, thermocouples, pressure regulator, pressure gauges, control valves and high pressure air cylinder.
High-pressure autoclave/reactor detail is presented in Fig. 2. Reactor comprises of a thick wall autoclave made up of 304 stainless steel and has flanges at the bottom of the reactor along with 5.08 cm nut. The reactor has dimensions of 8.255cm OD, 5.715cm ID, 35.56 cm length, and 1.27cm wall thickness designed for a working pressure of 20685 KPa and temperature up to 600-700oC. The reactor
was hydraulically tested up to 34475 KPa.
A thin wall CC made up of stainless steel 316, with
dimensions of 3.81cm OD, 3.175cm ID and 25.4cm length
CC to prevent the sand entering to the production line.
The volume of the combustion cell is 325cm3. Reactor
assembly was fabricated using local vendors of
Hyderabad, Sindh, Pakistan.
In the first series of experiments one electric heater (1.0KW) was wrapped around the top of the reactor to heat the autoclave to simulate reservoir temperature to create ignition in the sand pack. The heater is enclosed in a close muffled type demountable container and controlled by Honey well, PID temperature processor controller. In these experiments two heaters (1.0KW each) were installed; one at the top of high pressure autoclave for the ignition purpose and another at the centre of the autoclave to maintain reservoir conditions of temperature. Finally, three heaters (1.0KW each) were installed; one at the top of the autoclave and another two heaters were installed to cover the full length of the autoclave. A transformer/regulator was installed to
maintain the constant temperature of the heaters. The thermowell of 0.635cm diameter was held in the centre of the CC and contained three chromel-alumel thermocouples of 0.1cm diameter to measure the temperature of the reaction zone at different depth intervals. T1 (Thermocouple-1) was placed in the upper most area of the CC (2.54cm to inlet), T2 (Thermocouple-2) was placed at 12.7cm from top of the CC, and T3 (Thermocouple-3) was placed at 17.78cm from top of the CC. These thermocouples are connected with recorder to record the values of different temperatures i.e. T1), T2 and T3. The upper most thermocouple placed very close to the inlet of CC was used to control the ramp-up temperature through PID controller. At the outlet of the reactor, the pressure transducer was installed and connected to the recorder to record the injection pressure. High pressure and low-pressure separators were installed along with deflector plates at the out let of the reactor with three sieve plates.
AC is Air Cylinder, BP is Baffle Plates, D is Dryer (filled with silica gel), FCV is Flow Control Valve, FM is Flow meter, GC is Gas Chromatograph, GSP is Gas Sampling Point, GT is Glass Tubes (Absorbent), HG is Hydrogen Generator, HPA is High Pressure Autoclave, HP Sep is High Pressure Separator, LP Sep is Low Pressure Separator, NV is Needle Valve, PG is Pressure Gauge, PR is Pressure Regulator, PT is Pressure Transducer, PID is Temperature Processor, R is Relay (PID Type), Re is Recorder/Chromatocorder-12, RE is Recorder/Eco-Graph (Six Pen Paper Less), S is Scrubber (filled with wire mesh), and TI is Temperature Indicator (Digital)
APPLICATION IN SINDH FIELD
GC-1880 was connected with the experimental set-up for the analysis of exhaust gases by injection of 1.0 ml sample with tight gas syringe at the top of the column of injection port, after every 10 minutes, the various peaks of the produced gases were recorded and integrated. Pressure regulator attached at the outlet of the autoclave reduced pressure from 34475 KPa to atmospheric pressure for better separation of fluids and flow rate of effluent gas was controlled by pressure regulator for accurate analysis. However, due to blockage of pressure regulator caused by the oil production from the reactor, the flow of the exhaust gas was not smooth and fluctuated. It varied from 50-200 ml/minute. After few experiments the set-up was modified to avoid the blockage of pressure regulator and to maintain the constant outlet flow. The reduction in pressure to atmospheric level was achieved by large
volume of down stream equipments. Later the pressure regulator was installed at downstream of the high-pressure separator. This maintained the constant flow rate. Regulator needed cleaning with ethanol after 2-3 experiments due to oil accumulation inside it. Equipment was modified and tested upto 12411 KPa. Pressure beyond the regulator was maintained up to 34.5 KPa maximum, which eventually decreased to around 6.895-13.79 KPa at sampling point.
3.
EXPERIMENTAL PROCEDURE
A given weight of the sand was placed in a container and the required weight of the oil added to the sand and mixed with the help of spatula, until the mixture became homogenous. Unconsolidated sand equivalent to the weight of the consolidated core was placed into the combustion cell. The sand mixture impregnated with light oil was packed into the CC using a steel rod with a flat metal plate attached to it to closely pack the mixture. The top of the sand pack was set at 24.1cm from the bottom flange. The clean sand was packed up to the level of the igniter in order to prevent premature cracking reactions with oil in the sand pack. The sand pack properties are presented in Table 1. Packed with the CC, the bottom flange assembly was secured in placed, the cell was inserted in the pressure shell and connected to the inlet gas lines and the outlet production and gas analysis system.
The air was supplied by high-pressure (13652 KPa) cylinder of compressed synthetic air with high-pressure regulator. The inlet gas stream was admitted at the top of the reactor (Vertical), while the exhaust gases were withdrawn from the bottom of the reactor. The injected flow rate of air was controlled by needle valve/flow control valve. Pressure regulator was used to control the pressure of the reactor. Downstream of the regulator produced gases were allowed to flow through the low pressure separator, scrubber and to the sample collection point. After 30 minutes the required pressure was maintained, stabilized and then both the heaters were turned ON. The reactor was heated with a ramp of (5oC/min.) up to the ignition was observed by
change of slope versus time on the recorder The igniter
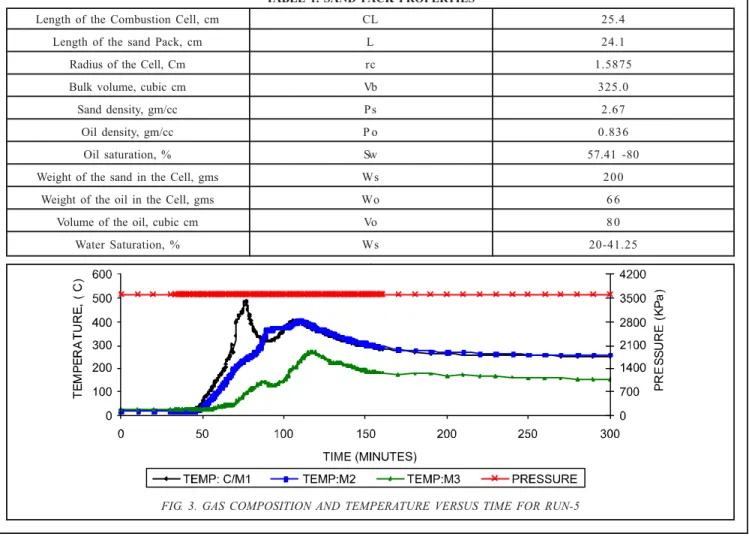
TABLE 1. SAND PACK PROPERTIES
Length of the Combustion Cell, cm CL 25.4 Length of the sand Pack, cm L 24.1 Radius of the Cell, Cm rc 1.5875
Bulk volume, cubic cm Vb 325.0
Sand density, gm/cc Ps 2.67
Oil density, gm/cc P o 0.836
Oil saturation, % Sw 57.41 -80
Weight of the sand in the Cell, gms Ws 200 Weight of the oil in the Cell, gms Wo 6 6
Volume of the oil, cubic cm Vo 8 0 Water Saturation, % Ws 20-41.25
was switch OFF and another heater was used to maintain the reservoir temperature (about 100oC), which was
controlled by transformer/regulator (120V) for the duration of experiments and held constant. Required air flow was established through the pack while the different thermocouples were measuring the temperature at the sand face and also at the different depth intervals of the combustion cell. The ignition could be observed on the temperature recorder by change of slope on the temperature versus time chart. Samples of exhaust gases were analyzed at 10-minute intervals for the entire duration of reaction. For each oxidation run, the CO2, CO, O2 and N2 concentrations in the exhaust gas were determined as function of time. The produced liquid from the high-pressure and low-high-pressure separators was collected after the end of the experiment (Tunio, A.H., [13]).
4.
COMBUSTION CELL TEMPERA
COMBUSTION CELL TEMPERA
COMBUSTION CELL TEMPERA
COMBUSTION CELL TEMPERA
COMBUSTION CELL TEMPERATURE
TURE
TURE
TURE
TURE
PROFILES
PROFILES
PROFILES
PROFILES
PROFILES
The impregnated unconsolidated core sample was placed in a CC which was heated by igniter with a ramp of 5oC/
min. The temperature profiles during the combustion are shown in Fig. 3. A small variation in the peak temperature is noticeable. This is due to rate at which exothermic combustion reaction generated heat as compared with heat losses from the combustion. Heat losses from the combustion zone are the result of conduction through the radial cell wall, combined with axial heat conduction and convection down stream to the steam zone. Little disturbance was`created on the process because of very quick ignition that takes place as shown in Fig. 3. After switching OFF the igniter, the combustion front propagation stabilizes quickly and thereafter continues to
APPLICATION IN SINDH FIELD
maintain constant temperature of about 250oC at the end
of the experiment. The ignition temperature was noted at about 500oCC. Due to movement of the combustion front
from 1st-2nd zone and finally in 3rd zone of the CC, ignition took place and the peak temperatures of both the zones were noted at about 380 and 280oC respectively. The
increasing trend of the average peak temperature with oxygen concentration is shown in Table 2. With air-assisted combustion, the peak temperature is not significantly affected by the increase in pressure, varying from 300-350oC over the pressure range of 2069-3448 KPa
as presented shown in Table 2. One explanation for this is that at higher injection pressures, the distillation rate of volatile components in the steam zone is lower. This means that more fuel is potentially available for combustion. As a consequence, a peak temperature would be expected but the convective heat transport from the CC/zone also increases due to larger fraction of nitrogen in the combustion gases. Thus, when this is combined with the radial heat loss by conduction, the net result is to suppress any increased temperature effect resulting from higher fuel concentration.
5.
PRESENT
PRESENT
PRESENT
PRESENTA
PRESENT
A
ATION AND DISCUS
A
A
TION AND DISCUS
TION AND DISCUS
TION AND DISCUS
TION AND DISCUSSION
SION
SION
SION
SION
OF RESUL
OF RESUL
OF RESUL
OF RESUL
OF RESULTS
TS
TS
TS
TS
The analysis is based on the effluent gas data obtained from the various experiments. The analysis will be quantitative and qualitative description of the general trends observed. Experiments were performed for obtaining useful kinetic data for air injection process for the improved recovery of the light oil. These experiments were conducted so that more reliable and comprehensive data could be obtained for air injection process in the incremental recovery of light oil reservoirs at high pressure and high temperature usually after water flooding. The unconsolidated core (sand pack) with different sand grain size impregnated with light oil was used in this series of experiments.
A total of 50 kinetics runs were made. The parameters that were varied from run to run- included system pressure, rock formation/sand matrix, flow rate (Air flux), oxidation temperature/heat input, and oil and water saturations.
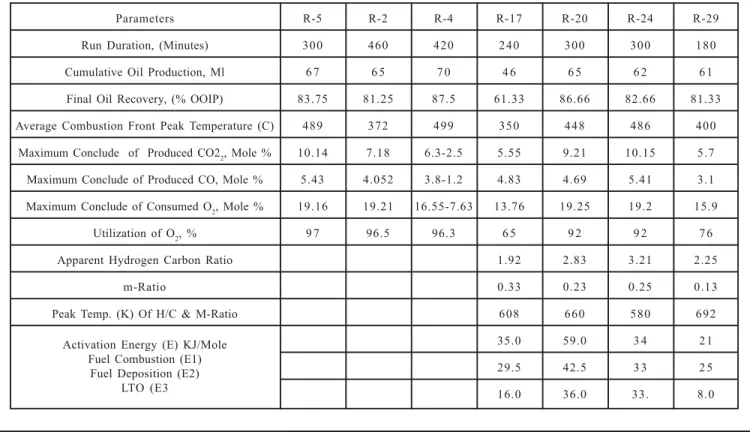
TABLE 2. SUMMARY OF COMBUSTION CELL RESULTS
Parameters R-5 R-2 R-4 R-17 R-20 R-24 R-29 Run Duration, (Minutes) 300 460 420 240 300 300 180 Cumulative Oil Production, Ml 6 7 6 5 7 0 4 6 6 5 6 2 6 1 Final Oil Recovery, (% OOIP) 83.75 81.25 87.5 61.33 86.66 82.66 81.33 Average Combustion Front Peak Temperature (C) 489 372 499 350 448 486 400
Maximum Conclude of Produced CO22, Mole % 10.14 7.18 6.3-2.5 5.55 9.21 10.15 5.7 Maximum Conclude of Produced CO, Mole % 5.43 4.052 3.8-1.2 4.83 4.69 5.41 3.1 Maximum Conclude of Consumed O2, Mole % 19.16 19.21 16.55-7.63 13.76 19.25 19.2 15.9
Utilization of O2, % 9 7 96.5 96.3 6 5 9 2 9 2 7 6
Apparent Hydrogen Carbon Ratio 1.92 2.83 3.21 2.25
m-Ratio 0.33 0.23 0.25 0.13
Peak Temp. (K) Of H/C & M-Ratio 608 660 580 692 35.0 59.0 3 4 2 1 29.5 42.5 3 3 2 5 16.0 36.0 33. 8.0 Activation Energy (E) KJ/Mole
Fuel Combustion (E1) Fuel Deposition (E2)
However, oxygen concentration was kept constant for all the runs. The effect of each parameter upon the oxygen conversion was determined from analysis of the inlet oxygen and exhaust gases, oxygen and carbon oxides. The pressure was varied from 690-11032 KPa; outlet flow rate from 50-500 ml/min at room temperature and atmospheric pressure. These rates correspond to air fluxes ranging from 3.797-37.97 Sm3/m2-hr. At temperature below
100oC, the oxygen conversion was too small to be
satisfactorily used in the quantitative analysis of the kinetic data. The data reported here are for oxidation temperatures above 200oC.
5.1
Effluent Gas Analysis
Fig. 4 represents only one peak that appears in the production of carbon oxides at temperature about 300oC.
In this peak amount of oxygen consumed exceeds that
recovered as carbon oxides gas. Oxygen mole fraction decreasing in the produced gas indicates that the produced reaction gases exhibit an increased amount of CO2 generated gradually displaced the air saturation in the sand pack. The final O2 consumed was less than 2%.
Fig. 5 shows two apparent peaks in the production of carbon oxides at different temperature. This as well as the result of differential Thermal Analysis, confirm the existence of at least two reactions. First peak appears at temperature (around 300oC); the mole fraction of the
oxygen consumption is equal to mole fraction of the produced CO2 and 0.5 CO. But the 2nd peak at high temperature (about 425oC), the O
2 consumption is larger
than CO2 and CO produced. The temperature below 100oC,
some O2 is consumed but no carbon oxides are produced. The first peak at low temperature in the gas concentration graphs corresponds to the oil oxidation however, the small peak corresponds to fuel combustion at high temperatures.
APPLICATION IN SINDH FIELD
Comparing the results presented in Figs. 4-5, it is clear
that the first peak is higher or smaller than the 2nd one,
depending on the rock proerties and crude oil properties.
As shown in Figs. 4-5, the light oil of Badin Oil Field due to its high reactivity with oxygen at low temperature has a
first peak, which is much higher than the second one. In
contrast, for the heavy viscous Wolf Lake Oil, the
combustion peak is much higher than the low temperature
peak. Kazi, R.A., [14], who used 10o API Wolf Lake Oil.
This indicates the propensity of this crude oil for fuel deposition. The produced carbon oxide gases can account
for almost all the oxygen consumed at high temperatures.
Since the production of carbon oxide gases represents
the removal of carbon, the reaction associated with 2nd
peak is controlled by the simultaneous availability of fuel
and O2 at high temperature. The fuel is considered to be
burning when conditions associated with the 2nd peak prevail i.e. the amount of O2 consumed is eventually
balanced by the amount of produced carbon oxide gases.
In this low temperature region the fuel is being oxygenated,
rather than burned; a smoldering rather than burning takes
place.
5.2
Effect of System Pressure
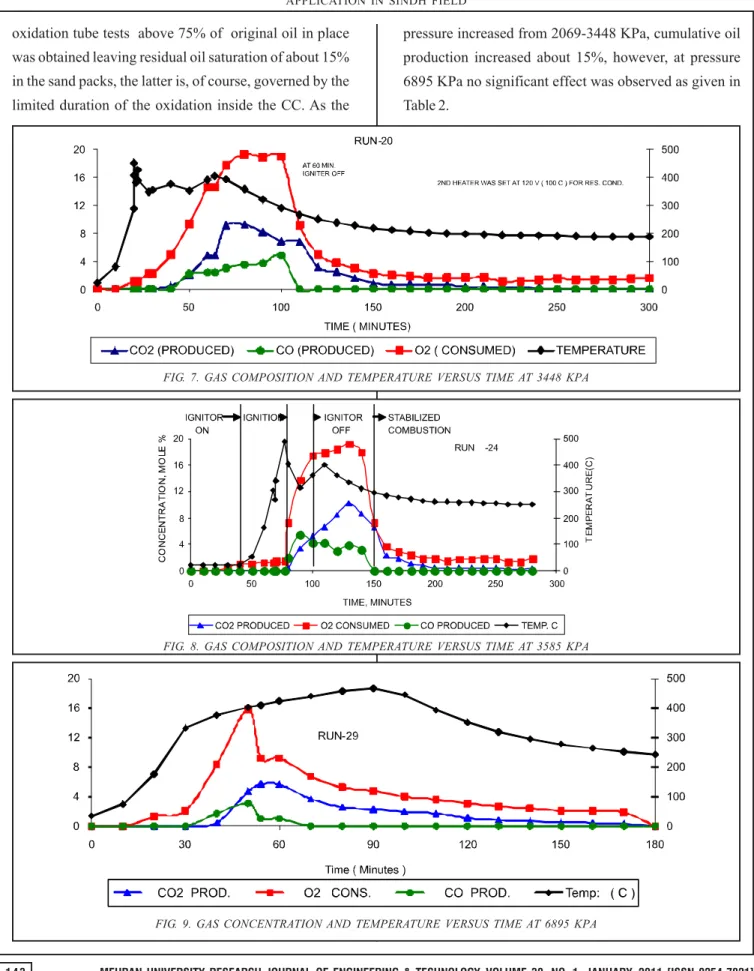
Fig. 6-9 present the gas production rate with operating
pressure as a parameter (Tables 3-4). Fig. 10 presents consumption of oxygen at various pressures. it was
observed that with increasing pressure (6895 KPa) the
reaction rate is low. Although comparing 2069-3448 KPa,
pressure has an identical increase in reaction rate. However, comparing 3448-3585 KPa, pressure has almost an identical
behavior. An observation was made that the carbon
monoxide production seems too early in these experiments
conducted up to 6895 KPa. The rate of CO produced seems unusual than to the rate predicted to this type of reaction
scheme. The possible argument for the high rate of
products at low temperature could be that the light components are reacting with free oxygen available to
large quantity, producing higher amount of carbon oxide,
where as in high pressure of 6895 KPa, the light components are suppressed. The low level of products in
6895 KPa experiment may be due to dilution effect, which
is taking place by large number of moles present in the reactor at increased pressure. One can conclude that the
distribution of the products are inadequate and does not
behave ideally. The main results of experiments are
presented in Table 2.
5.3
Oil Recovery
Recovery of oil is mainly affected by the characteristic of
the oil properties (viscosity, composition and density) and
core properties (permeability, wettability and porosity). It
is affected by air injection rate and amount of residual oil.
The recovery of oil from most of combustion tube/
oxidation tube tests above 75% of original oil in place
was obtained leaving residual oil saturation of about 15%
in the sand packs, the latter is, of course, governed by the
limited duration of the oxidation inside the CC. As the
pressure increased from 2069-3448 KPa, cumulative oil
production increased about 15%, however, at pressure
6895 KPa no significant effect was observed as given in
Table 2.
FIG. 7. GAS COMPOSITION AND TEMPERATURE VERSUS TIME AT 3448 KPA
FIG. 8. GAS COMPOSITION AND TEMPERATURE VERSUS TIME AT 3585 KPA
APPLICATION IN SINDH FIELD
5.4
Apparent Hydrogen Carbon Ratio
Apparent HC (Hydrogen Carbon) ratio which characterizes
oxidation and is indicative of the nature of the fuel being
burned is a useful indicator for a process involving both
simultaneously hydrocarbon and a coke oxidation. The
nature of the fuel changes as the hydrocarbons and coke
are oxidized simultaneously. In most of the runs LTO
reactions were observed. Therefore, the calculations are
based on assumption that 100% was not observed in the
exit gas had reacted from water and have been averaged
to the temperature range of interest (HTO zone). The HC
ratios for these experiments are presented in Fig. 11.
Table 2 presents HC ratio, peak temperature and detailed
results are presented graphically.
Abu-Khamsin, et al., [15] found the distillation of crude
plays an important role in shaping the nature and extent of
the cracking reactions. With extensive distillation they
observed less weight loss due to visbreaking, leaving a
larger oil fraction transforming to coke. When LTO occurs
in unconsolidated formations the heavier residual oil is
produced and visbreaking is more effective leading to larger
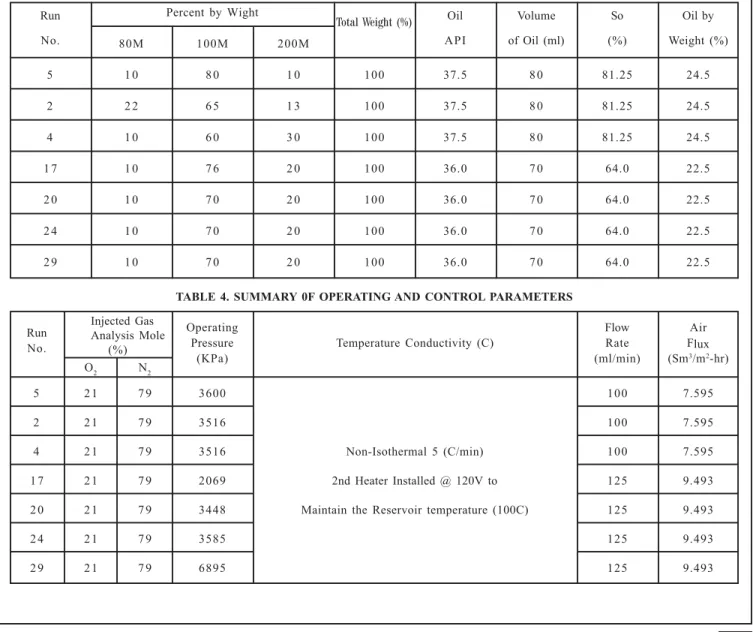
TABLE 4. SUMMARY 0F OPERATING AND CONTROL PARAMETERS
Run
Injected Gas
Operating Flow Air
No.
Analysis Mole
Pressure Temperature Conductivity (C) Rate Flux (%)
(KPa) (ml/min) (Sm3/m2-hr)
O2 N2
5 2 1 7 9 3600 100 7.595
2 2 1 7 9 3516 100 7.595
4 2 1 7 9 3516 Non-Isothermal 5 (C/min) 100 7.595 1 7 2 1 7 9 2069 2nd Heater Installed @ 120V to 125 9.493 2 0 2 1 7 9 3448 Maintain the Reservoir temperature (100C) 125 9.493
2 4 2 1 7 9 3585 125 9.493
2 9 2 1 7 9 6895 125 9.493
TABLE 3. SUMMARY OF SAND PACK PARAMETERS
Run Percent by Wight Total Weight (%) Oil Volume So Oil by No. 80M 100M 200M API of Oil (ml) (%) Weight (%)
amount of coke and higher fuel deposition with a smaller
HC ratio of the fuel burned. Dabbous and Fulton [16]
observed similar HC ratio in the presence and absence of
LTO reactions. High HC ratio was obtained from soft
brown coke in absence of LTO reactions. In contrast a low
HC ratio was obtained from hard black coke in presence
of LTO reactions. Ramey [17] obtained oxidized residues
at temperatures as low as 149oC.
5.5
m-Ratios
The behavior of m-ratio under these conditions versus
combustion time is presented in Fig. 12. The production
of (CO2 and CO) gases was very low at the low temperature
range of 180-280oC. m-ratio decreased from 0.7-0.15 and
fairly constant (0.15) was measured at temperatures from
340-370oC. Table 2 presents the m-ratio, peak temperature
and few results are presented graphically (Fig. 12).
Lewis [18] observed that m-ratio for the combustion
reaction for charcoal is about 0.24. The value of 0.24 is
attributed to the carbon oxidation or coke combustion;
value different from this indicates that different reactions
are taking place. Fassihi, et. al., [19] has attributed values
higher than 0.24 to the burned fuel in the combustion as
hydrocarbon reaction. The trend of the both the HC and
the m-ratio in consolidated formations indicates that the
burned fuel in the HTO region may consist of a heavy
FIG. 11. APPARENT HC RATIO VERSUS TIME FOR DIFFERENT SYSTEM PRESSURES
APPLICATION IN SINDH FIELD
residue plus coke in the temperature range considered.
The decrease of the HC and m-ratio in unconsolidated
formations suggests that the burning fuel in the HTO region
is more likely coke.
5.6
Total System Pressure Effect
Arrhenius graphs were drawn by assuming (1.0, 0.5 and 2) order of reaction rate with concentration of carbon , which also confirmed that increased pressure (3446 KPa)
has high activation energy of 59 KJ/mole than to the experiments conducted at lower pressure (2069 KPa), 35
KJ/mole for high temperature reaction zones. The possible argument for the high rate of products at low temperature could be that the light components are reacting with free
oxygen available. To large quantity, producing higher amount of Carbon oxide, where as in high pressure of
6895 KPa the light components are suppressed. The low level of products in 6895 KPa experiment may be due to dilution effect, which is taking place by large number of
moles present in the reactor on increased pressure. One can conclude that the distribution of the products are
inadequate and does not behave like ideal. This non-ideal behavior of the reactor could be attributed to the mixing of the reactor. This is in depth investigation of
the effect of pressure on this process was conducted using 36oAPI oil.
6.
KINETIC PARAMETERS
As mentioned earlier Arrhenius method for the analysis of
kinetic data were used for considering the relative reaction
rate of carbon burned in terms of carbon oxides produced
effluent gas. As the reactant is the crude oil, or its residue,
whatever the composition, the resultant kinetic parameters
are only accounted for over a limited temperature range.
Fig. 13 shows the effect of system pressure for air 21% O2.
The plots did not behave as expected. The high pressure
line should lie above the low pressure line, where as no
such trend was observed. This phenomenon is not
completely under stood. But up to the pressure of 3585
KPa low pressure line lies above the high pressure line.
Similar curves were drawn for 21% O2 concentrations in
inlet gas and the same mixed plots were obtained for fuel
deposition and LTO reactions as presented in Figs. 14-15
respectively. The kinetic parameters were calculated for
each run at different depth of combustion cell. Table 2
presents the kinetic data evaluated using Arrhenius
method by considering the order of reaction with respect
to fuel n is equal to (1.0, 0.5 and 2.0). The kinetic parameters
for various runs at different pressures show that the
calculated activation energies are similar but not in complete
agreement. Again, the discrepancy appears to be an artifact
of the data analysis procedure by which the temperature
ranges were decoupled. Irrespective of small differences
in activation energies these have been plotted against the
total pressure and for better observation, these values
were linearized.
FIG. 13. ARRHENIUS PLOT FOR FUEL COMBUSTION REACTION WITH DIFFERENT SYSTEM PRESSURE
FIG. 14. ARRHENIUS PLOT FOR FUEL DEPOSITION REACTION AT DIFFERENT SYSTEM PRESSURE
APPLICATION IN SINDH FIELD
7.
REPEATABILITY AND ACCURACY
OF RESULTS
All runs were repeatable using the same fuel in repeated
runs. The run results are not reported in this paper
due to the similar results. The same procedure was
followed in matching the other results and the
repeatability of the test was confirmed. To verify that
the activation energies and the reaction orders derived
from the analysis were reasonable. The amount of
oxygen consumed in the three reactions was supper
imposed upon one another and the results were
compared to the experimental oxygen consumption
curves. The match was good for these and other similar
d a t a . To i n t e g r a t e t h e a r e a u n d e r t h e o x y g e n
consumption curve trapezoidal rule was used. This
induced some errors when there was a sharp change
in gas composition. It also introduced some errors into
the calculations of curve fitting and extrapolation of
the reaction rates of lower temperatures. These
calculations were particularly sensitive to the choice
of the point at which the relative reaction rate curve
would deviate from the straight line. Thus in all runs
using the same fuel except few runs; the calculated
activation energy (E) was not the same. Therefore to
normalize the data, first the E, which was quite different
from the average value, were not present in the graph.
Then calculated values of the activation energy of the
slope of straight line were drawn through experimental
data points on the Arrhenius plot (Fig. 13 and 15).
This was achieved by selecting an arbitrary data point
at the mid range of the abscissa as the focal point. For
a combustion reaction (Fig. 13), this point was about
1.5x10⁻³k-1. The corresponding points of deposition
of fuel as presented in Fig. 14 and LTO kinetic reaction
is shown in Fig. 15. Relative reaction rate versus
inverse of temperature for fuel deposition and LTO
are 1.6x10⁻³ and 2.3x10⁻³k-1, respectively.
8.
CONCLUSIONS
(i) A new slim and short CC strategy was developed to assess the recovery potential by air injection into depleted light oil reservoirs of Sindh, Pakistan. All the experiments are performed with loose sand pack mixed with Light oil.
(ii) At high, medium and low temperature, ignition was observed and efficient combustion takes place in all reported runs. It was observed that flue gases were generated by oxidation reaction at different temperature. The average percentages of gases are as follows:
Production of carbon dioxide is 10.2%.
Production of carbon monoxide is 4.4% and balance is unreacted oxygen.
Oxygen consumption varies from 65 97%.
(iii) It was observed that by increasing the pressure increased, the peak in temperature and decreased velocity in combustion zone were resulted.
(iv) Direct Arrhenius method was applied with respect to carbon concentration for evaluating order of reaction from 0.5, 1.0, 1.5 and 2. In loose rock formations, behavior of kinetic indicates moderate reactive depositiopn of fuel. Activation energy for fuel combustion, fuel deposition and LTO reactions varied from 21-59, 25-43, and 8-36 KJ/mole respectively.
(vi) These first stage experiments are very positive
indication of the potential viability of the air
injection process in light oil fields.
ACKNOWLEDGEMENTS
The authors gratefully acknowledge the financial support
of the Higher Education Commission, Islamabad, that
made this research work possible. Further the authors
extended sincere thanks to Dr. Gordon Moore, Chairman,
Department of Chemical and Petroleum Engineering,
University of Calgary, Alberta, Canada, for his valuable
suggestions. Finally, the technical support provided by
the Mehran University of Engineering and Technology,
Jamshoro, Pakistan, in general and Institute of Petroleum
and Natural Gas Engineering in particular are highly
acknowledged.
REFERENCES
[1] Kuhn, C.S., and Koch, R.L, " In-Situ Combustion Newest Method of Increasing Oil Recovery", Journal of Oil and Gas, Volume 92, August 10, 1953.
[2] Grant, B.F., and Szasz, S.F., “Development of an Underground Heat Wave for Oil Recovery", Transactions on AIME, Volume 201, No. 108, 1954.
[3] Nelson, T.W., and McNeil, J.S., "Thermal Methods Provide Three Ways to Improve Oil Recovery", Journal of Oil and Gas, Volume 86, January 19, 1959.
[4] Nelson, T.W., and McNeil, J.S., "How to Engineer an In -Situ Combustion Project", Journal of Oil and Gas, Volume 58, June 5, 1961.
[5] Greaves, M., Ren, S.R., Rathbone, R.R., Fishlock, T., and Ireland, R., "Improved Residual Light Oil Recovery by Air Injection (LTO Process)", 49th Annual Technical Meeting, Volume 39, No. 1, Calgary, Alberta., Canada, January, 2000.
[6] Moore, R.G., "New Strategies for In-Situ combustion", Journal of Canadian Petroleum Technology, Volume 32, No. 10, 1993.
[7] Yannimaras, D.V., and Tiffin, D.L., "Screening of Oils for In-Situ Combustion at Reservoir Conditions by Accelerating-Rate calorimeter", SPE Reservoir Engineering, Volume 10, pp. 36, February, 1995.
[8] Greaves, M., Benther, A.H., and Rathbone, R.R., "Air Injection into Light Oil Reservoirs-Oxidation Kinetics and Simulation", European Symposium on Improved Oil Recovery, Budapest, April, 2005.
[9] Stoka, S., Rogaland, R.F., and Oesthus, A., "Evaluation of Air Injection as an IOR Method for The Giant Ekofish Chalk Field", SPE International IOR Conference in Asia Pacific, Kuala Lumpur, Malaysia, December, 2005.
[10] Kumar, V.K., Gutierrez, D., Moore, R.G., and Mehta, S.A., "Air Injection and Water Flooded Performance Comparison of Two Adjacent Units in Buffalo Field: Technical Analysis", SPE Paper/DOE Symposium on IOR, Tulsa, Oklahoma, USA, April, 2006.
[11] Greaves, M., Ren, S.R., and Rathbone, R.R., "Air Injection Technique (LTO Process) for IOR from Light Oil Reservoirs: Oxidation Rate and Displacement Studies", SPE Paper/DOE IOR Symposium, Tulsa, Oklahoma, USA, April, 1998.
[12] Greaves, M., Ren, S.R., and Xia, T.X., "New Air Injection Technology for IOR Operations in Light and Heavy Oil Reservoirs", SPE Paper on Improved Oil Recovery, Kuala Lumpur, Malaysia, October, 1999.
[13] Tunio, A.H., "To Investigate the Use of Air Injection to Improve Oil Recovery from Light Oil Reservoirs", Ph.D. Thesis, Institute of Petroleum & Natural Gas Engineering, Mehran University of Engineering & Technology, Jamshoro, Pakistan, March, 2008.
[14] Kazi, R.A., "A High Pressure Kinetic study of the In-Situ Combustion Process for Oil Recovery", Ph.D. Thesis, University of Salford, 1995.
APPLICATION IN SINDH FIELD
[16] Dabbous, M.K., and Fulton, P.F., “Low Temperature Oxidation Reaction Kinetics and Effects of the In-Situ Combustion Process", Society of Petroleum Engineering Reserviors, pp. 253-262, June, 1974.
[17] Ramey, H.J., Jr., “In-Situ Combustion" Proceedings of the 8th World Petroleum Congress, pp. 253-262, Moscow, 1971.
[18] Lewis, W.K., Gilliland, E.R., and Pakston, R.R., “Low Temperature Oxidation of Carbon", Industrial and Engineering Chemical, Volume 46. No. 2, pp. 1327-1331, 1954.