www.arch-anim-breed.net/58/65/2015/ doi:10.5194/aab-58-65-2015
© Author(s) 2015. CC Attribution 3.0 License. Archives Animal Breeding
Genetic and environmental determinants of the urea level
in cow’s milk
A. Czajkowska1, B. Sitkowska1, D. Piwczy ´nski1, P. Wójcik2, and S. Mroczkowski1 1University of Technology and Life Sciences, Faculty of Animal Breeding and Biology, Department of
Genetics and General Animal Breeding, Bydgoszcz, Poland 2National Research Institute of Animal Production, Balice, Poland
Correspondence to:B. Sitkowska ([email protected])
Received: 25 March 2014 – Accepted: 10 December 2014 – Published: 4 March 2015
Abstract. This study was conducted on a sample of 2237 Polish Holstein-Friesian cows. The aim was to
esti-mate the effect of selected environmental factors on the level of urea in cow’s milk and on its genetic parameters, i.e. the heritability coefficients, and genetic correlation with other selected traits of milk production. The present study has revealed the existence of a highly significant influence of herd, year of calving, parity, lactation phase, and milk performance level on the urea content in cow’s milk. A high urea level in milk was detected in samples collected from older animals, both during the winter season and the middle phase of lactation (101–200 days).
The heritability estimates were generally at a low level, particularly in terms of milk yield (0.183) and urea content (0.152–0.159), which may indicate the dominant role of the environment in shaping them. Relatively low values of genetic correlation (−0.097–0.140) between the urea content and other traits suggest that improvement of milk yield and its composition modify the urea level in milk only to a small degree.
1 Introduction
An appropriate cow feeding programme is a major factor in high milk production. Many authors (Aguilar et al., 2012; Biswajit et al., 2011; Geerts et al., 2004; Hojman et al., 2004; Oltner et al., 1985) are of the opinion that, for dairy cows, the level of urea in cow’s milk (MU, milk urea) may be the indicator of whether the energy balance and protein ratio are proper. In general, in properly balanced feed, the MU ratio is at 15–30 mg dL−1. However, it should be noted that, for accurate interpretation of the urea content, not only the feed factor but also other factors should be taken into consideration. These factors include breed (Rodriguez et al., 1997), parity (Broderick and Clayton, 1997; Godden et al., 2001; Sawa et al., 2011), body weight (Kohn et al., 2002), milk yield (Godden et al., 2001), fat and protein content, days in milk (DIM), milking frequency (Godden et al., 2001; Kgole et al., 2012), and month of the year (Arunvipas et al., 2003; Biswajit et al., 2011; Borkowska et al., 2012; Frand et al., 2003; Hojman et al., 2004; Kgole et al., 2012; Oudah, 2009; Rafieei, 2011; Rzewuska and Strabel, 2013b). In
Pol-ish breeding programmes, urea content in cow milk has been monitored since 2000.
for 13.3 % of the variation in MUN concentration. Rajala-Schultz et al. (2001) indicate that increased MUN levels ap-peared to be negatively related to dairy cow fertility.
The aim of the present study was to evaluate the effect of the selected environmental factors on the level of urea in cow’s milk and its genetic parameters, i.e. the heritability co-efficients and genetic correlation with other selected traits of milk production.
2 Material and methods
2.1 Animals and treatments
The study was conducted on 2237 cows of the Polish Holstein-Friesian (PHF) breed, born between 2004 and 2009, and reared for their milk in three high-performance herds localized in Poland. Cows calved between 2006 and 2012. The housing, nutrition, and milking conditions were differ-ent across the herds. Cows were kept in free-stall barns, on litter. In herds A and B, the buildings were new, whereas the building for herd C is a free-stall barn built in the 1970s (up-graded from a tie-stall barn). On all farms, the production cycle was closed, and production groups were determined based on production volume. In herds A and B, milking is done in a herringbone parlour manufactured by Afimilk; herd C is milked in a rotary parlour. The total mixed ration (TMR) feeding method was used for all herds. In herd A, animal feed was produced on the farm based on own silage made of lucerne, straw, hay, or purchased feed, which is soya, brewer’s grains, post-extraction soya meal, and pea meal. In herd B, feeding was based on wilted silage, maize silage, and dried brewer’s grains, as well as rapeseed and soya meals. In herd C, animals were fed with wilted silages or maize silage, and the ration also included straw and wet sugar beet pulp, as well as soya, rapeseed, and grain meal.
The levels of urea in milk, milk yield in test milking, con-tent (%) of fat, protein, lactose, and dry matter in 36 902 test milkings were all controlled. The variation in the traits was examined based on the following factors: herd (A–C), parity (1, 2,≥3), milking season (spring, summer, autumn, winter), lactation phase (5–100, 101–200, 201–305 days), daily yield of milk (≤25.0; 25–32, 32–39; > 39 kg), and year of cow’s birth (2004, ..., 2009).
Statistical calculations were conducted with the use of re-sults from test milkings, which took place between lactation days 5 and 305.
The number of cows included in the output data set used in the genetic analysis was reduced from 2237 to 1825, due to several of the applied criteria. The only data taken into consideration were those from cows for which the number of test milkings in a lactation was at least six, and the last test milking took place after lactation day 200. At least 10 cows per herd x year of birth were required. The average
number of animals in a herdxyear or birth class (18 classes)
was 124. Cows were omitted if their sire had less than 10
daughters. The cows assessed in terms of their lactation traits were daughters of 145 bulls. In total, these data were placed in 943 HTD (herd test day) classes.
The pedigree information of the studied animal popula-tion was, where possible, gathered up to the third generapopula-tion. Using the INBREED procedure of the SAS package (SAS, 2013), we examined the population inbreeding level. The re-sultant rate in reference to 13 inbred animals was 22.92 % (standard deviation=4.87 %).
2.2 Explorative analysis
In order to statistically evaluate the impact of the above-mentioned factors on the analysed features, the multifactor analysis of variance was used. The linear model describing the variability of milk production traits, in addition to the impact of the main factors – herd, milking season, lactation phase, daily yield of milk, and year of cow’s birth – takes into consideration all first-order interactions between the main factors. The significance of differences between groups was examined by using the Bonferroni test. Calculations were performed with the SAS statistical package.
2.3 Genetic analysis
We evaluated indicators of heritability, as well as the genetic correlation between the urea content and both milk yield dur-ing test milkdur-ing and milk composition, i.e. the content (%) of fat, protein, lactose, and dry matter.
Estimation of parameters was performed with the use of the restricted maximum likelihood (REML) method and the REMLF90 software (Misztal, 2007). While estimating ge-netic parameters with the REML method, the same conver-gence index, equal to 10−10, was adopted for all models. Ge-netic parameters of studied traits were estimated using two-traits linear classification models (animal models). The same models were used for each of the analysed features:
yij lm=HTDi+ 3 X
k=1
bj k×zlmk+ 3 X
k=1
alk×zlmk
+ 3 X
k=1
plk×zlmk+eij lm,
whereyij lm=test day (TD) recordmfor MU, milk, fat, pro-tein, lactose, and dry matter of cowibelonging to parity
sub-classj; HTDi – fixed herd – TD effect;k– kth parameter of Legendre polynomials;bj k– fixed regression coefficients specific to parity subclassj;alk– random regression coeffi-cients specific to additive genetic effect of cow l;plk– ran-dom permanent environmental effect associated with all TD yields of cowm;eij lm– random residual effect; andzlmk – Legendre polynomials modified by Gengler et al. (1999):
z0=1;z1=√3x;z2= q
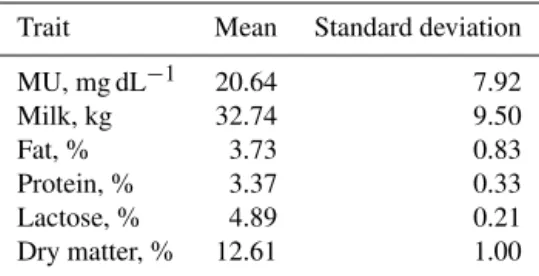
Table 1.Descriptive statistics of the analysed traits (N=36 902).
Trait Mean Standard deviation MU, mg dL−1 20.64 7.92
Milk, kg 32.74 9.50 Fat, % 3.73 0.83 Protein, % 3.37 0.33 Lactose, % 4.89 0.21 Dry matter, % 12.61 1.00
wherex= −1+2×(DIM−5)/(305−5); DIM – days in milk.
These are model assumptions, as well as variance and co-variance components necessary for estimating heritabil-ity coefficients and genetic correlations for particular lacta-tion days (from day 5 to 305), calculated based on formulas proposed by Jamrozik and Schaeffer (1997).
3 Results and discussion
Table 1 shows arithmetic means and standard deviations for the analysed traits in the data set. The results of our study in-dicate that the average level of urea in milk is approximately 20.64 mg dL−1, which may be considered to be a normal re-sult (Table 1). Other studies (Sawa et al., 2011) have shown that, in the case of feeding dairy cows, the most optimal urea concentration in milk is 15–30 mg dL−1. According to many authors (Rajala-Schultz et al., 2001; Sawa et al., 2011), mon-itoring the concentration of urea in cow’s milk may enable identification of the causes of health problems in cows which mainly affect fertility.
On the basis of the calculated standard deviation (7.92 mg dL−1), it may be concluded that the urea content in milk was characterized by a high dispersion. In the study of Jonkus and Paura (2011), who conducted their studies on Latvian Brown cows, the average MU was found to be at a level of 16.55 mg dL−1and milk yield per test day was at a level of 20.37 kg. The average milk yield in the test milk-ing was 32.74 kg and the content of fat and protein was 3.73 and 3.37 %, respectively. The lactose and dry matter content was 4.89 and 12.61 %, respectively (Table 1). The results in-dicate that tested herds were characterized by significantly higher milk parameters in comparison to the average results obtained for the population that had been evaluated in Poland in 2012 (PFHBiPM, 2012).
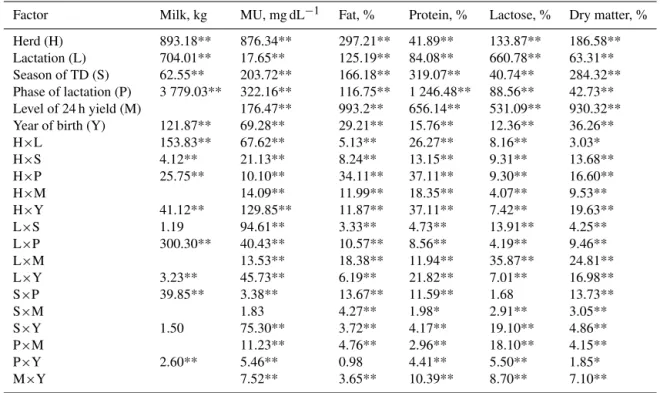
By using the multifactor analysis of variance it was proven that factors which highly significantly and significantly dif-ferentiated the level of urea in cow’s milk, milk yield, and its composition were herd, parity, lactation phase, season of test milking, and year of birth (Table 2). In addition, the factor that statistically affected the level of urea in milk and milk content traits was the level of milk yield. Furthermore, a sta-tistical effect of the majority of interactions included in the classification model for the analysis of interaction variance
was shown. Jonkus and Paura (2011) reported that milk pro-ductivity traits were affected by factors such as season, par-ity, and lactation phase (P <0.001), with the exception of fat
content, which was not affected by parity. Season and milk-ing systems influenced MU (P <0.001). Kgole et al. (2012)
noted that MUN was significantly affected by herd test day, year of calving, parity, number of milkings per day, and the lactation phase.
Due to the initial aim of the study, the next stage of de-scription included an interpretation of the results for the anal-ysis of variance and Bonferroni test, relating to the urea con-tent in cow’s milk.
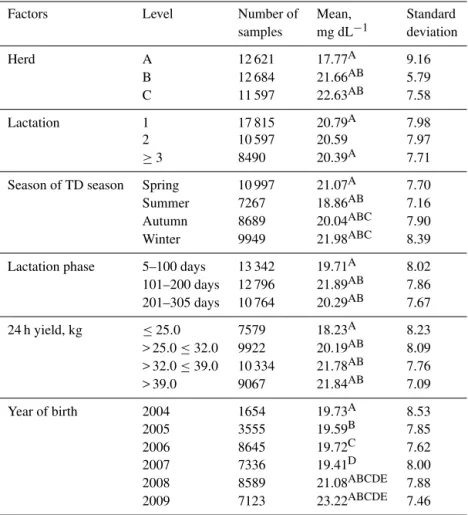
The level of urea in milk varied depending on the herd. In herd C, the average level of this component was the highest and amounted to 22.63 mg dL−1, while in herd A the level was the lowest at 17.77 mg dL−1. Such variation in the value of the urea level may suggest that different feeding systems were used in those herds (Table 3). Those results are in ac-cordance with Carlsson et al. (1995), Godden et al. (2001), Hojman et al. (2004), and Rodriguez et al. (1997), who also obtained results that were not the same due to differences in feeding. Changes in the level of urea may be caused by a cow’s individual physiology, different feeding programmes, rearing, or breed.
Taking parity into account, it was proven that the level of urea was the highest during the first lactation and the low-est during the third one (Table 3). According to Fatehi et al. (2012) and Jílek et al. (2006), the mean MUN concentration, reported for Holstein cows in the third and later lactations, was lower than in the first or second lactation. Opposite re-sults were obtained by Bendelja et al. (2011), who noted that the lowest urea concentration in milk was during the first lac-tation. Also, according to Carlsson et al. (1995) and Godden et al. (2001), MUN concentrations were lowest during the first lactation.
Studies reporting lower MUN values in the first lactation suggested that primiparas were still growing and therefore might have used amino acids more effectively (Arunvipas et al., 2003; Canfield et al., 1990; Carlsson et al., 1995; Fergu-son et al., 1997; Ng-Kwai-Hang et al., 1985; Oltner et al., 1985). According to Doska et al. (2012), primiparas showed higher MUN values compared to multiparas, which may be explained by the lower milk production of younger cows. Moreover, Hojman et al. (2004) reported the association be-tween high MU levels and high milk yields.
It was proven that the season of the test milking differenti-ated urea level (Table 2). The highest urea content was noted in milk of cows milked in winter and spring and the lowest in cows milked in summer (Table 3).
Table 2.The significance of the impact of the tested factors on the level of the urea in cow’s milk.
Factor Milk, kg MU, mg dL−1 Fat, % Protein, % Lactose, % Dry matter, %
Herd (H) 893.18** 876.34** 297.21** 41.89** 133.87** 186.58** Lactation (L) 704.01** 17.65** 125.19** 84.08** 660.78** 63.31** Season of TD (S) 62.55** 203.72** 166.18** 319.07** 40.74** 284.32** Phase of lactation (P) 3 779.03** 322.16** 116.75** 1 246.48** 88.56** 42.73** Level of 24 h yield (M) 176.47** 993.2** 656.14** 531.09** 930.32** Year of birth (Y) 121.87** 69.28** 29.21** 15.76** 12.36** 36.26** H×L 153.83** 67.62** 5.13** 26.27** 8.16** 3.03*
H×S 4.12** 21.13** 8.24** 13.15** 9.31** 13.68**
H×P 25.75** 10.10** 34.11** 37.11** 9.30** 16.60**
H×M 14.09** 11.99** 18.35** 4.07** 9.53**
H×Y 41.12** 129.85** 11.87** 37.11** 7.42** 19.63**
L×S 1.19 94.61** 3.33** 4.73** 13.91** 4.25**
L×P 300.30** 40.43** 10.57** 8.56** 4.19** 9.46**
L×M 13.53** 18.38** 11.94** 35.87** 24.81**
L×Y 3.23** 45.73** 6.19** 21.82** 7.01** 16.98**
S×P 39.85** 3.38** 13.67** 11.59** 1.68 13.73**
S×M 1.83 4.27** 1.98* 2.91** 3.05**
S×Y 1.50 75.30** 3.72** 4.17** 19.10** 4.86**
P×M 11.23** 4.76** 2.96** 18.10** 4.15**
P×Y 2.60** 5.46** 0.98 4.41** 5.50** 1.85*
M×Y 7.52** 3.65** 10.39** 8.70** 7.10**
**P≤0.01, *P≤0.05
other hand, too low a level of urea in cow’s milk may arise from an insufficient level of protein in feed, the excess of easily fermentable carbohydrates (feed concentrates), incor-rectly balanced feed ratio, and malnutritio that not necessar-ily inhibit the potential productivity of dairy cows (Jonker et al., 1999). Doska et al. (2012) reported that the concentra-tions of milk urea nitrogen were found to be higher (P <0.01)
during winter, intermediate in spring, and low in both au-tumn and summer. This result is in contrast to those results obtained by Sawa et al. (2011), Godden et al. (2001), Fergu-son et al. (1997), and Wattiaux et al. (2005), who also noted that milk urea varied depending on the month and season. They did, however, notice that the highest milk urea level was obtained during the summer months. In the study con-ducted by Fatehi et al. (2012), MUN was found to be the lowest in December and the highest in July. Hojman et al. (2004) obtained the lowest MUN level in November and the highest in June. According to Bendelja et al. (2011), the urea concentration in milk was significantly higher (P <0.01) in
spring and summer than during other seasons. According to Kˇrížová et al. (2013), the concentration of nitrogen fractions decreased during summer, while during winter it was higher (P <0.05). Rzewuska and Strabel (2013a) reported the
as-sociation between the sampling month, air temperature, and MU. MU was high during the period from May to October, and the highest values were recorded in the summer months. However it should be noted that, regardless of the season, MU increased with increasing temperatures.
Another factor that was found to affect the level of urea in cow’s milk was the phase of lactation. In the present research the highest level of urea was found in samples collected be-tween 101 and 200 days of lactation, while the lowest was noted during the first stage of lactation, which results from the natural physiology of cows after calving (Table 3). At the beginning of lactation, the increase in the milk yield is ac-companied by a lack of appetite, which in turn leads to a re-duced intake of feed. In later periods of lactation, appetite as well as the milk yield and the level of urea in milk increases (Godden et al., 2001).
Fatehi et al. (2012) reported that the concentration of MUN in milk was the lowest during the first 30 days. Godden et al. (2001) obtained the lowest MU during the first 60 days of lactation, while MU in milk was higher between 60 and 150 days. After approximately 150 days of lactation, MU de-creased. Also, in the study of Doska et al. (2012), the impact of the lactation phase on MUN was found to be significant, as the highest MUN values were observed in the sixth month of lactation.
In the present study it was noted that while the daily per-formance increased, the level of urea increased as well. The differences between the tested samples were highly signif-icant (Table 3). The results are in accordance with the ten-dency presented by Carlsson et al. (1995) and Rajala-Schultz and Saville (2003).
Dif-Table 3.Level of urea in milk with respect to selected factors.
Factors Level Number of Mean, Standard samples mg dL−1 deviation
Herd A 12 621 17.77A 9.16 B 12 684 21.66AB 5.79 C 11 597 22.63AB 7.58 Lactation 1 17 815 20.79A 7.98 2 10 597 20.59 7.97
≥3 8490 20.39A 7.71
Season of TD season Spring 10 997 21.07A 7.70 Summer 7267 18.86AB 7.16 Autumn 8689 20.04ABC 7.90 Winter 9949 21.98ABC 8.39 Lactation phase 5–100 days 13 342 19.71A 8.02 101–200 days 12 796 21.89AB 7.86 201–305 days 10 764 20.29AB 7.67 24 h yield, kg ≤25.0 7579 18.23A 8.23
> 25.0≤32.0 9922 20.19AB 8.09
> 32.0≤39.0 10 334 21.78AB 7.76
> 39.0 9067 21.84AB 7.09 Year of birth 2004 1654 19.73A 8.53 2005 3555 19.59B 7.85 2006 8645 19.72C 7.62 2007 7336 19.41D 8.00 2008 8589 21.08ABCDE 7.88 2009 7123 23.22ABCDE 7.46
AA – means marked with identical capital letters differ (P≤0.01).
ferences that were proven to be statistically significant were found between the above-mentioned years and the year 2009 and 2008. This may suggest that some changes in feeding programmes used in those years were made (Table 3). Mon-itoring the urea content in milk may allow the status of nu-trition and cow’s health to be controlled. It would also allow protein efficiency in dairy cows to be evaluated in order to optimize the efficiency of utilization of the dietary protein (Guo, 2004).
Heritability of the tested milk traits was at a low or moder-ate level: milk yield – 0.183; MU – 0.152–0.159; fat content – 0.271; protein content – 0.327; lactose content – 0.340; and dry matter – 0.298. Genetic correlation indices (rg)
showed that the urea content in milk was negatively cor-related with milk yield (rg= −0.097), positively correlated
with fat content (rg=0.140) and dry matter (rg=0.125),
and very weakly correlated with protein (rg=0.038) and
lactose content (rg=0.071) (Table 4). Rzewuska and
Stra-bel (2013a) reported that the average daily heritabilities of MU were 0.22 for the first and 0.21 for the second and third lactations. Hossein-Zadeh and Ardalan (2011) reported that the average genetic correlation for MUN and lactose
percent-age was close to zero (−0.01), while the average genetic correlation was moderately positive for milk yield (0.24), net energy concentration of milk (0.31), fat (0.21), and pro-tein percentage (0.30). Average estimated heritabilities for MUN ranged from 0.14 to 0.21 throughout lactations. In the studies of Mucha and Strandberg (2011), the estimated MUN heritability was stable during the whole lactation and ranged between 0.16 and 0.18. According to Kramer et al. (2013), who calculated heritabilities for Brown Swiss cattle for each udder, the quarters were in the following ranges: fat content 0.09±0.06 to 0.14±0.06, protein 0.20±0.09 to 0.33±0.07, lactose 0.04±0.03 to 0.16±0.07, and urea 0.13±0.07 to 0.22±0.08. Jonkus and Paura (2011) de-scribed the effect of the season, parity, and lactation phase (P <0.001) on milk productivity traits, although they
re-ported the exception of fat content, which was not affected by parity. Moreover, they stated that MU depended on the sea-son and milking systems (P <0.001) and that the estimated
Table 4.Estimates of (co)variance components, heritability and repeatability of milk yield, milk composition calculated based on the bivariate
linear–linear models.
Estimate Traits included Traits (X)
in the model Milk, kg Fat, % Protein, % Lactose, % Dry matter, %
σa2 X 10.1124 0.1554 0.0248 0.0125 0.2445
SDσa2 X 6.1616 0.0634 0.0081 0.0017 0.0959
σa2 urea 4.3644 4.2202 4.1614 4.3364 4.1720
SDσa2 urea 0.6550 0.6808 0.6755 0.7553 0.5964 cov −0.2614 0.0952 0.0199 0.0158 0.1213
SD cov 1.1093 0.1821 0.0594 0.0126 0.1414
σpe2 X 17.0167 0.0961 0.0161 0.0053 0.1732
SDσpe2 X 1.7169 0.0300 0.0044 0.0020 0.0341
σpe2 urea 4.3075 4.3137 4.3862 4.2472 4.3459
SDσpe2 urea 1.6056 1.6007 1.5820 1.5378 1.6520
cov 3.5252 0.0433 −0.0139 0.0205 0.0623 SD cov 2.4330 0.0208 0.0201 0.0180 0.0363
h2a X 0.1834 0.2712 0.3272 0.3397 0.2978 SDh2a 0.0824 0.0967 0.0725 0.0379 0.0957 h2a urea 0.1588 0.1543 0.1519 0.1580 0.1528
SDh2a 0.0137 0.0176 0.0148 0.0175 0.0158 rg −0.0973 0.1400 0.0377 0.0712 0.1250
SDrg 0.1681 0.2059 0.1575 0.0547 0.1410
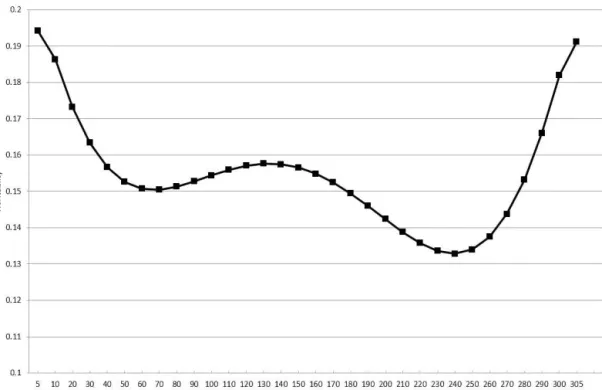
of lactation. In the remaining lactation time, the MU heri-tability was clearly lower, at 0.133 to 0.157. The heriheri-tability values shown in Fig. 1 confirm that there is a changing ef-fect of genetic factors on MU during lactation. The resultant curve is similar to that presented by other authors in relation to milk yield and milk content (Nixon et al., 2009; Strabel and Misztal, 1999).
In conclusion, the present study shows highly significant influence of herd, year of calving, parity, lactation phase, and the level of milk performance on the urea content in cow’s milk. It was noted that the high urea level in milk was de-tected in samples collected from older animals, during the winter season, and during the middle phase of lactation (101– 200 days).
The heritability estimates were generally at a low or moderate level, particularly in terms of milk yield and urea content, which may indicate the dominant role of the environment in shaping them. Relatively low values of genetic correlation between the urea content and other traits suggest that improvement in milk yield and its composition only modify the urea level in milk to a small degree.
Edited by: A.-E. Freifrau von Tiele-Winckler Reviewed by: three anonymous referees
References
Aguilar, M., Hanigan, M. D., Tucker, H. .A, Jones, B. L. , Garbade, S. K., McGilliard, M. L., Stallings, C. C., Knowlton, K. F., and James, R. E.: Cow and herd variation in milk urea nitrogen con-centrations in lactating dairy cattle, J. Dairy Sci., 12, 7261–7268, 2012.
Arunvipas, P., Dohoo, I. R., Van Leeuwen, J. A., and Keefe, G. P.: The effect of non-nutritional factors on milk urea nitrogen levels in dairy cows in Prince Edward Island, Canada, Prev. Vet. Med., 59, 83–93, 2003.
Bendelja, D., Prpi´c, Z., Mikulec, N., Ivki´c, Z., Havranek, J., and Antunac, N.: Milk urea concentration in Holstein and Simmental cows, Mljekarstvo, 61, 45–55, 2011.
Biswajit, R., Brahma, B., Ghosh, S., Pankaj, P. K., and Mandal, G.: Evaluation of Milk Urea Concentration as Useful Indicator for Dairy Herd Management: A Review, Asian J. Anim. Vet. Adv., 6, 1–19, 2011.
Borkowska, D., Janu´s, E., and Wilgos, A.: The effect of selected factors on changes in body condition in high-yield cows, Acta Sci. Pol. Zootec., 11, 11–20, 2012.
Broderick, G. A. and Clayton, M. K.: A Statistical Evaluation of Animal and Nutritional Factors Influencing Concentrations of Milk Urea Nitrogen, J. Dairy Sci., 80, 2964–2971, 1997. Canfield, R. W., Sniffen, C. J., and Butler, W. R.: Effects of
Ex-cess Degradable Protein on Postpartum Reproduction and En-ergy Balance in Dairy Cattle, J. Dairy Sci., 73, 2342–2349, 1990. Carlsson, J., Bergström, J., and Pehrson, B.: Variations with breed, age, season, yield, stage of lactation and herd in the concentration of urea in bulk milk and individual cow’s milk, Acta Vet. Scand., 36, 245–254, 1995.
Doska, M. C., da Silva, D. F. F., Horst, J. A., Valloto, A. A., Rossi Jr., P., and de Almeida, R.: Sources of variation in milk urea ni-trogen in Paraná dairy cows, Rev. Bras. Zootec., 41, 692–697, 2012.
Fatehi, F., Zali, A., Honarvar, M., Dehghan-banadaky, M., Young, A. J., Ghiasvand, M., and Eftekhari, M.: Review of the relation-ship between milk urea nitrogen and days in milk, parity, and monthly temperature mean in Iranian Holstein cows, J. Dairy Sci., 95, 5156–5163, 2012.
Ferguson, J. D., Thomsen, N., Slesser, D., and Burris, D.: Pennsyl-vania DHIA milk urea testing, J. Dairy Sci., 80 (Suppl.), 161, 1997.
Frand, X., Froidmont, E., Bartiaux-Thill, N., Decruyenaere, V., Van Reusel, A., and Fabry, J.: Utilization of milk urea concentration as a tool to evaluate dairy herd management, Anim. Res., 52, 543–551, 2003.
Geerts, N. E., De Brabander, D. L., Vanacker, J. M., De Boever, J. L., and Botterman, S. M.: Milk urea concentration as affected by complete diet feeding and protein balance in the rumen of dairy cattle, Livest. Prod. Sci., 85, 263–273, 2004.
Gengler, N., Tijani, A., Wiggans, G. R., and Misztal, I.: Estimation of (Co)variance Function Coefficients for Test Day Yield with a Expectation-Maximization Restricted Maximum Likelihood Al-gorithm, J. Dairy Sci., 82, 1849–1872, 1999.
Godden, S. M., Lissemore, K. D., Kelton, D. F., Leslie, K. E., Wal-ton, J. S., and Lumsden, J. H.: Factors Associated with Milk Urea Concentrations in Ontario Dairy Cows, J. Dairy Sci., 84, 107– 114, 2001.
Guo, K.: Effects of milk urea nitrogen and other factors on prob-ability of conception of dairy cows. MSc thesis, University of Maryland, College Park, MD, USA, 2004.
Hojman, D., Kroll, O., Adin, G., Gips, M., Hanochi, B., and Ezra, E.: Relationships Between Milk Urea and Production, Nutrition, and Fertility Traits in Israeli Dairy Herds, J. Dairy Sci., 87, 1001– 1011, 2004.
Hossein-Zadeh, N. G. and Ardalan, M.: Estimation of genetic pa-rameters for milk urea nitrogen and its relationship with milk constituents in Iranian Holsteins, Livest. Sci., 135, 274–281, 2011.
Jamrozik, J. and Schaeffer, L. R.: Estimates of Genetic Parameters for Test Day Model with Random Regressions for Yield Traits of First Lactation Holstein, J. Dairy Sci., 80, 762–770, 1997. Jílek, F., ˇRehák, D., Volek, J., Štípková, M., Nˇemcová, E.,
Fiedlerová, M., Rajmon, R., and Švestková, D.: Effect of herd, parity, stage of lactation and milk yield on urea concentration in milk, Czech J. Anim. Sci., 51, 510–517, 2006.
Jonker, J. S., Kohn, R. A., and Erdman, R. A.: Milk Urea Nitrogen Target Concentrations for Lactating Dairy Cows Fed According to National Research Council Recommendations, J. Dairy Sci., 82, 1261–1273, 1999.
Jonkus, D. and Paura, L.: Estimation of Genetic Parameters for Milk Urea and Milk Production Traits of Latvian Brown Cows, Agric. Conspec. Sci., 76, 227–230, 2011.
Kgole, M. L., Visser, C., and Banga, C. B.: Environmental factors influencing milk urea nitrogen in South African Holstein cattle, S. Afr. J. Anim. Sci., 42 (Suppl.), 459–463, 2012.
Kramer, M., Erbe, M., Bapst, B., Bieber, A., and Simianer, H.: Esti-mation of genetic parameters for individual udder quarter milk content traits in Brown Swiss cattle, J. Dairy Sci., 96, 5965– 5976, 2013.
Kˇrížová, L., Hanuš, O., Roubal, P., Kuˇcera, J., and Hadrová, S.: The effect of cattle breed, season and type of diet on nitrogen fractions and amino acid profile of raw milk, Arch. Tierz., 56, 709–718, 2013.
Misztal, I.: BLUPF90 family of programs, available at: http:// nce.ads.uga.edu/~ignacy/programs.html (last access: February 2015), 2007.
Mucha, S. and Strandberg, E.: Genetic analysis of milk urea nitro-gen and relationships with yield and fertility across lactation, J. Dairy Sci., 94, 5665–5672, 2011.
Ng-Kwai-Hang, K. F., Hayes, J. F., Moxley, J. E., and Monardes, H. G.: Percentages of Protein and Nonprotein Nitrogen with Vary-ing Fat and Somatic Cells in Bovine Milk, J. Dairy Sci., 68, 1257–1262, 1985.
Nixon, M., Bohmanova, J., Jamrozik, J., Schaeffer, L. R., Hand, K., and Miglior, F.: Genetic parameters of milking frequency and milk production traits in Canadian Holsteins milked by an auto-mated milking system, J. Dairy Sci., 92, 3422–3430, 2009. Oltner, R., Emanuelson, M., and Wiktorsson, H.: Urea
concentra-tions in milk in relation to milk yield, live weight, lactation num-ber and amount and composition of feed given to dairy cows, Livest. Prod. Sci., 12, 47–57, 1985.
Oudah, E. Z. M.: Non-genetic factors affecting somatic cell count, milk urea content, test-day milk yield and milk protein per-cent in dairy cattle of the Czech Republic using individual test-day records. Livest Res Rural Dev 21, Article #71, available at: http://www.lrrd.org/lrrd21/5/ouda21071.htm (last access: Febru-ary 2015), 2009.
PFHBiPM: The results of breeding value of dairy cattle, Polish Fed-eration of Cattle Breeders and Dairy Farmers, available at: http: //www.pfhb.pl/index.php/ocena/archiwum (last access: February 2015), 2012 (in Polish).
Rafieei, H.: Responses of Milk Urea Nitrogen Content to Dietary Rumen Degradable Protein Level in Lactating Holstein Dairy Cows, Iran J. Appl. Anim. Sci., 1, 111–116, 2011.
Rajala-Schultz, P. J. and Saville, W. J. A.: Sources of Variation in Milk Urea Nitrogen in Ohio Dairy Herds, J. Dairy Sci., 86, 1653– 1661, 2003.
Rajala-Schultz, P. J., Saville, W. J. A., Frazer, G. S., and Wittum, T. E.: Association Between Milk Urea Nitrogen and Fertility in Ohio Dairy Cows, J. Dairy Sci., 84, 482–489, 2001.
Rodriguez, L. A., Stallings, C. C., Herbein, J. H., and McGilliard, M. L.: Effect of Degradability of Dietary Protein and Fat on Ruminal, Blood, and Milk Components of Jersey and Holstein Cows, J. Dairy Sci., 80, 353–363, 1997.
Rzewuska, K. and Strabel, T.: Genetic parameters for milk urea concentration and milk traits in Polish Holstein-Friesian cows, J. Appl. Genet., 54, 473–482, 2013a.
Rzewuska, K. and Strabel, T.: Effects of some non-genetic factors on concentration of urea in milk in Polish Holstein-Fresian cows, J. Anim. Feed Sci., 22, 197–203, 2013b.
SAS: SAS/STAT®9.4 User’s Guide, SAS Institute, Inc., Cary, NC, USA, 2013.
Sawa, A., Bogucki, M., and Kr˛e˙zel-Czopek, S.: Effect of some fac-tors on relationships between milk urea levels and cow fertility, Arch. Tierz., 54, 468–476, 2011.
Strabel, T. and Misztal, I.: Genetic Parameters for First and Sec-ond Lactation Milk Yields of Polish Black and White Cattle with Random Regression Test-Day Models, J. Dairy Sci., 82, 2805– 2810, 1999.