THE INFLUENCE OF THI VALUES AT DIFFERENT PERIODS OF LACTATION ON MILK QUALITY AND CHARACTERISTICS
OF LACTATION CURVE
Marko R. Cincović*, Branislava M. Belić, Bojan D. Toholj, Ivan V. Radović and Bojana R. Vidović
University of Novi Sad, Faculty of Agriculture,
Department of Veterinary Medicine and Department of Animal Science, Trg Dositeja Obradovića 8, 21000 Novi Sad, Serbia
Abstract: The experiment included 90 cows. Cows were chosen according to the time of calving, so that the first third of lactation occurred during the summer in 30 cows (G1), the second third of lactation occurred during the summer in 30 cows (G2), and in the last 30 cows the last third of lactation was in summer period (G3). The value of THI was between 72 and 82, which indicates the existence of the moderate intensity of heat stress. Heat stress does not damage the milk yield, milk fat and protein percentage on the level of the whole lactation, regardless of the lactation period in which the cows were exposed to stress. There was no correlation between THI and milk yield and quality at the level of the whole lactation. Heat stress did not show a significant effect on the parameters of lactation curve, except the peak of yield, which occurred later in cows exposed to heat stress. Increased value of THI showed nonsignificant effect on yield and quality of milk in the first third of lactation. In the middle and at the end of lactation THI was in a significant negative correlation with the yield and quality of milk. Our study showed a significantly lower heat-induced milk yield, milk fat and protein percent in the middle and at the end of lactation.
Key words: heat stress, dairy cows, milk yield, milk fat, milk protein, lactation curve.
Introduction
Temperature humidity index (THI) is an important indicator of heat stress loading. Heat stress in dairy cows occurs when THI index is higher than 72 (Dikmen and Hansen, 2009). In our geographical area, it happens from the second half of May to the end of September.
Lactation curve is a graphical representation of the milk yield during standard lactation (305 days). Lactation curve includes next parameters: the initial level of and peak of milk yield, period to reach peak of yield and the persistence of lactation (Ferris et al., 1985).
Heat stress in dairy cows is characterised by reduced milk yield and decrease of the quality of milk (Cincović and Belić, 2009). Decline in productivity occurs because of reduced food intake, as a result of endocrine and metabolic adaptation to a high body and environmental temperature (Hristov et al., 2007; Bernabucci et al., 2010). Stage of lactation is an important factor that affects the damage of milk production during heat stress. It was found that mid-lactating dairy cows were the most heat sensitive compared to early and late lactating cows (Johnson, 1987).
The aim of our study was to determine the influence of heat stress (higher THI value) on the lactation curve.
Materials and Methods
The experiment included 90 cows. Cows were chosen according to the time of calving, so that in 30 cows the first third of lactation occurred during the summer (G1), the second third of lactation occurred during the summer in 30 cows (G2), and in the last 30 cows the last third of lactation occurred in summer period (G3). Only healthy Holstein-Friesian cow breeds in the second and third lactation were selected for the experiment. Average milk production in previous lactation was about 20 litres of milk a day. Cows were grown under the same conditions of nutrition and care.
Milk production was monitored daily during 44 weeks (305 days of standard lactation). Data on the percentage of milk fat and protein in milk were measured weekly using standard spectrophotometric methods (Milcoscan device). The following parameters of lactation curves were observed: a-milk yield at the beginning of lactation, b-daily increase in milk yield until a peak (linear), c-moment of peak in milk yield (days), d-peak in milk yield (L), e-day drop in milk yield after reaching peak (linear).
THI-index was calculated on the basis of meteorological data and measurements on the farm according to the formula Shehab-El-Deen et al. (2010), mTHI = 0.8 x mAT + (mRH x (mAT - 14.4)) + 46.4; mTHI-mean values THI, mAT-mean atmospheric temperature, mRH-mean relative humidity in decimal.
Results and Discussion
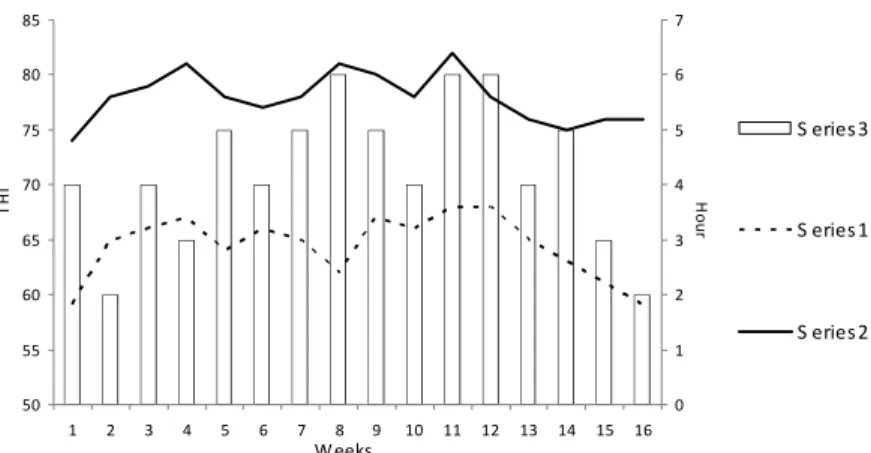
In our geographical climate during the late spring, summer and early autumn conditions for the development of heat stress are created (Figure 1).
50 55 60 65 70 75 80 85
1 2 3 4 5 6 7 8 9 10 11 12 13 14 15 16
0 1 2 3 4 5 6 7
S eries 3
S eries 1
S eries 2
W eeks
TH
I Ho
u
r
Figure 1. Minimum (Series 1) and maximum (Series 2) value of THI, and duration (in hours) of THI>72 throughout the day (columns, Series 3).
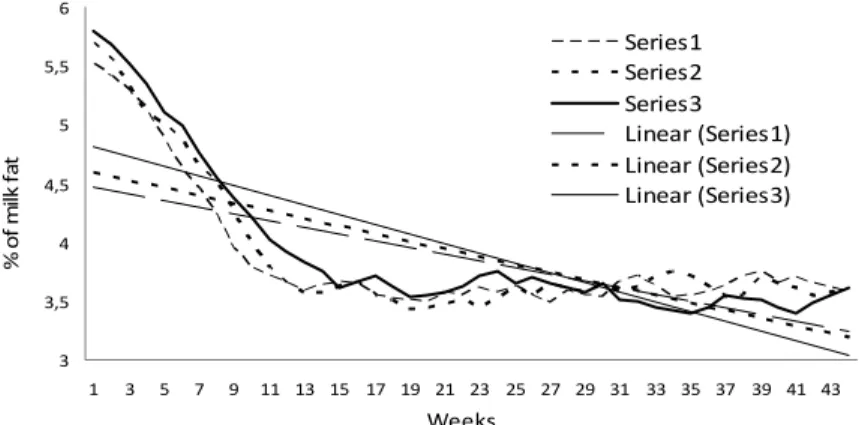
Heat shock did not lead to a significant drop in milk production (G1: G2: G3; 21.95: 21.95: 21.84 L/day), milk fat percentage (G1: G2: G3; 3.86: 3.89: 3.93) and percentage protein (G1: G2: G3; 3.22: 3.26: 3.22) at the level of the whole lactation (Figures 2, 3 and 4). A significant correlation between THI and milk production and quality at the level of the whole lactation was not obtained. Heat stress had no significant effect on the parameters of lactation curve (a, b, d, e), except for the moment of achieving the peak in milk yield (c) (Table 1).
Table 1. Parameters of lactation curve in thermoneutral (THI<72) and heat stressed (THI>72) zone.
Parameters of lactation curve THI<72 THI>72 Significance
a parameter (L) 17.82 17.7 p>0.05
b parameter (L/day) 0.164 0.121 p>0.05
c parameter (days) 53.3 68.1 p<0.01
d parameter (L) 25.69 26.71 p>0.05
16 18 20 22 24 26 28
1 3 5 7 9 11 13 15 17 19 21 23 25 27 29 31 33 35 37 39 41 43
S eries 1 S eries 2 S eries 3 L inear (S eries 1) L inear (S eries 2) L inear (S eries 3)
Weeks Mi lk yi e ld (L )
Figure 2. Lactation curve-milk yield, the original and linear data, group G1 (Series 1), G2 (Series 2), G3 (Series 3).
2.7 2.9 3.1 3.3 3.5 3.7 3.9 4.1 4.3 4.5
1 4 7 10 13 16 19 22 25 28 31 34 37 40 43
S eries 1 S eries 2 S eries 3 L inear (S eries 1) L inear (S eries 2) L inear (S eries 3)
Weeks % of pr o te in s in mi lk
Figure 3. Percentage of protein in the milk-original and linear data, G1 (Series 1), G2 (Series 2), G3 (Series 3).
3 3,5 4 4,5 5 5,5 6
1 3 5 7 9 11 13 15 17 19 21 23 25 27 29 31 33 35 37 39 41 43
Series1 Series2 Series3 Linear (Series1) Linear (Series2) Linear (Series3)
% of m ilk fa t Weeks
Increased value of THI did not show a significant impact on production and quality of milk in the first third of lactation. In the middle and at the end of lactation THI was in significant negative correlation with production and quality of milk (Table 2). The average amount of milk, milk fat and protein were statistically significantly lower in the middle and at the end of lactation during the action of heat stress (Table 3).
Table 2. The importance of correlation coefficient between THI and the quantity and quality of milk.
Milk yield, fat and protein during lactation THI Significance Milk yield (L) 1st third of lactation -0.139 p>0.05 Milk yield (L) 2nd third of lactation -0.466 p<0.01 Milk yield (L) 3rd third of lactation -0.570 p<0.01
Milk fat (%) 1st third of lactation -0.123 p>0.05
Milk fat (%) 2nd third of lactation -0.383 p<0.01 Milk fat (%) 3rd third of lactation -0.760 p<0.01 Milk protein (%) 1st third of lactation -0.188 p>0.05 Milk protein (%) 2nd third of lactation -0.619 p<0.01 Milk protein (%) 3rd third of lactation -0.605 p<0.01
Table 3. Average milk production and quality in various stage of lactation and THI condition.
Milk yield, fat and protein during lactation THI<72 THI>72 Significance Milk yield (L) 1st third of lactation 24.352 23.007 p>0.05 Milk yield (L) 2nd third of lactation 23.102 21.647 p<0.01 Milk yield (L) 3rd third of lactation 19.243 17.871 p<0.01
Milk fat (%) 1st third of lactation 4.526 4.365 p>0.05 Milk fat (%) 2nd third of lactation 3.588 3.549 p>0.05
Milk fat (%)3rd third of lactation 3.634 3.485 p<0.01
Milk protein (%) 1st third of lactation 3.4337 3.359 p>0.05 Milk protein (%) 2nd third of lactation 3.165 3.071 p<0.01 Milk protein (%) 3rd third of lactation 3.131 3.029 p<0.01
thermal stress increases body temperature (Belić et al., 2010). Negative energy balance during heat stress is characterised by a reduced concentration of glucose, whose decline is significantly correlated with the decrease of milk quantity and quality (Cincović et al., 2010). Previous research on a large number of animals showed that season could have a significant impact on the parameters of lactation curve (Strandberg and Lundberg, 1991; Fadlelmoula et al., 2007), but the experiments were carried out in geographic regions that are hotter than Serbia.
Conclusion
Heat stress did not change the level of milk production throughout whole lactation in our environment, and lactation curve did not show more important deviations. Increased value of THI showed a nonsignificant effect on yield and quality of milk in the first third of lactation. In the middle and at the end of lactation THI was significantly negatively correlated with yield and quality of milk. The average amount of milk yield, milk fat and protein percent is statistically significantly lower in the middle and at the end of the lactation during the exposure to heat stress.
References
Belić, B., Cincović, M.R., Stojanović, D., Kovačević, Z., Medić, S., Simić, V. (2010): Hematology parameters and physical response to heat stress in dairy cows. Contemporary Agriculture 59(1-2):161-166.
Bernabucci, U., Lacetera, N., Baumgard, L.H., Rhoads, R.P., Ronchi, B., Nardone, A. (2010): Metabolic and hormonal acclimation to heat stress in domestic ruminants. Animal 4(7):1167-1183.
Calamari, L., Maianti, M.G., Calegari, F., Abeni, F., Stefanini, L. (1997): Variazioni dei parametric lattodinamografici nel periodo estivo in bovine in fasi diverse di latazzione. Procceding of congress nazionale S.I.S.Vet, LI:57-68.
Cincović, M.R., Belić, B. (2009): Uticaj termalnog stresa krava na količinu i kvalitet proizvedenog mleka. Veterinarski žurnal Republike Srpske 9(1):53-56.
Cincović, M.R., Belić, B., Stojanović, D., Kovačević, Z., Medić, S., Simić, V. (2010): Metabolic profile of blood and milk in dairy cows during heat stress. Contemporary Agriculture 59(1-2):167-172. Dikmen, S., Hansen, P.J. (2009): Is the temperature-humidity index the best indicator of heat stress in
lactating dairy cows in a subtropical environment? J. Dairy Sci. 92:109-116.
Fadlelmoula, A.A., Yousif, I.A., Abu Nikhaila, A.M (2007): Lactation curve and persistency of crossbred dairy cows in the Sudan. Journal of Applied Sciences Research 3(10):1127-1133. Ferris, T.A., Mao, I.L., Anderson, C.R. (1985): Selecting for lactation curve and milk yield in dairy
cattle. J. Dairy Sci. 68(6):1438-1448.
Hristov, S., Stanković, B., Joksimović-Todorović, M., Bojkovski, J., Davidović, V. (2007): Uticaj toplotnog stresa na proizvodnju mlečnih krava. Zbornik naučnih radova Instituta PKB Agroekonomik 13(3-4):47-54.
Johnson, H.D. (1987): Bioclimate effects on growth, reproduction and milk production. In: Johnson, H.D. (Ed.), Bioclimatology and the adaptation of livestock. Elsevier, Amsterdam, pp. 35-57. Shehab-El-Deen, M.A.M.M., Fadel, M.S., Van Soom, A., Saleh, S.Y., Maes, D., Leroy, J.L.M.R.
Spiers, D.E., Spain, J.N., Sampson, J.D., Rhoads, R.P. (2004): Use of physiological parameters to predict milk yield and feed intake in heat-stressed dairy cows. J. Therm. Biol. 29(7-8):759-764. Strandberg, E., Lundberg, C. (1991): A note on the estimation of environmental effects on lactation
curves. Anim. Prod. 53(3):399-402.
West, J.W. (2003): Effects of heat-stress on production in dairy cattle. J. Dairy Sci. 86:2131-2144.
Received: November 17, 2010 Accepted: March 10, 2011
UTICAJ VREDNOSTI THI-INDEKSA U RAZLIČITIM PERIODIMA LAKTACIJE NA KVALITET MLEKA I KARAKTERISTIKE
LAKTACIONE KRIVE
Marko R. Cincović*, Branislava M. Belić, Bojan D. Toholj, Ivan V. Radović i Bojana R. Vidović
Univerzitet u Novom Sadu, Poljoprivredni fakultet, Departman za veterinarsku medicinu i Departman za stočarstvo,
Trg Dositeja Obradovića 8, 21000 Novi Sad, Srbija
R e z i m e
U ogled je ušlo 90 krava. Krave su birane prema momentu telenja, tako da se kod 30 krava prva trećina laktacije odvijala u letnjem periodu (G1), kod 30 krava se druga trećina laktacije odvijala u letnjem periodu (G2), a kod poslednjih 30 krava poslednja trećina laktacije je bila u letnjem periodu (G3). THI je bio između 72 i 82 što ukazuje na postojanje stresa srednjeg intenziteta. Toplotni stres, bez obzira na period laktacije u kojem deluje, ne dovodi do pada proizvodnje mleka, procenta mlečne masti i procenta proteina na nivou cele laktacije. Korelacija ne postoji između THI i proizvodnje i kvaliteta mleka na nivou cele laktacije. Toplotni stres nema značajan uticaj na parametre laktacione krive, osim na momenat postizanja pika laktacije, koji se dešava kasnije kada su krave u toplotnom stresu. Povišena vrednost THI ne pokazuje značajan uticaj na proizvodnju i kvalitet mleka u prvoj trećini laktacije. U sredini i na kraju laktacije THI je u značajnoj negativnoj korelaciji sa proizvodnjom i kvalitetom mleka. Prosečna količina mleka, mlečne masti i proteina statistički je značajno niža u sredini i na kraju laktacije tokom delovanja toplotnog stresa.
Ključne reči: toplotni stres, mlečne krave, proizvodnja mleka, mlečna mast, proteini mleka, laktaciona kriva.
Primljeno: 17. novembra 2010. Odobreno: 10. marta 2011.