Hawksbill Turtles (
Eretmochelys imbricata
) in Brazilian
Waters
Maira C. Proietti1*, Julia Reisser2,3, Luis Fernando Marins4, Clara Rodriguez-Zarate5, Maria A. Marcovaldi6, Danielle S. Monteiro1,7, Charitha Pattiaratchi2, Eduardo R. Secchi1
1Instituto de Oceanografia, Universidade Federal do Rio Grande, Rio Grande, Rio Grande do Sul, Brazil,2Oceans Institute and School of Civil, Environmental and Mining Engineering, The University of Western Australia, Perth, Western Australia, Australia,3Wealth from Oceans Flagship, Commonwealth Scientific and Industrial Research Organisation, Floreat, Western Australia, Australia,4Instituto de Cieˆncias Biolo´gicas, Universidade Federal do Rio Grande, Rio Grande, Rio Grande do Sul, Brazil,5School of Biological Sciences, Flinders University, Adelaide, South Australia, Australia,6Fundac¸a˜o Pro´-Tamar, Praia do Forte, Bahia, Brazil,7Nu´cleo de Educac¸a˜o e Monitoramento Ambiental, Rio Grande, Rio Grande do Sul, Brazil
Abstract
Understanding the connections between sea turtle populations is fundamental for their effective conservation. Brazil hosts important hawksbill feeding areas, but few studies have focused on how they connect with nesting populations in the Atlantic. Here, we (1) characterized mitochondrial DNA control region haplotypes of immature hawksbills feeding along the coast of Brazil (five areas ranging from equatorial to temperate latitudes, 157 skin samples), (2) analyzed genetic structure among Atlantic hawksbill feeding populations, and (3) inferred natal origins of hawksbills in Brazilian waters using genetic, oceanographic, and population size information. We report ten haplotypes for the sampled Brazilian sites, most of which were previously observed at other Atlantic feeding grounds and rookeries. Genetic profiles of Brazilian feeding areas were significantly different from those in other regions (Caribbean and Africa), and a significant structure was observed between Brazilian feeding grounds grouped into areas influenced by the South Equatorial/North Brazil Current and those influenced by the Brazil Current. Our genetic analysis estimates that the studied Brazilian feeding aggregations are mostly composed of animals originating from the domestic rookeries Bahia and Pipa, but some contributions from African and Caribbean rookeries were also observed. Oceanographic data corroborated the local origins, but showed higher connection with West Africa and none with the Caribbean. High correlation was observed between origins estimated through genetics/rookery size and oceanographic/rookery size data, demonstrating that ocean currents and population sizes influence haplotype distribution of Brazil’s hawksbill populations. The information presented here highlights the importance of national conservation strategies and international cooperation for the recovery of endangered hawksbill turtle populations.
Citation:Proietti MC, Reisser J, Marins LF, Rodriguez-Zarate C, Marcovaldi MA, et al. (2014) Genetic Structure and Natal Origins of Immature Hawksbill Turtles (Eretmochelys imbricata) in Brazilian Waters. PLoS ONE 9(2): e88746. doi:10.1371/journal.pone.0088746
Editor:Valerio Ketmaier, Institute of Biochemistry and Biology, Germany
ReceivedNovember 4, 2013;AcceptedJanuary 10, 2014;PublishedFebruary 18, 2014
Copyright:ß2014 Proietti et al. This is an open-access article distributed under the terms of the Creative Commons Attribution License, which permits unrestricted use, distribution, and reproduction in any medium, provided the original author and source are credited.
Funding:Scholorship and travel funds were provided to MCP by Coordenac¸a˜o de Aperfeic¸oamento de Pessoal de Nı´vel Superior, http://www.capes.gov.br/. Fieldwork and analyses were funded by The Rufford Foundation, http://www.rufford.org/, Grant#8110-2. The funders had no role in study design, data collection and analysis, decision to publish, or preparation of the manuscript.
Competing Interests:The authors have declared that no competing interests exist. * E-mail: [email protected]
Introduction
After hatching, sea turtles often present an epipelagic stage characterized by wide dispersal, many times over national boundaries and even oceans [1]. This stage is generally followed by recruitment to coastal areas with adequate conditions for feeding, resting and development [2]. Understanding how populations connect and how animals disperse from rookeries to feeding areas is a challenging task, but is essential for setting priorities and defining management strategies for conservation [3]. In this context, molecular genetic data have been fundamental in obtaining relevant information on interpopulational connectivity, migrations and natal origins of marine turtle feeding populations [4–7].
Feeding grounds are generally composed of individuals originat-ing from a mixture of sources, beoriginat-ing therefore known as ‘‘mixed stocks’’. Mitochondrial DNA (mtDNA) haplotype frequencies can
approaches using oceanographic and genetic information are being increasingly applied to studies of the dispersal and migration patterns of sea turtles (e.g. [7,13–15]).
Understanding migratory pathways and origins of animals at their non-reproductive stages is important for determining how impacts such as direct harvest, habitat degradation, and bycatch in fisheries can be shared by seemingly separate populations that are in fact connected [3]. This is of special significance for the critically endangered [16] hawksbill turtle (Eretmochelys imbricata), since the tortoiseshell commerce is still debated by the Convention on International Trade in Endangered Species (CITES) [17]. Due to the uncertainty of how a harvest/other impacts in one area will affect other rookeries and feeding areas, effective conservation and/or sustainable use strategies must be based on the extent of connectivity between hawksbill populations; this type of research is therefore a priority for this highly migratory and endangered species [18].
Important hawksbill nesting and feeding areas exist along the Brazilian coast [19–23], but the connections between them are still largely unknown [24]. Here, we decrease this gap by describing 740 bp mtDNA haplotypes of hawksbills from five Brazilian feeding aggregates, assessing genetic structure, and estimating natal origins through many-to-many MSA analysis. In addition, we verify the influence of ocean currents on connectivity, inferring origins by analyzing surface drifter data for the Atlantic.
Materials and Methods
Ethics statement
According to Normative Instruction 154/March 2007, all capture, tagging, sampling and transport of biological samples of wild animals for scientific purposes must have approval from Instituto Chico Mendes de Conservac¸a˜o da Biodiversidade (ICMBio) SISBIO committees. This study was approved by the Instituto Chico Mendes de Conservac¸a˜o da Biodiversidade, and
conducted under SISBIO licenses #225043, #14122, and
#159622. All animal handling was performed by trained personnel, following widely accepted and ethical protocols described in [25]. When capturing live turtles, the following measures were taken to alleviate stress: 1) turtles were kept out of the water for a maximum of ten minutes; 2) work was performed in a shaded area; and 3) animals were released at the same location of capture.
Sampling and laboratory analyses
Skin samples were obtained from 157 immature hawksbills at five areas in Brazilian waters ranging from equatorial to temperate latitudes: (1) Sa˜o Pedro and Sa˜o Paulo Archipelago (SPSP, n = 12); (2) Abrolhos National Marine Park (Abrolhos, n = 65), (3) Ceara´ state coast (Ceara´, n = 23); (4) Bahia state coast (Bahia, n = 32); and (5) South Brazil region, which combines the Arvoredo Marine Biological Reserve (n = 6) and Cassino Beach (n = 19). The Arvoredo and Cassino areas were grouped due to small sample size and geographical isolation regarding the other feeding grounds. Two skin samples with approximately 4–5 mm were collected from the fore flippers of each turtle using disposable biopsy punches, and preserved in absolute alcohol. Samples were taken from turtles hand-captured by divers at SPSP, Abrolhos, and Arvoredo, as well as from individuals incidentally caught in fishing nets or stranded on beaches (alive or dead) at Ceara´, Bahia, and Cassino Beach. All animals were measured (Curved Carapace Length – CCL), and live turtles were tagged with Inconel Tags (National Tag and Band Co.) using standard techniques [26,27] prior to release. Sampling locations are shown in Figure 1.
Samples were macerated and kept at 37uC in a lysis buffer until complete digestion. DNA was extracted using Genomic DNA Extraction Kits (Norgen Biotek) or a standard phenol:chloroform method [28]. mtDNA control region fragments of approximately 850 bp were amplified via Polymerase Chain Reaction (PCR) using primers LCM15382/H950 [29], as follows: 59at 94uC; 36
Figure 1. Locations of genetically described hawksbill populations in the Atlantic.Red triangles = rookeries, black squares = feeding grounds, *study areas described in this work. Rookeries: BS = Bahia/Sergipe, PI = Pipa, PP = Principe, BB = Barbados, GU = Guadeloupe, AB = Antigua & Barbuda, UV = U.S. Virgin Islands, PR = Puerto Rico, DR = Dominican Republic, CR = Costa Rica, NI = Nicaragua, CU = Cuba, MX = Mexico. Feeding grounds: SP = Sa˜o Pedro and Sa˜o Paulo, NR = Noronha/Rocas, CE = Ceara´ coast, BA = Bahia coast, AP = Abrolhos Park, SB = South Brazil, PP = Principe, CV = Cape Verde, UV = U.S. Virgin Islands, PR = Puerto Rico, DR = Dominican Republic, TC = Turks & Caicos, BH = Bahamas, FL = Florida, CU = Cuba, CY = Cayman Islands, MX = Mexico, TX = Texas.
cycles of 300 at 94uC, 300 at 50uC, 19 at 72uC; 109 at 72uC. Samples were purified with Illustra GFX purification kits (GE Healthcare) and sequenced in both directions through capillary electrophoresis using the Applied BiosystemsH 3130 Genetic Analyzer (Valid Biotechnology, Universidade Federal de Minas Gerais, Brazil).
Haplotypes and diversities
Sequences were aligned and cropped to 740 bp using Clustal X 2.0 [30], and classified according to GenBankH and the Atlantic Ocean hawksbill haplotype database (under construction, Abreu-Gobrois pers. comm.). We used 740 bp haplotypes for genetic structure analyses between Brazilian populations, but for compar-ison with all other Atlantic Ocean feeding grounds and rookeries described in literature, a second cropping to 382 bp (original classification, [31]) was necessary. Arlequin 3.5 [32] was used to assess haplotype (h) and nucleotide (p) diversities of the study areas.
Genetic structure
Genetic divergence between feeding populations was verified in Arlequin 3.5 through pairwise fixation indices F-st and Q-st, respectively using haplotype frequencies only and a Tamura-Nei model of nucleotide substitution (as determined through jMo-delTest 0.1.1, [33]). Besides our study areas, the following feeding aggregations were included in genetic structure analyses: (1) Fernando de Noronha/Rocas Atoll, Brazil (referred to as Noronha, n = 94 samples); (2) Sa˜o Tome´ Island, Sa˜o Tome´ and Principe (n = 80); (3) Boavista Island, Cape Verde (n = 28); (4) Buck Island, U.S. Virgin Islands (n = 69); (5) Mona Island, Puerto Rico (n = 256); (6) Dominican Republic (n = 90); (7) Turks and Caicos (n = 38); (8) Bahamas (n = 78); (9) Cuba (n = 210); (10) Cayman Islands (n = 92); (11) Yucata´n, Mexico (n = 21); (12) Texas coast, U.S.A. (n = 42); and (13) Florida, U.S.A. (n = 106) ([4–7,24,34– 38], for locations see Figure 1). Analysis of Molecular Variance (AMOVA) was implemented to verify ocean basin structure by grouping Atlantic feeding grounds into Brazilian, African, Caribbean and Gulf of Mexico regions. To identify regional structure within Brazilian waters, we divided feeding grounds into two groups: areas influenced mainly by the South Equatorial/ North Brazil Current (SPSP, Noronha and Ceara´) and those influenced by the Brazil Current (Bahia, Abrolhos and South Brazil).
Natal origins
A many-to-many MSA using the ‘‘mixstock’’ package in R [9,39] was performed to estimate source contributions to the study areas in Brazil (feeding ground-centric), as well as the destinations of animals hatched at Brazilian rookeries (rookery-centric). We included all above-cited Atlantic foraging grounds (18 areas, n = 1361 individuals) and thirteen rookeries (n = 875) in this metapopulational analysis: (1) Bahia/Sergipe coasts (referred to as Bahia, n = 92); (2) Pipa Beach (referred to as Pipa, n = 27); (3) Principe Island (n = 20); (4) Barbados (n = 84); (5) Trois Island, Guadeloupe (n = 74); (6) Jumby Bay, Antigua and Barbuda (n = 70); (7) Buck Island, U.S. Virgin Islands (n = 67); (8) Mona Island, Puerto Rico (n = 93); (9) Jaragua and Saona, Dominican Republic (n = 48); (10) Doce Leguas, Cuba (n = 70); (11) Tortuguero, Coast Rica (n = 60); (12) Pearl Cays, Nicaragua (n = 95); (13) Yucata´n and Quintana Roo, Mexico (n = 73) ([4,5,35,38,40–44], locations shown in Figure 1). Nesting popula-tion size (estimated number of females per nesting season) of each area was included in this analysis as an ecological covariate, following [9]. One MCMC was implemented for each rookery, with chain lengths of 20000, and one half chain discarded as
‘‘burn-in’’. Gelman-Rubin convergence factors varied from 1.0 to 1.04 (average 1.02), indicating convergence. Hybrid haplotype EixCc BR3, from the Bahia rookery, was maintained in the MSA since it was also observed at feeding areas; orphan haplotypes were excluded.
Lagrangian drifter data was also used to infer on the possible role of ocean currents on the dispersal of hatchlings, following [15]. For such, we downloaded surface drifter data freely available from NOAA’s Global Drifter Program (www.aoml.noaa. gov/ envids/gld). Areas with size 4u64u(latitude and longitude) were
delineated around all rookeries considered in MSA (n = 13), and the number of drifters that passed through them and reached the Brazilian foraging grounds was counted (drifters with less than three months of transmission were excluded). Feeding areas with similar drifter patterns were grouped into target regions for simplification: 1) SPSP; 2) Noronha and Ceara´; and 3) Bahia, Abrolhos and South Brazil. Based on these drifter counts and rookery population size information (females/nesting season), the probability that a turtle arriving at the target region originated from a previously characterized rookery was calculated under a Bayesian framework (for method details refer to [15]).
Finally, natal origin estimates inferred by genetic/rookery size and drifters/rookery size data were compared to better assess the influence of ocean currents on feeding grounds aggregations in Brazil. We evaluated this correlation through a Mantel test implemented with the package ‘‘vegan’’ in R [39,45], and performed linear regression by regressing log-transformed pro-portions between genetic and drifter profiles.
Results
Haplotypes and diversities
Haplotype diversities (h) of Atlantic feeding areas ranged from 0.14360.052 at Principe to 0.76160.035 at Turks and Caicos, with averagehof 0.53860.050. Brazilian feeding ground diversity ranged from 0.21560.052 at Abrolhos to 0.64460.124 at SPSP; average hwas 0.41860.088. We found ten 740 bp haplotypes, with high occurrence (almost 80%) of haplotype A01, followed by a frequency of approximately 8% of A62, and less than 4% for all other haplotypes (Table 1). We found one new haplotype (A92) and four hawksbill x loggerhead (Caretta caretta) hybrid sequences (EixCcBR3). When considering only the 382 bp fragment, the number of haplotypes dropped to eight. Short haplotype frequencies (382 bp) of all Atlantic Ocean populations considered in our study can be visualized in Figure 2 and Table S1. Table 2 shows haplotype diversities for all genetically described hawksbill populations in the Atlantic, along with biological information of areas: Curved Carapace Length (CCL) of immature animals at feeding grounds (Loureiro N, Shaver D pers comm, [6,19,34,36,46– 52]) and population size of rookeries [17,22,23,44,53–57].
Genetic structure
We detected overall significant genetic difference between and within nesting and feeding populations in the Atlantic Ocean (p,0.001).F-st andQ-st values show that feeding aggregations are
northeastern coast of Brazil, and the southernmost hawksbill occurrence area, South Brazil. Structure was significant (F -st = 0.581,p,0.001) between areas under influence of the South Equatorial/North Brazil Current (SPSP, Noronha and Ceara´) and those influenced by the Brazil Current (Bahia, Abrolhos and South Brazil).
Natal origins
Many-to-many MSA estimates suggest that the feeding aggre-gations in Brazil are mostly composed of animals originating from domestic rookeries, but also present some distant origins (Figure 3a). The Brazilian rookeries Bahia and Pipa were the predominant sources, with respective contributions of approxi-mately 12% and 28% for SPSP, 30% and 22% for Noronha, 22% and 18% for Ceara´, 36% and 17% for Bahia, 21% and 28% for Abrolhos, 34% and 30% for South Brazil. Rookeries from Africa and the Caribbean showed generally lower but noteworthy contributions: Principe, Barbados and Cuba contributed respec-tively 8%, 10% and 14% to Noronha; Barbados, Puerto Rico and Cuba 12%, 9% and 13% to SPSP; Barbados and Cuba 12% and 15% to Ceara´, 9% and 10% to Bahia, 8% and 13% to Abrolhos. Rookery-centric MSA results for the Brazilian rookeries of Bahia and Pipa shows that these nesting areas contribute mainly to the domestic feeding populations: respectively 6% and 16% to SPSP; 12% and 9% to Ceara´; 20% and 10% to Bahia; 11% and 17% to Abrolhos; 18% and 18% to South Brazil; and 10% and
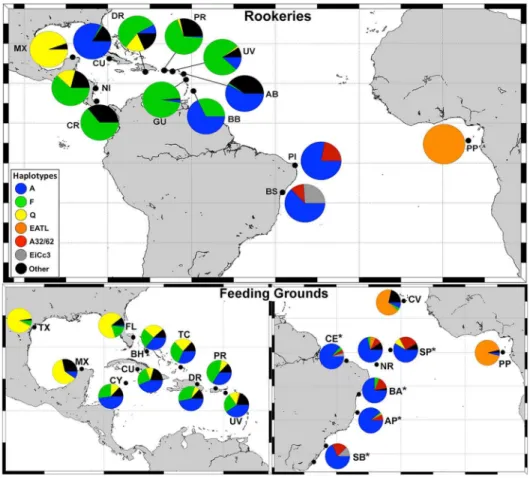
Figure 2. Main haplotype frequencies of genetically described populations in the Atlantic.*study areas described in this work. Rookeries: BS = Bahia/Sergipe, PI = Pipa, PP = Principe, BB = Barbados, GU = Guadeloupe, AB = Antigua & Barbuda, UV = U.S. Virgin Islands, PR = Puerto Rico, DR = Dominican Republic, CR = Costa Rica, NI = Nicaragua, CU = Cuba, MX = Mexico. Feeding grounds: SP = Sa˜o Pedro and Sa˜o Paulo, NR = Noronha/Rocas, CE = Ceara´ coast, BA = Bahia coast, AP = Abrolhos Park, SB = South Brazil, PP = Principe, CV = Cape Verde, UV = U.S. Virgin Islands, PR = Puerto Rico, DR = Dominican Republic, TC = Turks & Caicos, BH = Bahamas, FL = Florida, CY = Cayman Islands, MX = Mexico, TX = Texas. doi:10.1371/journal.pone.0088746.g002
Table 1.Haplotype frequencies (740 bp) for Brazilian feeding grounds.
Brazilian feeding areas
Haplotypes SPSP Ceara´ coastBahia coast Abrolhos Park
South Brazil
A01/A 7 20 24 58 17
A09/F 0 0 2 1 0
A11/F 0 1 0 0 0
A23/Q 1 0 0 0 0
A24/Q 0 0 0 1 0
A32/f 0 0 3 2 0
A62 3 1 2 3 5
A76 0 0 1 0 0
A92 1 0 0 0 0
EixCcBR3 0 1 0 0 3
n 12 23 32 65 25
Shorter (360 bp) haplotype equivalent is given when available.
SPSP = Sa˜o Pedro and Sa˜o Paulo, South Brazil = Arvoredo Reserve/Cassino Beach.
12% to Noronha (Figure 3b). All other contributions were lower than 5%. MSA outputs for overseas feeding grounds and rookeries (not discussed in this study) are presented in Figures S1 and S2.
Of the available drifter data, a total of 469 drifters passed through the Atlantic rookeries, of which 388 transmitted for over three months. Of these, 37 drifters arrived at our three target areas
in Brazil, originating from the Bahia, Pipa and Principe rookeries (trajectories shown in Figure 4). Displacements from rookeries to Brazilian feeding areas were most likely by means of the North Brazil Current for drifters leaving the Pipa rookery, North Brazil/ Brazil Current for those leaving Bahia, and South Equatorial Current for drifters from Principe. No drifters from the Caribbean Table 2.Haplotype diversities and biological information of AtlanticE. imbricatapopulations.
Feeding areas N hdiversity CCL range (mean)
Brazil
SPSP 12 0.64460.128 30–75 (53.7)a
Noronha/Rocas (NR) 94 0.51660.063 26.5–75.5 (52.3)b
Ceara´ coast (CE) 23 0.24960.116 29–73.2 (37.9)a
Bahia coast (BA) 32 0.43260.113 21–63 (37.7)a
Abrolhos Park (AP) 65 0.21360.056 24.5–58.5 (36.1)a
South Brazil (SB) 25 0.43460.103 30–60 (41)a
West Africa
Principe Island (PP) 80 0.14360.052 18–87 (41.5)c
Boavista Island (CV) 28 0.52960.105 27–62.8 (42.3)d
Caribbean
Buck Island (UV) 69 0.75760.035 27.1–70.5 (43.2)e
Mona Island (PR) 256 0.68960.018 21.5–97* (21.5–32*)f
Dominican Republic (DR) 90 0.66860.033 21–74.4* (26.8–37.4*)g
Turks and Caicos (TC) 38 0.76160.035 19.4–93.0 (41.6)h
Bahamas (BH) 78 0.73960.023 24.3–71.3 (48.8)i
Cuba pooled (CU) 210 0.72860.022 22–66 (35.6)j
Grand/Little Cayman (CY) 92 0.68760.035 20.5–62.6 (32.6)k
Rio Lagartos/Yucata´n (MX) 21 0.60460.111 21.5–68.5* (27–48*)l
Texas (TX) 42 0.18060.076 7.0–35 (-)m
Florida (FL) 94 0.59060.049 35.7–83.9(56.6)n
Rookeries N hdiversity N females/season
Brazil
Bahia/Sergipe (BS) 121 0.53060.043 419*o
Pipa (PI) 27 0.35960.090 376p
West Africa
Principe Island (PP) 20 0.00060.000 20*q
Caribbean
Barbados (BB) 84 0.44160.037 504r
Trois Island (GU) 74 0.08060.063 55s
Jumby Bay (AB) 52 0.50460.026 113t
Buck Island (UV) 67 0.43460.070 183q
Mona Island (PR) 93 0.60060.042 340*u
Jaragua/Saona (DR) 48 0.64260.064 29*v
Doce Leguas (CU) 70 0.21360.063 563q
Tortuguero (CR) 60 0.62760.059 10w
Pearl Cays (NI) 95 0.61260.044 61q
Yucatan (MX) 73 0.36360.131 668q
CCL range is presented for feeding areas; mean number of females per nesting season is given for rookeries.
aThis study,bBellini 1996,cLoureiro N (pers comm),dMonzo´n-Argu¨ello 2010,eBoulon 1994,fvan Dam & Diez 1998,gLeo´n & Diez 1999,hRichardson et al. 2009,iBjorndal &
Bolten 2010,jMoncada et al. 2012,kBlumenthal et al. 2009,lGardun˜o-Andrade 2000,mShaver D (pers comm),nWood et al. 2013,oMarcovaldi et al. 2007,pSantos et al.
2013,qMortimer & Donnelly 2008,rBeggs et al. 2007,sKamel & Decroix 2009,tRichardson et al. 2006,uDiez & van Dam 2012,vRevuelta et al. 2012,wTro¨eng et al.
2005. *for feeding grounds: CCL calculated from SCL (SCL = 0.939 * CCL - 0.154, Wabnitz & Pauly 2008); for rookeries: number of females calculated from number of nests (Nfemales = Nnests/4).
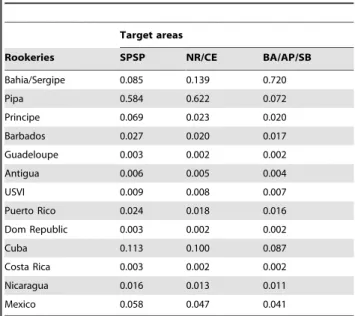
arrived at the Brazilian coastline (see Figure S3). When estimating natal origins of hawksbills at our target areas through drifter/ population size data, significant contributions were: Pipa (58%), Bahia (9%) and Cuba (11%) for SPSP; Pipa (62%), Bahia (14%) and Cuba (10%) for Noronha/Ceara´; and Bahia (72%) for Abrolhos/Bahia/South Brazil (Table 4). Correlation between natal origins as calculated by MSA (which included genetic/ rookery size data) and drifters/rookery size information was significant (Mantel test, r= 0.791, p,0.05; linear regression r= 0.560,p,0.01; Figure 5).
Discussion
Haplotypes and diversities
As illustrated in Figure 2, several haplotypes observed at Brazilian feeding areas are common at rookeries located in the Caribbean (A01/A, A09/F, A11/F, A24/Q), Brazil (A32, A62, EixCcBR3) and Africa (EATL). We also detected two orphan haplotypes (i.e. not seen at rookeries): A76 and A92 (the latter previously undescribed); as noted in [35,58], the presence of orphan haplotypes indicates the need for further sampling of rookeries. Mean haplotype diversity of feeding areas in Brazil was 0.413, which is higher than the mean diversity of the two described feeding grounds off West Africa (h= 0.335), but lower than the diversity of ten populations in the Caribbean (h= 0.647). These low diversities could be a result of natal origins from fewer, less diverse sources when compared to the Caribbean, where a large number of rookeries with relatively high diversities are present. SPSP and Noronha, located respectively around 350 and 1000 km off northeast Brazil, presented the highest haplotype diversities within the sampled Brazilian feeding grounds. Bass et al. (2006) suggest that feeding areas located at the confluence of several current systems present higher haplotype diversities [59]; Vilac¸a et
al. (2013) propose that Noronha’s location, influenced by both the North Brazilian and South Equatorial Currents, is a possible explanation for its elevated diversity [24]. Our results support the hypothesis that ocean currents influence diversity since SPSP, located near Noronha, showed highest diversity values among all Brazilian feeding grounds.
Genetic structure
Our study suggests regional genetic structuring within the Atlantic, between (i) foraging areas off Brazil, Africa and the Caribbean, a pattern that has been previously noted [24], and (ii) feeding areas in the Gulf of Mexico and the remainder within the Caribbean. Although turtles disperse widely, they can be constrained to certain regions due to factors such as geographical distance, rookery population size, animal behavior and surface ocean currents. For instance, the Gulf of Mexico presents a distinct current pattern (as shown in Figure S3) that could retain animals within the region. In a general manner differentiation between Brazilian feeding grounds was not pronounced, but significant structuring was observed when grouping Brazilian populations into groups influenced by different ocean currents. This suggests that migration patterns are somewhat limited, and that genetic composition could be affected by the different factors noted above. We highlight here the importance of analyzing longer haplotype sequences, which present higher resolution and better detect population structure [40,60]. Although longer haplotypes are being increasingly analyzed, past hawksbill turtle studies mostly characterize 382 bp fragments; it is important that future studies focus on larger fragments to improve our understanding on structure and connectivity of hawksbill populations.
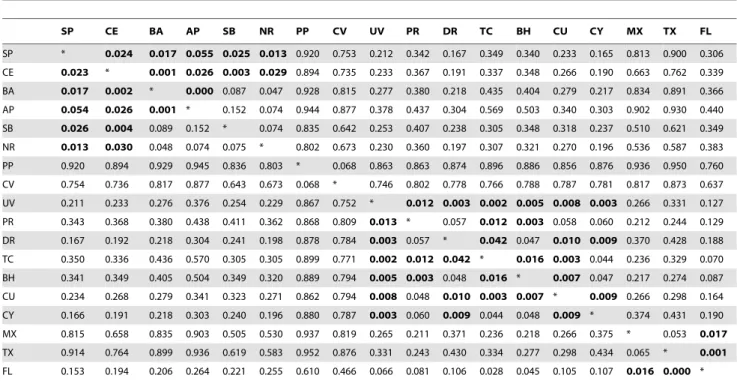
Table 3.PairwiseF-st (above diagonal) andQ-st (below diagonal) values between feeding populations in the Atlantic.
SP CE BA AP SB NR PP CV UV PR DR TC BH CU CY MX TX FL
SP * 0.024 0.017 0.055 0.025 0.013 0.920 0.753 0.212 0.342 0.167 0.349 0.340 0.233 0.165 0.813 0.900 0.306 CE 0.023 * 0.001 0.026 0.003 0.029 0.894 0.735 0.233 0.367 0.191 0.337 0.348 0.266 0.190 0.663 0.762 0.339 BA 0.017 0.002 * 0.000 0.087 0.047 0.928 0.815 0.277 0.380 0.218 0.435 0.404 0.279 0.217 0.834 0.891 0.366 AP 0.054 0.026 0.001 * 0.152 0.074 0.944 0.877 0.378 0.437 0.304 0.569 0.503 0.340 0.303 0.902 0.930 0.440 SB 0.026 0.004 0.089 0.152 * 0.074 0.835 0.642 0.253 0.407 0.238 0.305 0.348 0.318 0.237 0.510 0.621 0.349 NR 0.013 0.030 0.048 0.074 0.075 * 0.802 0.673 0.230 0.360 0.197 0.307 0.321 0.270 0.196 0.536 0.587 0.383 PP 0.920 0.894 0.929 0.945 0.836 0.803 * 0.068 0.863 0.863 0.874 0.896 0.886 0.856 0.876 0.936 0.950 0.760 CV 0.754 0.736 0.817 0.877 0.643 0.673 0.068 * 0.746 0.802 0.778 0.766 0.788 0.787 0.781 0.817 0.873 0.637 UV 0.211 0.233 0.276 0.376 0.254 0.229 0.867 0.752 * 0.012 0.003 0.002 0.005 0.008 0.003 0.266 0.331 0.127 PR 0.343 0.368 0.380 0.438 0.411 0.362 0.868 0.809 0.013 * 0.057 0.012 0.003 0.058 0.060 0.212 0.244 0.129 DR 0.167 0.192 0.218 0.304 0.241 0.198 0.878 0.784 0.003 0.057 * 0.042 0.047 0.010 0.009 0.370 0.428 0.188 TC 0.350 0.336 0.436 0.570 0.305 0.305 0.899 0.771 0.002 0.012 0.042 * 0.016 0.003 0.044 0.236 0.329 0.070 BH 0.341 0.349 0.405 0.504 0.349 0.320 0.889 0.794 0.005 0.003 0.048 0.016 * 0.007 0.047 0.217 0.274 0.087 CU 0.234 0.268 0.279 0.341 0.323 0.271 0.862 0.794 0.008 0.048 0.010 0.003 0.007 * 0.009 0.266 0.298 0.164 CY 0.166 0.191 0.218 0.303 0.240 0.196 0.880 0.787 0.003 0.060 0.009 0.044 0.048 0.009 * 0.374 0.431 0.190 MX 0.815 0.658 0.835 0.903 0.505 0.530 0.937 0.819 0.265 0.211 0.371 0.236 0.218 0.266 0.375 * 0.053 0.017 TX 0.914 0.764 0.899 0.936 0.619 0.583 0.952 0.876 0.331 0.243 0.430 0.334 0.277 0.298 0.434 0.065 * 0.001 FL 0.153 0.194 0.206 0.264 0.221 0.255 0.610 0.466 0.066 0.081 0.106 0.028 0.045 0.105 0.107 0.016 0.000 *
Bold indicates lack of significant difference (p.0.05). SP = Sa˜o Pedro and Sa˜o Paulo, CE = Ceara´ coast, BA = Bahia coast, AP = Abrolhos Park, SB = South Brazil, NR = Noronha/Rocas, PP = Principe, CV = Cape Verde, UV = U.S. Virgin Islands, PR = Puerto Rico, DR = Dominican Republic, TC = Turks & Caicos, BH = Bahamas, FL = Florida, CY = Cayman Islands, MX = Mexico, TX = Texas, FL = Florida.
Natal origins
Many-to-many MSA showed that feeding aggregations in Brazil are generally composed of animals from limited sources, being mostly linked to the proximal Brazilian rookeries. Results also indicated that in some cases connectivity extends to rookeries located in the Caribbean and West Africa. Origins calculated from drifter data support main contributions from Bahia and Pipa, with almost all drifters arriving from national rookeries to the Brazilian feeding grounds, via the North Brazil and Brazil currents. The only other work to describe origins of hawksbills at a Brazilian feeding ground (Noronha/Rocas) also shows that main origins are from national sources, with lower contributions from other regions [24].
Our rookery-centric MSA, including the five populations investigated in this study plus the Noronha/Rocas feeding ground, decreased contributions of the Bahia rookery to ‘‘unknown’’ feeding grounds from almost 60% (reported in [24]) to less than
10%, and showed strong connections to feeding grounds in national waters. This is likely due to the detection at our feeding areas of a hybrid hawksbill x loggerhead haplotype (EixCc3 BR3), present in 18% of samples from the Bahia rookery [41]. This haplotype had not been registered at feeding grounds sampled by [24], but we report its occurrence at Ceara´ (4% frequency) and in the temperate waters of South Brazil (16% frequency) [61]. This demonstrates the importance of thorough genetic analyses of populations and the use of metapopulational approaches (ocean basin scale) in animal populations that are demographically connected between distant geographic localities.
Natal origin estimates also showed connection between West Africa and Brazil, with 8% contribution from Principe to Noronha. This is expected since the EATL haplotype, present with 100% frequency at the Principe rookery [35], was encountered at this feeding area. However, drifter tracks actually show a higher connection with West Africa by means of the South
Figure 3. Many-to-many mixed stock analysis estimates for Brazilian populations.(a) shows feeding ground-centric estimates, and (b) rookery-centric estimates. MSA outputs for all other areas are shown in Figures S1 and S2. BS = Bahia/Sergipe, PI = Pipa, PP = Principe, BB = Barbados, GU = Guadeloupe, AB = Antigua & Barbuda, UV = U.S. Virgin Islands, PR = Puerto Rico, DR = Dominican Republic, CR = Costa Rica, NI = Nicaragua, CU = Cuba, MX = Mexico, SP = Sa˜o Pedro and Sa˜o Paulo, CE = Ceara´ coast, BA = Bahia coast, AP = Abrolhos Park, SB = South Brazil, NR = Noronha/Rocas, PP = Principe, CV = Cape Verde, TC = Turks & Caicos, BH = Bahamas, FL = Florida, CY = Cayman Islands, TX = Texas, FL = Florida, UN = Unknown.
Equatorial Current; for example, some drifters at SPSP originated from Principe, but MSA showed no contribution from this rookery to this region as haplotype EATL was not detected. The displacement to the opposite direction via the Equatorial Counter Current is also likely as shown through drifter tracks. Furthermore, hawksbill tag returns have repeatedly evidenced transatlantic movements between these regions [62,63]. Increasing the number of analyzed samples from SPSP and other feeding grounds along the coast would possibly lead to the detection of the EATL haplotype and further evidence the connection between African and Brazilian hawksbill turtle populations.
MSA showed that Caribbean rookeries contributed to all Brazilian feeding grounds except South Brazil. Highest contribu-tions were observed for SPSP, Noronha, and Ceara´, which aggregated animals from up to three Caribbean rookeries. It is hypothesized that as sea turtles grow their feeding habitats become preferentially established near their natal beach [4]. Immature hawksbills sampled at SPSP and Noronha presented larger size classes (Table 2) than those at the other feeding areas in Brazil, possibly indicating that some animals are moving closer to the Caribbean for the onset of reproduction.
The connection between Caribbean and Western South Atlantic green and hawksbill turtle populations has been extensively shown through MSA [13,15,24,64] and tag returns [65]. However, oceanographic data have yet to bring additional evidence to these links. In this study no drifters from Caribbean sources arrived in Brazilian waters, although the opposite displacement occurred. Drifter data are not abundant for every region and the life span of drifters could be too short (,291–
450 d; [66]) to detect this connection. Particle modeling could solve the temporal limitation of drifters, but a study using particle tracking models (dispersal time = one year) also did not reveal any virtual drifter from Caribbean hawksbill rookeries arriving around Brazil [7]; a 5-year particle tracking study from the green turtle
Figure 4. Pathways of drifters passing by Atlantic Ocean rookeries Bahia (a.), Pipa (b.) and Principe (c.).Drifter pathways for the other Atlantic rookeries are shown in Figure S3. Colors indicate drift time (in months). Grey squares = drifter release areas around the rookeries, red circles = Brazilian feeding grounds, grey circles = other Atlantic Ocean feeding grounds. Grey arrows indicate the flow of the major Atlantic Ocean currents: SE = South Equatorial Current, BR = Brazil Current, SA = South Atlantic Current (displaced to the North for illustrative purposes), BG = Benguela Current, NB = North Brazil Current, GU = Guiana Current, CB = Caribbean Current, EC = Equatorial Counter Current, NE = North Equatorial Current, GS = Gulf Stream, NA = North Atlantic Current, CN = Canary Current.
doi:10.1371/journal.pone.0088746.g004
Figure 5. Correlation between genetic and drifter profiles for Brazilian feeding grounds. Genetic profiles are based on log-transformed data of origins from genetic/population size (MSA – x axis) and drifter/population size (y axis) information profiles.
rookery Costa Rica also did not show this connection [13]. Contribution from the Caribbean to Brazil could be overestimated by MSA due to shared haplotypes between rookeries of these regions; on the other hand, MSA estimates might be correct but animals are undergoing movements undetected by drifters/ particle models (e.g. transport by coastal currents in shallow areas or active swimming). Additional genetic characterization of rookeries and feeding areas, as well as further description of animal behavior and oceanographic features on the routes between them, is necessary for resolving this ambiguity.
Although surface drifter patterns did not corroborate MSA origins in all cases, origins calculated by combining drifter data with population size of rookeries (see Table 4) were strongly correlated with MSA estimates. This indicates that ocean currents influence how patterns of hawksbill population genetic structure are shaped in Brazil. Ocean currents apparently play a substantial role in shaping populations in other regions as well; for example, a particle tracking study found significant correlation between particle distribution patterns and natal origin estimates for foraging aggregations in the Caribbean [7]. Restricting MSA to only small turtles, more likely to have recently recruited than larger juveniles that may have already conducted developmental migrations [67], could increase the correlation between natal origins and ocean currents. For allowing this type of meta-analysis, researchers should publish their datasets containing size/haplotype of individual turtles. In light of this suggestion, data from the present work was published in Figshare [68].
The integration of genetic analysis and oceanographic data is a valuable approach to understanding origin and distribution of immature animals; however, there are some caveats inherent to the analyses applied here. Mixed stock analysis may not adequately detect connections between some areas since not all source rookeries are thoroughly characterized, while those that are do not always present highly differentiated haplotype frequencies, leading to high uncertainty [58]. Furthermore, drifter trajectories might not represent the precise pathways of sea turtles, as analyses cannot be limited to hatching seasons due to large reduction of
data, and drifters generally have short life spans and do not consider surface wind drag and turtle behavior/swimming [66]. Despite these caveats, the type of information described above has proven to be quite useful for indicating possible movements and migrations between areas (e.g. [10,15,69,70]). Ocean circulation models are also being increasingly used, and allow choosing the number and lifespan of particles, release periods, and incorporat-ing additional factors such as wind drag and swimmincorporat-ing power of hatchlings [71,72]. However, they are also limited due to uncertainties associated with simulation of turtle behavior and spatio-temporal resolution unable to capture fine-scale features [73]. An ideal scenario would integrate several connectivity indicators; for achieving this, other means of linking populations should continue to be investigated. Stable isotope analysis, for example, is currently being used to distinguish populations and unveil migratory origins by comparing isotopic signatures of animals to predominant regional isoscapes [74–76].
Implications for hawksbill conservation
How populations connect, and how impacts on any particular population will affect others, are fundamental questions for the conservation of endangered, highly migratory animals. Hawksbill turtles are currently listed as critically endangered in the IUCN red list [16], and listed on Appendix I of the Convention on the International Trade in Endangered Species. Nevertheless, hawks-bill products continue to be commercially valuable and in demand in some regions, and debate has arisen as to whether or not harvesting should be permitted, and at what levels such harvest would be sustainable [4,77–79]. Some studies have tackled these issues and concluded, for example, that exploiting turtles in Caribbean feeding areas would affect rookeries throughout the entire region [4,79].
Although Brazilian populations have also been historically depleted due to harvest for consumption and fisheries bycatch, nesting populations are currently showing encouraging increases [22,23]. Our analyses indicate that mixed stocks are composed mostly of animals that originate from Brazilian rookeries, which is a fortunate scenario since a large sea turtle conservation project (Project Tamar-ICMBio) has been underway in Brazil since 1980 [80] and the need for transnational conservation policies is somewhat reduced. Despite this encouraging outlook, it is not yet known if immature feeding population numbers are also rising, and impacts such as bycatch [81] and ingestion of/entanglement in plastic debris [82] are increasingly causing sea turtle mortality. Furthermore, we demonstrate that some areas are demographi-cally and genetidemographi-cally connected to rookeries in the Caribbean and West Africa. For instance, the SPSP and Noronha feeding grounds aggregate large animals from various national and international origins, and impacts at these developmental areas could affect several nesting populations throughout the Atlantic. Although Fernando de Noronha, Rocas Atoll and Arvoredo Reserve are protected areas where fishing is not allowed, other areas, including the waters around the Sa˜o Pedro and Sa˜o Paulo Archipelago, are important fishing grounds [83]. The Ceara´, Bahia and Cassino Beach areas are also not integrally protected, and impacts at these areas will most likely influence the Brazilian nesting populations, and possibly some Caribbean rookeries.
In this study we reduce the gap in genetic information of hawksbill turtle feeding populations in Brazil, and illustrate how these populations are connected with proximal and distant rookeries in the Atlantic Ocean. The results presented here should be considered in future national and multinational strategies for mitigating bycatch/other impacts to increase protection and recovery of endangered populations of hawksbill turtles.
Table 4.Natal origins forE. imbricatain Brazilian waters as estimated by drifters.
Target areas
Rookeries SPSP NR/CE BA/AP/SB
Bahia/Sergipe 0.085 0.139 0.720
Pipa 0.584 0.622 0.072
Principe 0.069 0.023 0.020
Barbados 0.027 0.020 0.017
Guadeloupe 0.003 0.002 0.002
Antigua 0.006 0.005 0.004
USVI 0.009 0.008 0.007
Puerto Rico 0.024 0.018 0.016
Dom Republic 0.003 0.002 0.002
Cuba 0.113 0.100 0.087
Costa Rica 0.003 0.002 0.002
Nicaragua 0.016 0.013 0.011
Mexico 0.058 0.047 0.041
SPSP = Sa˜o Pedro and Sa˜o Paulo Archipelago; NR/CE = Noronha/Ceara´; BA/AP/ SB = Bahia, Abrolhos, South Brazil.
Supporting Information
Figure S1 Feeding ground-centric many-to-many MSA estimates for Atlantic feeding populations. BS = Bahia/ Sergipe, PI = Pipa, PP = Principe, BB = Barbados, GU = Guadeloupe, AB = Antigua & Barbuda, UV = U.S. Virgin Islands, PR = Puerto Rico, DR = Dominican Republic, CU = Cuba, CR = Costa Rica, NI = Nicaragua, MX = Mexico. (TIFF)
Figure S2 Rookery-centric many-to-many MSA esti-mates for Atlantic nesting populations. SP = Sa˜o Pedro and Sa˜o Paulo, CE = Ceara´ coast, BA = Bahia coast, AP = Abrolhos Park, SB = South Brazil, NR = Noronha/Rocas, PP = Principe, CV = Cape Verde, UV = U.S. Virgin Islands, PR = Puerto Rico, DR = Dominican Republic, TC = Turks & Caicos, BH = Bahamas, CU = Cuba, CY = Cayman Islands, MX = Mexico, TX = Texas, FL = Florida, UN = Unknown.
(TIF)
Figure S3 Pathways of drifters passing by Atlantic Ocean rookeries.Colors indicate drift time (in months). Grey squares = drifter release areas around the rookeries, red circles = Brazilian feeding grounds, grey circles = other Atlantic Ocean feeding grounds. Grey arrows indicate the flow of the major Atlantic Ocean currents: SE = South Equatorial Current, BR = Brazil Current, SA = South Atlantic Current (displaced to the North for illustrative purposes), BG = Benguela Current, NB = North Brazil Current, GU = Guiana Current, CB = Caribbean Current, EC = Equatorial Counter Current, NE = North
Equatorial Current, GS = Gulf Stream, NA = North Atlantic Current, CN = Canary Current.
(TIF)
Table S1 Short haplotype frequencies for Atlantic Ocean hawksbill populations. Longer haplotype (740 bp) names are given when they have no short equivalent. References for genetic data can be found in the text.
(DOCX)
Acknowledgments
MCP is a graduate student of the Programa de Po´s-graduac¸a˜o em Oceanografia Biolo´gica (FURG). We thank Coordenac¸a˜o de Aperfeic¸oa-mento de Pessoal de Nı´vel Superior (Capes), the Rufford Foundation, Instituto Chico Mendes de Conservac¸a˜o da Biodiversidade (ICMBio), Pata da Cobra Diving, Brazilian Navy, CECIRM PRO-Arquipe´lago, Abrolhos Park and Arvoredo Reserve coordination, and all field assistants (a special thanks to B Barbosa) for support. We acknowledge Nu´cleo de Educac¸a˜o e Monitoramento Ambiental (NEMA), Centro de Recuperac¸a˜o de Animais Marinhos (CRAM) and Projeto Tamar for providing samples. We also thank G Hays and one anonymous reviewer for valuable suggestions on the manuscript. This is a contribution of the Research Group ‘Ecologia e Conservac¸a˜o da Megafauna Marinha2EcoMega’.
Author Contributions
Conceived and designed the experiments: MCP JR LFM ERS. Performed the experiments: MCP JR. Analyzed the data: MCP JR CRZ. Contributed reagents/materials/analysis tools: MCP LFM MAM DSM CP ERS. Wrote the paper: MCP JR CRZ ERS. Reviewed manuscript: MCP JR LFM CRZ MAM DSM CP ERS.
References
1. Bolten A (2003) Variation in sea turtle life history patterns: neritic vs. oceanic developmental stages. In: Lutz P, Musick J, Wyneken J, editors. The Biology of Sea Turtles, Vol 2. CRC Press, Boca Raton, FL. pp. 243–257.
2. Musick J, Limpus C (1996) Habitat utilization and migration in juvenile sea turtles. In: Lutz P, Musick J, editors. The Biology of Sea Turtles. CRC Press, Boca Raton, FL. pp. 137–164.
3. Avise JC (2007) Conservation Genetics of Marine Turtles – 10 Years Later. Wildlife Science: Linking Ecological Theory and Management Applications. pp. 295–314.
4. Bowen BW, Grant WS, Hillis-Starr Z, Shaver DJ, Bjorndal KA, et al. (2007) Mixed-stock analysis reveals the migrations of juvenile hawksbill turtles (Eretmochelys imbricata) in the Caribbean Sea. Mol Ecol 16: 49–60. doi:10.1111/ j.1365-294X.2006.03096.x.
5. Velez-Zuazo X, Ramos WD, van Dam RP, Diez CE, Abreu-Grobois A, et al. (2008) Dispersal, recruitment and migratory behaviour in a hawksbill sea turtle aggregation. Mol Ecol 17: 839–853. doi:10.1111/j.1365-294X.2007.03635.x. 6. Richardson PB, Bruford MW, Calosso MC, Campbell LM, Clerveaux W, et al.
(2009) Marine turtles in the Turks and Caicos Islands: remnant rookeries, regionally significant foraging stocks, and a major turtle fishery. Chelonian Conserv Biol 8: 192–207. doi:10.2744/CCB-0871.1.
7. Blumenthal JM, Abreu-Grobois FA, Austin TJ, Broderick AC, Bruford MW, et al. (2009) Turtle groups or turtle soup: dispersal patterns of hawksbill turtles in the Caribbean. Mol Ecol 18: 4841–4853. doi:10.1111/j.1365-294X.2009. 04403.x.
8. Pella J, Masuda M (2001) Bayesian methods for analysis of stock mixtures from genetic characters. Fish Bull 99: 151–167.
9. Bolker BM, Okuyama T, Bjorndal KA, Bolten AB (2007) Incorporating multiple mixed stocks in mixed stock analysis: ‘‘many-to-many’’ analyses. Mol Ecol 16: 685–695. doi:10.1111/j.1365-294X.2006.03161.x.
10. Godley BJ, Barbosa C, Bruford M, Broderick AC, Catry P, et al. (2010) Unravelling migratory connectivity in marine turtles using multiple methods. J Appl Ecol 47: 769–778. doi:10.1111/j.1365-2664.2010.01817.x.
11. Luschi P, Hays GC, Papi F (2003) A review of long-distance movements by marine turtles, and the possible role of ocean currents. Oikos 103: 293–302. doi:10.1034/j.1600-0706.2003.12123.x.
12. Hays GC, Fossette S, Katselidis K a, Mariani P, Schofield G (2010) Ontogenetic development of migration: Lagrangian drift trajectories suggest a new paradigm for sea turtles. J R Soc Interface 7: 1319–1327. doi:10.1098/rsif.2010.0009. 13. Putman NF, Naro-Maciel E (2013) Finding the ‘‘lost years’’ in green turtles:
insights from ocean circulation models and genetic analysis. Proc Biol Sci 280: 20131468. doi:10.1098/rspb.2013.1468.
14. Monzo´n-Argu¨ello C, Lo´pez-Jurado LF, Rico C, Marco A, Lo´pez P, et al. (2010) Evidence from genetic and Lagrangian drifter data for transatlantic transport of
small juvenile green turtles. J Biogeogr 37: 1752–1766. doi:10.1111/j.1365-2699.2010.02326.x.
15. Proietti M, Reisser J, Kinas P, Kerr R, Monteiro D, et al. (2012) Green turtle Chelonia mydasmixed stocks in the western South Atlantic, as revealed by mtDNA haplotypes and drifter trajectories. Mar Ecol Prog Ser 447: 195–209. doi:10.3354/meps09477.
16. IUCN (2012) The IUCN Red List of Threatened Species, version 2012.2 ,iucnredlist.org.Accessed on July 21, 2013.
17. Mortimer JA, Donnelly M (2008) Hawksbill Turtle (Eretmochelys imbricata) -Marine Turtle Specialist Group 2008 IUCN Red List status assessment. doi:10.2307/1564433.
18. Hamann M, Godfrey M, Seminoff J, Arthur K, Barata P, et al. (2010) Global research priorities for sea turtles: informing management and conservation in the 21st century. Endanger Species Res 11: 245–269. doi:10.3354/esr00279. 19. Bellini C (1996) Reproduction and feeding of marine turtles in the Fernando de
Noronha Archipelago, Brazil. Mar Turt Newsl 74: 12–13.
20. Marcovaldi M, da Silva A, Gallo B, Baptistotte C, Vieitas C, et al. (2000) Sea turtle feeding grounds of Brazil. In: Abreu-Gobrois F, Briseno-Duen˜as R, Ma´rquez R, Sarti L, editors. Proceedings of the Eighteenth International Sea Turtle Symposium on Sea Turtle Biology and Conservation. NOAA Tech. Memo. NMFS-SEFSC-436. pp. 150–152.
21. Proietti MC, Reisser J, Secchi ER (2012) Foraging by immature hawksbill sea turtles at Brazilian islands. Mar Turt Newsl 135: 4–6.
22. Marcovaldi MA, Lopez GG, Soares LS, Santos AJB, Bellini C, et al. (2007) Fifteen years of hawksbill sea turtle (Eretmochelys imbricata) nesting in Northern Brazil. Chelonian Conserv Biol 6: 223–228. doi:10.2744/1071-8443(2007)6[223: FYOHST]2.0.CO;2.
23. Santos A, Bellini C, Vieira D, Neto L, Corso G (2013) Northeast Brazil shows highest hawksbill turtle nesting density in the South Atlantic. Endanger Species Res 21: 25–32. doi:10.3354/esr00505.
24. Vilac¸a ST, Lara-Ruiz P, Marcovaldi MA, Soares LS, Santos FR (2013) Population origin and historical demography in hawksbill (Eretmochelys imbricata) feeding and nesting aggregates from Brazil. J Exp Mar Bio Ecol 446: 334–344. doi:10.1016/j.jembe.2013.06.004.
25. Ehrhart LM, Ogren LH (1999) Studies in foraging habitats: capturing and handling turtles. In: Eckert KL, Bjorndal KA, Abreu-Grobois FA, Donnelly M, editors. Research and Management Techniques for the Conservation of Sea Turtles. IUCN/SSC Marine Turtle Specialist Group Publication No. 4. pp. 61– 64.
27. Bolten AB (1999) Techniques for measuring sea turtles. In: Eckert K, Bjorndal K, Abreu-Grobois F, Donnelly M, editors. Research and Management Techniques for the Conservation of Sea Turtles. Marine Turtle Specailist Group IUCN/MTSG Publication No. 4. pp. 110–114.
28. Hillis D, Mable B, Larson A, Davis S, Zimmer E (1996) Nucleic acids IV: sequencing and cloning. In: Hillis D, Moritz C, Mable B, editors. Molecular systematics, 2nd edition. Sinauer Associates, Sunderland, MA. pp. 321–381. 29. Abreu-Grobois F, Horrocks J, Formia A, Dutton P, LeRoux R, et al. (2006) New
mtDNA Dloop primers which work for a variety of marine turtle species may increase the resolution of mixed stock analyses. In: Frick M, Panagopoulou A, Rees A, Williams K, editors. Book of Abstracts, Twenty-sixth Annual Symposium on Sea Turtle Biology and Conservation. International Sea Turtle Society, Athens, Greece. p. 179.
30. Larkin MA, Blackshields G, Brown NP, Chenna R, McGettigan PA, et al. (2007) Clustal W and Clustal X version 2.0. Bioinformatics 23: 2947–2948. doi:10.1093/bioinformatics/btm404.
31. Bass AL, Good DA, Bjorndal KA, Richardson JI, Hillis ZM, et al. (1996) Testing models of female reproductive migratory behaviour and population structure in the Caribbean hawksbill turtle,Eretmochelys imbricata, with mtDNA sequences. Mol Ecol 5: 321–328.
32. Excoffier L, Lischer H (2010) Arlequin suite ver 3.5: A new series of programs to perform population genetics analyses under Linux and Windows. Mol Ecol Resour 10: 564–567.
33. Darriba D, Taboada G, Doallo R, Posada D (2012) jModelTest 2: more models, new heuristics and parallel computing. Nat Methods 9(8): 772.
34. Monzo´n-Argu¨ello C, Rico C, Marco A, Lo´pez P, Lo´pez-Jurado LF (2010) Genetic characterization of eastern Atlantic hawksbill turtles at a foraging group indicates major undiscovered nesting populations in the region. J Exp Mar Bio Ecol 387: 9–14. doi:10.1016/j.jembe.2010.03.004.
35. Monzo´n-Argu¨ello C, Loureiro NS, Delgado C, Marco A, Lopes JM, et al. (2011) Prı´ncipe island hawksbills: genetic isolation of an eastern Atlantic stock. J Exp Mar Bio Ecol 407: 345–354. doi:10.1016/j.jembe.2011.07.017.
36. Wood L, Hardy R, Meylan P, Meylan A (2013) Hawksbill turtle (Eretmochelys imbricata) foraging aggregation in a high-latitude reef community in Southeastern Florida. Herpetol Conserv Biol 8: 258–275.
37. Bowen B, Bass A, Garcia-Rodriguez A, Diez C, Van Dam R, et al. (1996) Origin of hawksbill turtles in a Caribbean feeding area as indicated by genetic markers. Ecol Appl: 566–572.
38. Dı´az-Ferna´ndez R, Okayama T, Uchiyama T, Carrillo E, Espinosa G, et al. (1999) Genetic sourcing for the hawksbill turtle,Eretmochelys imbricata, in the Northern Caribbean Region. Chelonian Conserv Biol 3: 296–300.
39. R Core Team (2013) R: A language and environment for statistical computing. 40. Leroux RA, Dutton PH, Abreu-Grobois AF, Lagueux CJ, Campbell CL, et al. (2012) Re-examination of population structure and phylogeography of hawksbill turtles in the wider Caribbean using longer mtDNA sequences. J Hered: 1–15. doi:10.1093/jhered/ess055.
41. Lara-Ruiz P, Lopez GG, Santos FR, Soares LS (2006) Extensive hybridization in hawksbill turtles (Eretmochelys imbricata) nesting in Brazil revealed by mtDNA analyses. Conserv Genet 7: 773–781. doi:10.1007/s10592-005-9102-9. 42. Browne DC, Horrocks JA, Abreu-Grobois FA (2010) Population subdivision in
hawksbill turtles nesting on Barbados, West Indies, determined from mitochondrial DNA control region sequences. Conserv Genet 11: 1541–1546. doi:10.1007/s10592-009-9883-3.
43. Carreras C, Godley BJ, Leo´n YM, Hawkes LA, Revuelta O, et al. (2013) Contextualising the last survivors: population structure of marine turtles in the Dominican Republic. PLoS One 8: e66037. doi:10.1371/journal.pone.0066037. 44. Tro¨eng S, Dutton PH, Evans D (2005) Migration of hawksbill turtlesEretmochelys
imbricatafrom Tortuguero, Costa Rica. Ecography (Cop) 28: 394–402. 45. Oksanen AJ, Kindt R, Legendre P, Hara BO, Simpson GL, et al. (2013) vegan:
Community Ecology Package.
46. Boulon RH (1994) Growth rates of wild juvenile hawksbill turtles,Eretmochelys imbricata, in St. Thomas, United States Virgin Islands. Copeia 1994: 811–814. 47. Van Dam RP, Diez CE (1998) Home range of immature hawksbill turtles
(Eretmochelys imbricata(Linnaeus)) at two Caribbean islands. J Exp Mar Bio Ecol 220: 15–24. doi:10.1016/S0022-0981(97)00080-4.
48. Leo´n YM, Diez CE (1999) Population structure of hawksbill turtles on a foraging ground in the Dominican Republic. Chelonian Conserv Biol 3: 230–236. 49. Bjorndal KA, Bolten AB (2010) Hawksbill sea turtles in seagrass pastures: success
in a peripheral habitat. Mar Biol 157: 135–145. doi:10.1007/s00227-009-1304-0. 50. Moncada FG, Hawkes LA, Fish MR, Godley BJ, Manolis SC, et al. (2012) Patterns of dispersal of hawksbill turtles from the Cuban shelf inform scale of conservation and management. Biol Conserv 148: 191–199. doi:10.1016/ j.biocon.2012.01.011.
51. Blumenthal JM, Austin TJ, Bell CDL, Bothwell JB, Broderick AC, et al. (2009) Ecology of hawksbill turtles, Eretmochelys imbricata, on a Western Caribbean foraging ground. Chelonian Conserv Biol 8: 1–10. doi:10.2744/CCB-0758.1. 52. Gardun˜o-Andrade M (2000) Dina´mica poblacional de la tortuga de carey
(Eretmochelys imbricata) en su a´rea de forraje. Rı´o Lagartos, Yucata´n. Pronatura Penı´nsula de Yucata´n AC - Informe final SNIB-CONABIO proyecto No. L269. Me´xico D. F.
53. Beggs JA, Horrocks JA, Krueger BH (2007) Increase in hawksbill sea turtle Eretmochelys imbricatanesting in Barbados, West Indies. Endanger Species Res 3: 159–168. doi:10.3354/esr003159.
54. Kamel SJ, Delcroix E (2009) Nesting ecology of the hawksbill turtle,Eretmochelys imbricata, in Guadeloupe, French West Indies from 2000 – 07. J Herpetol 43: 367–376.
55. Richardson JI, Hall DB, Mason PA, Andrews KM, Bjorkland R, et al. (2006) Eighteen years of saturation tagging data reveal a significant increase in nesting hawksbill sea turtles (Eretmochelys imbricata) on Long Island, Antigua. Anim Conserv 9: 302–307. doi:10.1111/j.1469-1795.2006.00036.x.
56. Diez CE, van Dam RP (2011) Mona and Monito Island, Puerto Rico marine turtle research report for 2011.
57. Revuelta O, Leo´n YM, Feliz P, Godley BJ, Raga JA, et al. (2012) Protected areas host important remnants of marine turtle nesting stocks in the Dominican Republic. Oryx 46: 348–358. doi:10.1017/S0030605311001529.
58. Bowen BW, Karl SA (2007) Population genetics and phylogeography of sea turtles. Mol Ecol 16: 4886–4907. doi:10.1111/j.1365-294X.2007.03542.x. 59. Bass AL, Epperly SP, Braun-McNeill J (2006) Green turtle (Chelonia mydas)
foraging and nesting aggregations in the Caribbean and Atlantic: impact of currents and behavior on dispersal. J Hered 97: 346–354. doi:10.1093/jhered/ esl004.
60. Shamblin B, Bolten A, Bjorndal K, Dutton P, Nielsen J, et al. (2012) Expanded mitochondrial control region sequences increase resolution of stock structure among North Atlantic loggerhead turtle rookeries. Mar Ecol Prog Ser 469: 145– 160. doi:10.3354/meps09980.
61. Proietti M, Reisser J, Marins L, Marcovaldi M, Soares L, et al. (2013) Hawksbill x loggerhead sea turtle hybrids at Bahia, Brazil: where do their offspring go? PeerJ Prepr 1e159v1 http//dx.doi.org/107287/peerj.preprints159v1. 62. Grossman A, Bellini C, Fallabrino A, Formia A, Mba JM, et al. (2007) Second
TAMAR-tagged hawksbill recaptured in Corisco Bay, West Africa. Mar Turt Newsl 116: 2–3.
63. Bellini C, Sanches TM, Formia A (2000) Hawksbill turtle tagged in Brazil Captured in Gabon, Africa. Mar Turt Newsl 87: 11–12.
64. Naro-Maciel E, Becker JH, Lima EHSM, Marcovaldi MAˆ , DeSalle R (2007) Testing dispersal hypotheses in foraging green sea turtles (Chelonia mydas) of Brazil. J Hered 98: 29. doi:10.1093/jhered/esl050.
65. Lima EHSM, Melo MTD, Severo MM, Barata PC (2008) Green turtle tag recovery further links Northern Brazil to the Caribbean region. Mar Turt Newsl 119: 14–15.
66. Lumpkin R, Pazos M (2007) Measuring surface currents with Surface Velocity Program drifters: the instrument, its data, and some recent results. Lagrangian Anal Predict Coast Ocean Dyn: 39–67.
67. Meylan PA, Meylan AB, Gray JA (2011) The ecology and migrations of sea turtles 8. Tests of the developmental habitat hypothesis. Bull Am Museum Nat Hist 357: 70pp.
68. Proietti M, Reisser J, Marins L, Zarate C, Marcovaldi M, et al. (2013) Biometric and mitochondrial DNA haplotype data of immature hawksbill turtles in Brazilian waters. Figshare http://dx.doi.org/106084/m9.figshare884616. 69. Amorocho DF, Abreu-Grobois FA, Dutton PH, Reina RD (2012) Multiple
distant origins for green sea turtles aggregating off Gorgona Island in the Colombian eastern Pacific. PLoS One 7: e31486. doi:10.1371/journal. pone.0031486.
70. Gaspar P, Benson SR, Dutton PH, Re´veille`re A, Jacob G, et al. (2012) Oceanic dispersal of juvenile leatherback turtles: going beyond passive drift modeling. Mar Ecol Prog Ser 457: 265–284. doi:10.3354/meps09689.
71. Hamann M, Grech A, Wolanski E, Lambrechts J (2011) Modelling the fate of marine turtle hatchlings. Ecol Modell 222: 1515–1521. doi:10.1016/j.ecolmodel. 2011.02.003.
72. Scott R, Marsh R, Hays GC (2012) A little movement orientated to the geomagnetic field makes a big difference in strong flows. Mar Biol 159: 481–488. doi:10.1007/s00227-011-1825-1.
73. Fossette S, Putman N, Lohmann K, Marsh R, Hays G (2012) A biologist’s guide to assessing ocean currents: a review. Mar Ecol Prog Ser 457: 285–301. doi:10.3354/meps09581.
74. Allen C, Lemons G, Eguchi T, LeRoux R, Fahy C, et al. (2013) Stable isotope analysis reveals migratory origin of loggerhead turtles in the Southern California Bight. Mar Ecol Prog Ser 472: 275–285. doi:10.3354/meps10023.
75. Zbinden J, Bearhop S, Bradshaw P, Gill B, Margaritoulis D, et al. (2011) Migratory dichotomy and associated phenotypic variation in marine turtles revealed by satellite tracking and stable isotope analysis. Mar Ecol Prog Ser 421: 291–302. doi:10.3354/meps08871.
76. Lo´pez-Castro M, Bjorndal K, Kamenov G, Zenil-Ferguson R, Bolten A (2013) Sea turtle population structure and connections between oceanic and neritic foraging areas in the Atlantic revealed through trace elements. Mar Ecol Prog Ser 490: 233–246. doi:10.3354/meps10433.
77. Mortimer JA, Meylan PA, Donnelly M (2007) Whose turtles are they, anyway? Mol Ecol 16: 17–18. doi:10.1111/j.1365-294X.2006.03252.x.
78. Godfrey MH, Webb GJW, Manolis SC, Mrosovsky N (2007) Hawksbill sea turtles: can phylogenetics inform harvesting? Mol Ecol 16: 3511–3; discussion 3514–7. doi:10.1111/j.1365-294X.2007.03356.x.
79. Bowen BW, Grant WS, Hillis-Starr Z, Shaver DJ, Bjorndal KA, et al. (2007) The advocate and the scientist: debating the commercial exploitation of endangered hawksbill turtles. Mol Ecol 16: 3514–3515. doi:10.1111/j.1365-294X.2007.03431.x.
81. Marcovaldi MA, Sales G, Thome´ JC, da Silva A, Gallo BMG, et al. (2006) Sea turtles and fishery interactions in Brazil: identifying and mitigating potential conflicts. Mar Turt Newsl 112: 4–8.
82. Schuyler Q, Hardesty BD, Wilcox C, Townsend K (2013) Global analysis of anthropogenic debris ingestion by sea turtles. Conserv Biol 00: 1–11. doi:10.1111/cobi.12126.