DNA barcoding of Brazilian sea turtles (Testudines)
Sarah M. Vargas, Flávia C.F. Araújo and Fabrício R. Santos
Laboratório de Biodiversidade e Evolução Molecular, Instituto de Ciências Biológicas,
Universidade Federal de Minas Gerais, Belo Horizonte, MG, Brazil.
Abstract
Five out of the seven recognized species of sea turtles (Testudines) occur on the Brazilian coast. The Barcode Initia-tive is an effort to undertake a molecular inventory of Earth biodiversity.Cytochrome Oxidase c subunit I (COI) mo-lecular tags for sea turtle species have not yet been described. In this study, COI sequences for the five species of sea turtles that occur in Brazil were generated. These presented widely divergent haplotypes. All observed values were on the same range as those already described for other animal groups: the overall mean distance was 8.2%, the mean distance between families (Dermochelyidae and Cheloniidae) 11.7%, the mean intraspecific divergence 0.34%, and the mean distance within Cheloniidae 6.4%, this being 19-fold higher than the mean divergence ob-served within species. We obtained species-specific COI barcode tags that can be used for identifying each of the marine turtle species studied.
Key words:barcodes, sea turtles,Cytochrome Oxidase c subunit I(COI).
Received: July 17, 2008; Accepted: December 18, 2008.
Marine turtles (Chelonioidea) are divided into two families, the mono-specific Dermochelyidae containing the
leatherback turtle Dermochelys coriacea, and the
Cheloniidae, with six recognized species divided into two tribes, Chelonini and Carettini. Chelonini is represented by
the closely related green turtle Chelonia mydas and
flatback turtle Natator depressus. Carettini includes the
loggerhead turtle Caretta caretta, the olive and Kemp’s
ridley turtles,Lepidochelys olivaceaandL. kempi,
respec-tively, and the hawksbill turtle Eretmochelys imbricata
(Ekertet al., 1999; Plotkin, 2007).
The “Barcode of Life” Consortium is a worldwide initiative devoted to undertaking a molecular inventory of Earth biodiversity. After having been demonstrated that the
Cytochrome Oxidasecsubunit I (COI) gene of the
mito-chondrial DNA (mtDNA) could be successfully used for
identifying North American bird species (Hebert et al.,
2004), many other vertebrate COI bar-codes have been pro-duced (Vilaçaet al., 2006; Clareet al., 2007; Chaveset al., 2008).
Five out of the seven recognized marine turtle species occur on the Brazilian coast, namely the loggerhead (Caretta caretta), the hawksbill (Eretmochelys imbricata), the green (Chelonia mydas), the olive ridley (Lepidochelys olivacea) and the leatherback (Dermochelys coriacea) (Marcovaldi and Marcovaldi, 1999).
The large-scale sequencing of a single or few genes in taxonomic studies, denominated the Barcode initiative, aims at representing a practical method for species identifi-cation, as well as for providing insights into the evolution-ary diversification of life (Stoeckle, 2003). Besides its usefulness in taxonomy, the barcode methodology is pected to be of great utility in conservation biology, for ex-ample, when performing biodiversity surveys. It could also be applied when traditional methods are inefficacious, as in the identification of eggs and larval forms, and in the analy-sis of stomach contents or excreta to determine food webs (Stoeckle, 2003). Furthermore, it can be potentially em-ployed in forensic cases to identify the source of tissue sam-ples obtained from the illegal commerce or use of eggs and meat.
Besides being eaten as food, in various human cul-tures the eggs of all turtle species are believed to possess aphrodisiac attributes. Turtle-egg consumption is believed to be the main cause for the severe decline in many sea tur-tle populations (Thorbjarnarson et al., 2000). The use of turtle meat as food is also worthy of mention, especially in the case of green turtles which are widely hunted in such places as Costa Rica, Mexico, Venezuela, Australia and Pa-pua New Guinea (Lefever, 1992; Kowarsky, 1995; Nabhan et al., 1999). Thus, barcode methodology could be applied wherever turtle meat and eggs are eaten or trafficked, as a way of identifying species-source. In this way, barcode sur-veys could be used in sea turtle conservation and for alert-ing both the population and conservationists as to the local level of species-threat.
Send correspondence to Sarah M. Vargas. Departamento de Bio-logia Geral, Instituto de Ciências Biológicas, Universidade Federal de Minas Gerais, Caixa Postal 486, 30161-970 Belo Horizonte, MG, Brazil. E-mail: [email protected].
DNA barcodes could also be applied in field research for the identification of lost nests and turtles stranded on beaches and frequently encountered in an advanced state of decomposition, thereby complicating correct species iden-tification. Another possibility is the rapid identification of interspecific hybrids, which can be as frequent as 45% in the population ofE.imbricataof Bahia, Brazil (Lara-Ruiz et al., 2006).
In this work, we generated COI barcodes and evalu-ated their usefulness for discriminating the five species of sea turtles occurring in Brazil.
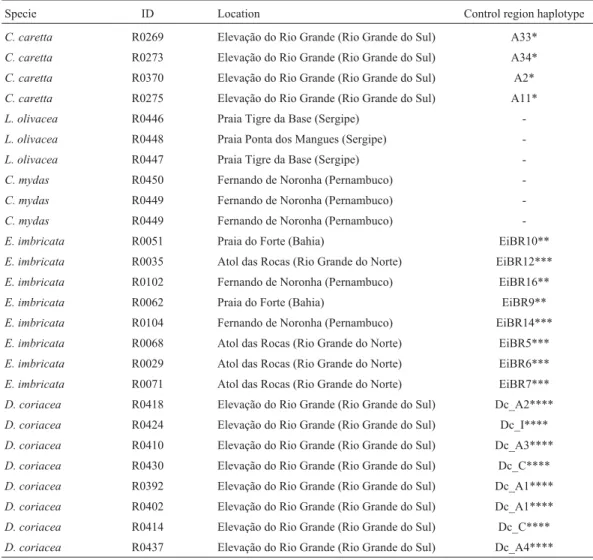
Twenty six turtles from five species (Lepidochelys olivacean = 3,Chelonia mydasn = 3,Caretta carettan = 4, Eretmochelys imbricatan = 8 andDermochelys coriacea n = 8) were sampled from beaches in different states of Brazil (Table 1). Several of the individuals had been used in prior studies on control-region sequences, namely fromE. imbricata(n = 119) (Lara-Ruizet al., 2006),D. coriacea (n = 63) (Vargaset al., 2008) andC. caretta(n = 84) (Reis
et al., unpublished), which thus favored our selection of the most divergent individuals within each species for the pres-ent analysis.
Fresh skin biopsies were taken from the front flipper of live animals and stored at room temperature in ethanol 70%, until total DNA was extracted as previously described (Lara-Ruizet al., 2006). For L. olivacea, the COI mito-chondrial gene was amplified as a whole by using the spe-cific primer SOCOF1 developed in our laboratory, as well as the H8121 primer designed by M. D. Sorenson (see Internet Resources). LCO1490 and HCO2198 primers de-veloped by Folmeret al.(1994) were used for the
remain-ing four species. PCR reaction mixes of 15mL included
2mL of genomic DNA (~ 40 ng), 1 U ofTaqpolymerase
(Phoneutria®), 200mM of dNTPs, 1X Tris-KCl buffer with
1.5 mM MgCl2(Phoneutria®) and 0.5mM of each primer.
Before sequencing, the PCR products were cleaned by pre-cipitation, using 20% polyethyleneglycol (Lara-Ruizet al., 2006). Sequencing reactions were carried out with each
Table 1- Sampling sites in Brazil and control region haplotypes.
Specie ID Location Control region haplotype
C. caretta R0269 Elevação do Rio Grande (Rio Grande do Sul) A33*
C. caretta R0273 Elevação do Rio Grande (Rio Grande do Sul) A34*
C. caretta R0370 Elevação do Rio Grande (Rio Grande do Sul) A2*
C. caretta R0275 Elevação do Rio Grande (Rio Grande do Sul) A11*
L. olivacea R0446 Praia Tigre da Base (Sergipe)
-L. olivacea R0448 Praia Ponta dos Mangues (Sergipe)
-L. olivacea R0447 Praia Tigre da Base (Sergipe)
-C. mydas R0450 Fernando de Noronha (Pernambuco)
-C. mydas R0449 Fernando de Noronha (Pernambuco)
-C. mydas R0449 Fernando de Noronha (Pernambuco)
-E. imbricata R0051 Praia do Forte (Bahia) EiBR10**
E. imbricata R0035 Atol das Rocas (Rio Grande do Norte) EiBR12***
E. imbricata R0102 Fernando de Noronha (Pernambuco) EiBR16**
E. imbricata R0062 Praia do Forte (Bahia) EiBR9**
E. imbricata R0104 Fernando de Noronha (Pernambuco) EiBR14***
E. imbricata R0068 Atol das Rocas (Rio Grande do Norte) EiBR5***
E. imbricata R0029 Atol das Rocas (Rio Grande do Norte) EiBR6***
E. imbricata R0071 Atol das Rocas (Rio Grande do Norte) EiBR7***
D. coriacea R0418 Elevação do Rio Grande (Rio Grande do Sul) Dc_A2****
D. coriacea R0424 Elevação do Rio Grande (Rio Grande do Sul) Dc_I****
D. coriacea R0410 Elevação do Rio Grande (Rio Grande do Sul) Dc_A3****
D. coriacea R0430 Elevação do Rio Grande (Rio Grande do Sul) Dc_C****
D. coriacea R0392 Elevação do Rio Grande (Rio Grande do Sul) Dc_A1****
D. coriacea R0402 Elevação do Rio Grande (Rio Grande do Sul) Dc_A1****
D. coriacea R0414 Elevação do Rio Grande (Rio Grande do Sul) Dc_C****
D. coriacea R0437 Elevação do Rio Grande (Rio Grande do Sul) Dc_A4****
primer in a final volume of 10mL containing 2mL of
puri-fied PCR product, 3mL of ultrapure water, 1mL of primer
(5mM) and 4mL of sequencing kit (ET DYE Terminator
Kit, Amersham Biosciences). Sequencing products were precipitated with ammonium acetate and ethanol, dried at room temperature, dissolved with formamide-EDTA and run in a MegaBACE 1000 automatic sequencer (General Electric Healthcare).
Consensus sequences (# BBT001-08 to BBT026-08 are available in the BOLD database - see Internet Re-sources) were obtained and checked with the software Phred v. 0.20425 (Ewinget al., 1998), Phrap v. 0.990319
and Consed 12.0 (Gordon et al., 1998, see Internet
Re-sources). Alignments were performed using Clustal X (Thompsonet al., 1997), with a manual edition, whenever necessary. Sequence divergence among different
haplo-types was estimated with MEGA 3.0 software (Kumaret
al., 2004) by using the Kimura 2-parameter (K2p) distance model (Nei and Kumar, 2000). MEGA 3.0 was also used to construct a Neighbor-Joining (NJ) tree based on the K2p model with 10,000 bootstrap replicates.
A 589 bp COI fragment was analyzed in this study. The sequences obtained were aligned and compared with
another GenBank COI sequence for Chelonia mydas
(#AB012104). These comparisons revealed neither stop nor nonsense codons, neither were alignment gaps found.
Although specimens ofD. coriacea bearing six different
control region haplotypes were analyzed, only one COI haplotype was encountered in this species. Different COI
haplotypes were found forE. imbricata(four haplotypes)
andC. caretta(three haplotypes), the average intra-specific K2P distances being 0.9% and 0.8%, respectively (Table 2), thereby exceeding values encountered in other studies, such as 0.6% for neotropical bats (Clareet al., 2007) and 0.34% for Brazilian birds (Vilaçaet al., 2006). Nucleotide divergence among species was high, ranging from 6.3% for L. olivaceaandC. carettato 13.9% forC. mydasandD. coriacea(Table 2).
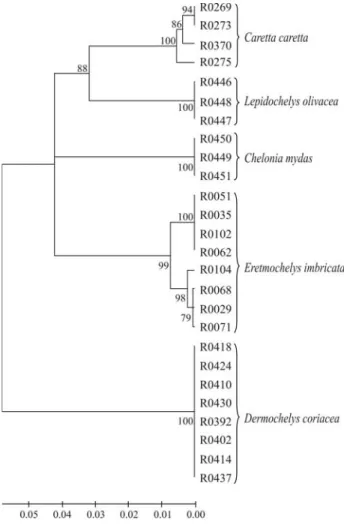
The overall mean distance was 8.2% and the mean distance between the families Dermochelyidae and Cheloniidae, 11.7%. The mean distance within Cheloniidae
was 6.4%, 19 times higher than the mean divergence ob-served within species (0.34%). Only one haplotype was discriminated in Dermochelyidae, therefore the mean tance was zero. The COI gene sequences significantly dis-criminated all the species (99% bootstrap support), but did not split the two Cheloniidae tribes (Carettini and Chelonini), as can be seen in the NJ tree (Figure 1).
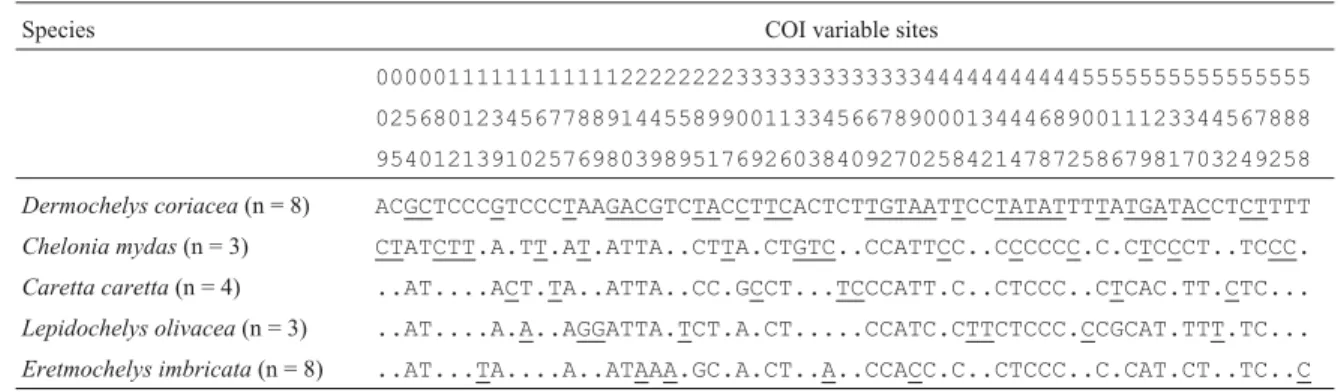
The autapomorphic sites discovered in each species are shown in Table 3. Most of the 71 autapomorphic sites
were found in D. coriacea(32 sites), as expected, since
Dermochelyidae diverged from the Cheloniidae in the late Cretaceous about 100 million years ago (Spotila, 2004).E. imbricata presented six autapomorphic sites, L. olivacea eight,C. mydaseighteen andC. carettaseven.
These autapomorphic characters, which are suppos-edly intraspecific synapomorphies, should be considered with caution since they were found in only a few individu-als from each species, although we had pre-selected highly divergent mtDNA sequences. Some of these characters may thus not appear as synapomorphic in a broader sam-pling study.
The finding of characteristic species-specific COI se-quences offers the prospect of identifying marine turtle spe-cies by using DNA barcode methodology as an auxiliary tool for taxonomy. This can also be used during field work, when identifying lost nests, animals stranded on beaches or those killed as part of the bycatch in fishery nets. A further use is in forensic litigation when turtle eggs or meat are the only available material.
Table 2- Mean sequence divergence (K2P) within species (underlined number) and between pairs of sea turtle species found in Brazil.
Cm Cc Lo Ei Dc Chelonia mydas (Cm) 0.000
Caretta caretta (Cc) 0.096 0.008
Lepidochelys olivacea (Lo) 0.084 0.063 0.000
Eretmochelys imbricata (Ei) 0.086 0.089 0.079 0.009
Dermochelys coriacea (Dc) 0.139 0.122 0.124 0.103 0.000
Table 3- Autapomorphic characters (highlighted in black) found in all individuals within each sea turtle species.
Species COI variable sites
00000111111111111222222223333333333333444444444445555555555555555
02568012345677889144558990011334566789000134446890011123344567888
95401213910257698039895176926038409270258421478725867981703249258
Dermochelys coriacea(n = 8) ACGCTCCCGTCCCTAAGACGTCTACCTTCACTCTTGTAATTCCTATATTTTATGATACCTCTTTT
Chelonia mydas(n = 3) CTATCTT.A.TT.AT.ATTA..CTTA.CTGTC..CCATTCC..CCCCCC.C.CTCCCT..TCCC.
Caretta caretta(n = 4) ..AT....ACT.TA..ATTA..CC.GCCT...TCCCATT.C..CTCCC..CTCAC.TT.CTC...
Lepidochelys olivacea(n = 3) ..AT....A.A..AGGATTA.TCT.A.CT...CCATC.CTTCTCCC.CCGCAT.TTT.TC...
Despite these advantages, DNA barcoding must be employed with care in those sites where hybridization has already been registered, as in the hawksbill population of Bahia (Brazil), where 50 out of 119 individuals manifested two of the haplotypes characteristic of the loggerhead spe-cies (Lara-Ruizet al., 2006). Hybrid turtles display mito-chondrial DNA characteristics of the maternal species against a background of the maternal and paternal nuclear genes from both species, thus composing a mosaic that may lead to incorrect taxonomic identification. Nevertheless, in most cases COI barcodes can be used for the trustworthy identification of maternal ancestry and testing the possibil-ity of hybridization when discrepancies between morphol-ogy and expected mtDNA inheritance are encountered.
Acknowledgments
SMV received supported from FAPEMIG and CAPES (Brazil), and FCFA and FRS from CNPq (Brazil). Field work was sponsored by PETROBRAS/CENPES (Brazil), and lab work funded by CNPq, FAPEMIG and
CAPES (Brazil). We wish to thank Marta Svartman for the technical review of the text, and Danielle S. Monteiro and Sergio Estima from NEMA (Brazil) and Luciano Soares from the Fundação Pró-Tamar (Brazil) for providing sam-ples and information concerning field work.
References
Clare EL, Lim BK, Engstrom MD, Eger JL and Hebert PD (2007) DNA barcoding of Neotropical bats: Species identification and discovery within Guyana. Mol Ecol Notes 7:184-190. Chaves AV, Clozato CL, Lacerda DR, Sari EHR and Santos FR
(2008) Molecular taxonomy of Brazilian tyrant-flycatchers (Passeriformes, Tyrannidae). Mol Ecol Resour 8:1169-1177.
Ekert KL, Bjorndal KA, Abreu-Grobois FA and Donnelly M (1999) Research and Management Techniques for the Con-servation of Sea Turtles. IUCN/SSC Marine Turtle Special-ist Group, Gland, 235 pp.
Ewing B, Hillier L, Wendi M and Green P (1998) Basecalling of automated sequencer traces using Phred I: Accuracy assess-ment. Genome Res 8:175-185.
Folmer OM, Black W, Hoeh R, Lutz R and Vrijenhoek R (1994) DNA primers for amplification of mitochondrial cyto-chrome c oxidase subunit I from diverse metazoan inverte-brates. Mol Mar Biol Biotechnol 3:294-299.
Gordon D, Abajian C and Green P (1998) Consed: A graphical tool for sequence finishing. Genome Res 8:195-202. Hebert PDN, Stoeckle MY, Zemlak TS and Francis CM (2004)
Identification of birds through DNA barcodes. PLoS Comput Biol 2:1657-1663.
Kowarsky J (1995) Subsistence hunting of turtle in Australia. In: Bjorndal KA (ed) Biology and Conservation of Sea Turtle -Revised Edition. Smithsonian Institution Press, Washing-ton, pp 305-313.
Kumar S, Tamura K and Nei M (2004) MEGA3: Integrated soft-ware for Molecular Evolutionary Genetics Analysis and se-quence alignment. Brief Bioinform 5:150-163.
Lara-Ruiz P, Lopez GG, Santos FR and Soares LS (2006) Exten-sive hybridization in hawksbill turtles (Eretmochelys imbricata) nesting in Brazil revealed by mtDNA analyses. Conserv Genet 7:773-781.
Lefever H (1992) Turtle Bongue: Afro-Caribbean Life and Cul-ture in a Costa Rican Village. Susquehanna University Press, Selinsgrove, 249 pp.
Marcovaldi MA and Marcovaldi GG (1999) Marine turtles of Brazil: The history and structure of Projeto TAMAR-IBA-MA. Biol Cons 91:35-41.
Nabhan G, Govan H, Eckert SA and Seminoff JA (1999) Sea Tur-tle workshop for the indigenous Ser tribe. Marine TurTur-tle Newsletter 86:44.
Nei M and Kumar S (2000) Molecular Evolution and Phylo-genetics. Oxford University Press, New York, 333 pp. Plotkin PT (2007) Biology and Conservation of Ridley Sea
Tur-tles. JHU Press, Baltimore, 356 pp.
Spotila JR (2004) Sea Turtles: A Complete Guide to Their Biol-ogy, Behavior, and Conservation. JHU Press, Baltimore, 227 pp.
Stoeckle M (2003) Taxonomy, DNA, and the Bar Code of Life. Bioscience 53:796-797.
Thompson JD, Gibson TJ, Plewniak F, Jeanmougin F and Higgins DG (1997) The Clustal X windows interface: Flexible strat-egies for multiple sequence alignment aided by quality anal-ysis tools. Nucleic Acids Res 24:4876-4882.
Thorbjarnarson JB, Lagueux CJ, Bolze D, Klemens MW and Meylan AB (2000) Human use of turtles: A worldwide per-spective. In: Klemens MW (ed) Turtle Conservation. Smith-sonian Institution Press, Washington and London, pp 33-84. Vargas SM, Araújo FCF, Monteiro DS, Almeida AP, Soares LS
and Santos FR (2008) Genetic diversity and origin of Leatherback turtles (Dermochelys coriacea) from the Bra-zilian coast. J Hered 99:215-220.
Vilaça ST, Lacerda DR, Sari HER and Santos FR (2006) DNA-based identification to Thamnophilidae (Passeriformes) spe-cies: The first barcodes of Neotropical birds. Rev Bras Ornitol 14:7-13.
Internet Resources
Avian mtDNA primers: http://people.bu.edu/msoren/Bird. mt.Primers.pdf (February 9, 2008).
Barcode of Life Data System: http://www.boldsystems.org (June 27, 2008).
Consortium of the Barcode of life: http://www.barcoding.si.edu (May 14, 2008).
Phrap and Consed software: http://www.phrap.org (April 2, 2008).
Projeto Tamar: http://www.tamar.org.br (May 14, 2008).
Associate Editor: João S. Morgante