Solid Earth, 6, 681–699, 2015 www.solid-earth.net/6/681/2015/ doi:10.5194/se-6-681-2015
© Author(s) 2015. CC Attribution 3.0 License.
Brittle–viscous deformation of vein quartz under fluid-rich lower
greenschist facies conditions
H. J. Kjøll1, G. Viola1,2, L. Menegon3, and B. E. Sørensen1
1Dept. of Geology and Mineral Resources Engineering, Norwegian University of Science and Technology, Trondheim, Norway
2Geological Survey of Norway, Trondheim, Norway
3School of Geography, Earth and Environmental Sciences, Plymouth University, Plymouth, UK
Correspondence to:H. J. Kjøll (hans.j.k@gmail.com)
Received: 16 December 2014 – Published in Solid Earth Discuss.: 23 January 2015 Revised: 2 May 2015 – Accepted: 16 May 2015 – Published: 11 June 2015
Abstract. We studied by Electron BackScatter Diffraction (EBSD) and optical microscopy a coarse-grained (ca. 0.5– 6 mm) quartz vein embedded in a phyllonitic matrix to gain insights into the recrystallization mechanisms and the pro-cesses of strain localization in quartz deformed under lower greenschist facies conditions, broadly coincident with the brittle–viscous transition. The vein deformed during fault-ing along a phyllonitic thrust of Caledonian age within the Porsa Imbricate Stack in the Paleoproterozoic Repparfjord Tectonic Window in northern Norway. The phyllonite host-ing the vein formed at the expense of a metabasaltic pro-tolith through feldspar breakdown to form interconnected layers of fine, synkinematic phyllosilicates. In the mechani-cally weak framework of the phyllonite, the quartz vein acted as a relatively rigid body. Viscous deformation in the vein was initially accommodated by quartz basal <a> slip. Un-der the prevailing deformation conditions, however, disloca-tion glide- and possibly creep-accommodated deformadisloca-tion of quartz was inefficient, and this resulted in localized strain hardening. In response to the (1) hardening, (2) progressive and cyclic increase of the fluid pressure, and (3) increasing competence contrast between the vein and the weakly foli-ated host phyllonite, vein quartz crystals began to deform by brittle processes along specific, suitably oriented lattice planes, creating microgouges along microfractures. Nucle-ated new grains rapidly sealed these fractures as fluids pen-etrated the actively deforming system. The grains grew ini-tially by solution precipitation and later by grain boundary migration. We suggest that the different initial orientation of the vein crystals led to strain accommodation by different
mechanisms in the individual crystals, generating remark-ably different microstructures. Crystals suitremark-ably oriented for basal slip, for example, accommodated strain mainly vis-cously and experienced only minor fracturing. Instead, crys-tals misoriented for basal slip hardened and deformed pre-dominantly by domainal fracturing. This study indicates the importance of considering shear zones as dynamic systems wherein the activated deformation mechanisms may vary through time in response to the complex temporal and spatial evolution of the shear zone, often in a cyclic fashion.
1 Introduction
made powerful methodologies such as electron backscat-tered diffraction (EBSD; e.g., Adams et al., 1993; Prior et al., 1999, 2009) readily available. This permits extremely detailed investigations and quantification of microstructures and, thereby, the derivation of refined conceptual models of the deformation mechanisms in quartz at the broadly defined brittle–viscous transition.
Intragrain quartz microstructures characterized by bands of fine new grains in large porphyroclasts have been noted and described as standard for low-grade deformed quartz in a number of studies, both experimental and natural (e.g., Vernooij et al., 2006b; van Daalen et al., 1999; Menegon et al., 2008). These microstructures tend to develop during the very early stages of viscous deformation in quartz and are thus studied to better understand strain localization under very low-grade metamorphic conditions. Four mechanisms have been proposed to explain their occurrence: (1) pro-gressive subgrain rotation recrystallization with subsequent grain boundary sliding (Bestmann and Prior, 2003), (2) intra-pore growth by dissolution precipitation (e.g., den Brok and Spiers, 1991; Hippertt and Egydio-Silva, 1996), (3) fractur-ing along specific crystallographic planes with subsequent fragment rotation (e.g., den Brok, 1992; van Daalen et al., 1999; Vernooij et al., 2006b), and (4) localized recrystalliza-tion along Dauphiné twins (Stipp and Kunze, 2008; Mene-gon et al., 2011). Van Daalen et al. (1999) observed that bands of new grains tend to develop preferentially along the rhomb direction within the deforming crystal. Trepmann et al. (2007) studied further the importance of these microstruc-tures by means of carefully designed experiments, wherein they investigated deformation at the tip of a seismic fault. They could reproduce similar microstructures by deforming moderately wet quartz under high stresses before annealing it quasi-statically under dry conditions.
We aim herein to investigate further how these character-istic microstructures develop in quartz at the brittle–viscous transition in a tectonically active environment wherein flu-ids and competence contrasts between the actively deform-ing mineral phases induce cyclic oscillations between brittle and viscous conditions. To do so, we studied in detail the mi-crostructure of a quartz vein embedded in a phyllonitic ma-trix. The vein, which crystallized statically prior to deforma-tion, permitted an assessment of the influence exerted by the different initial orientations of the deformed quartz crystals on the accommodation of subsequent strain increments by either brittle or viscous processes. The different initial ori-entations of vein quartz grains caused the development of drastically different end microstructures within a very small volume of rock, thus allowing the critical and comparative analysis of the different deformation mechanisms that acted simultaneously during deformation.
2 Geological setting
2.1 Regional geological setting and structural framework
The study area is located within the Repparfjord Tectonic Window (RTW), the northernmost exposed termination of the Fennoscandian Shield in northern Norway (Fig. 1). The RTW is a window through the Scandinavian Cale-donides, which in the study area consists of greenschist to amphibolite-facies metapelites, metapsammites and mar-bles, with intercalated gneissic slivers (e.g., Gee et al., 2008; Roberts, 2003; Torgersen et al., 2014). The RTW ex-poses a metasupracrustal sequence formed by greenschist to lower amphibolite facies metasedimentary and metavolcanic rocks, ranging from clastic and volcanoclastic rocks to ultra-mafic and rhyolitic calc-alkaline to tholeiitic volcanic rocks (Pharaoh, 1985; Pharaoh et al., 1983). K–Ar dating suggests that they deformed under greenschist-facies conditions until ca. 1840 million years ago, with formation of kilometer-scale upright folds (e.g., Pharaoh et al., 1982).
The northwesternmost part of the RTW shows a set of strongly deformed tectonic imbricates, stacked up to form the Porsa Imbricate Stack (PIS; Torgersen and Viola, 2014; Fig. 1a). Shortening and imbrication within the PIS occurred during the Silurian Caledonian orogeny, which accommo-dated overall NW–SE shortening and ca. eastward nappe transport (Rice, 1998). As deformation localized during de-velopment of the PIS, discrete thrust faults nucleated on the limbs of inherited Paleoproterozoic folds. These tightened and acquired a SE-vergence during the late stages of short-ening of the PIS. The Caledonian overprint within the RTW becomes progressively less penetrative to the SE where the imbricate stack terminates against the sub-vertical Skinnfjel-let Fault Zone, a dip-slip reverse fault (SFZ: Fig. 1a). Rocks in the immediate footwall of the floor Caledonian décolle-ment underwent greenschist facies metamorphism and were openly refolded around NE- moderately to gently plunging fold axes. Regional metamorphism was constrained to 430– 410 million years by Dallmeyer et al. (1988) by Ar-Ar dating on rejuvenated micas.
In the north, the SFZ cuts a gently dipping thrust that ac-commodated southeastward transport at the front of the PIS, the Nussirjávri Fault Zone (NFZ; Fig. 1a), which is where the studied quartz vein was sampled.
2.2 Nussirjávri Fault Zone
H. J. Kjøll et al.: Deformation of vein quartz under fluid-rich lower greenschist facies conditions 683
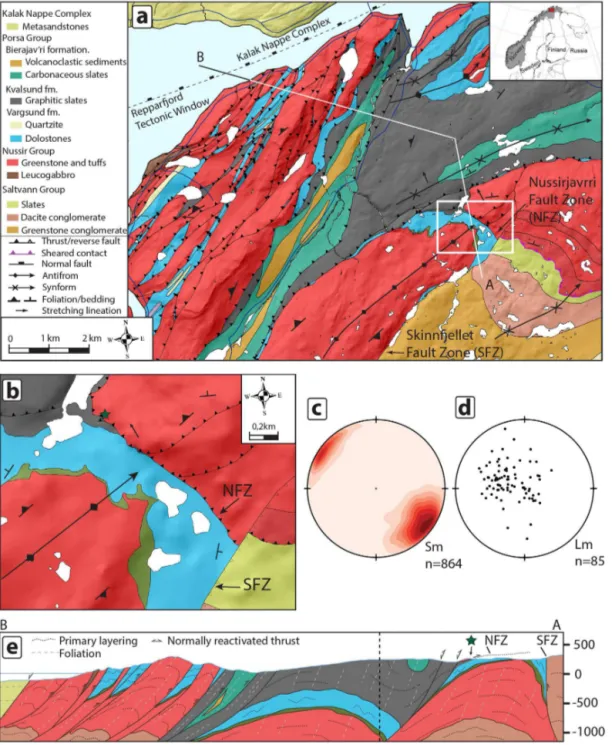
Figure 1. (a)1 : 50 000 geological map of the northwestern part of the Repparfjord Tectonic Window. Doglegged line: trace of cross section in(e). White rectangle: location of detailed map in(b). Inset shows the location of the study area in northern Norway.(b)Close-up of the Nussirjávri Fault Zone (NFZ) and sample location shown by green star. (candd) Contoured foliation and stretching lineation measurements, respectively, from the mapped area (lower hemisphere projection).(e)Cross section along the doglegged line in(a). Black dashed line: folded primary layering, gray dashed line: axial planar foliation. Green star: sample location.
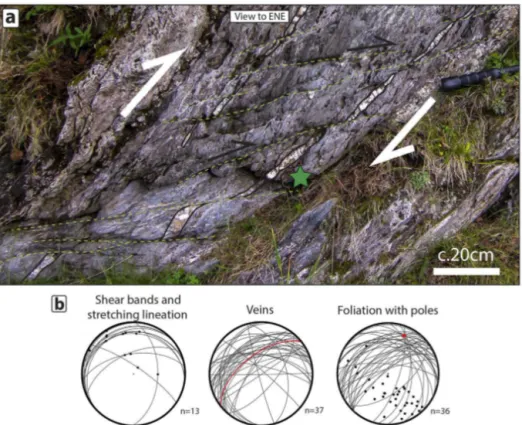
bears NW plunging stretching lineations. Kinematic indica-tors, both at the meso- and micro-scale (Fig. 2a), indicate top-to-the-SE reverse kinematics, thus are consistent with the regional transport direction of the PIS as a whole. The NFZ is folded openly around a fold axis plunging gently to mod-erately towards the NNE, consistent with the geometry of a
sub-regional folding phase of inferred Caledonian age (e.g., Rice, 1998; Pharaoh et al., 1983; Torgersen and Viola, 2014; Fig. 2b).
my-Figure 2. (a)Veins (outlined by black lines) cut by gently NNW-dipping shear bands (green dashed lines) that create a pervasive ECC fabric at the outcrop scale. The NFZ fault core is located 2 m farther up. Sample location is indicated by the green star. Hammer handle for scale. (b)Orientation of key structural elements of the NFZ in lower hemisphere projections. Left stereonet: shear bands related to the NFZ and related stretching lineations. Middle stereonet: veins along the NFZ. The sampled vein is indicated by the red great circle. Right stereonet: great circles and poles of NFZ mylonitic and phyllonitic foliation planes indicating that the NFZ is folded around a calculated axis oriented 024/19 as indicated with a red point.
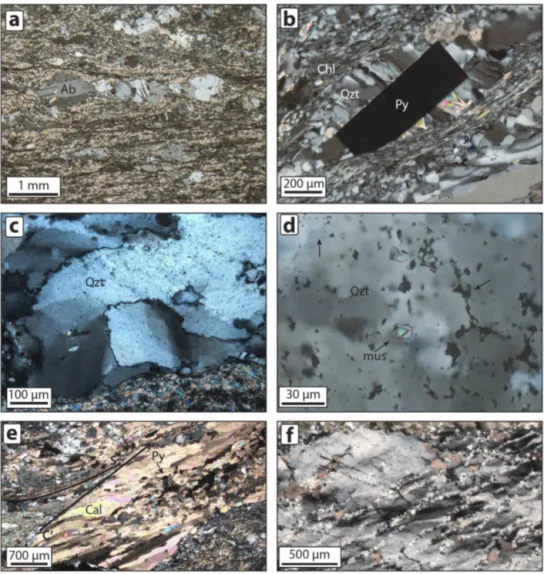
lonitic core. Several large clasts of both graphitic slate and partially decarbonized dolostone are found within the my-lonitic foliation. Elsewhere, where the hanging wall por-phyritic basalt forms the fault core, a pervasive phyllonitic fabric consisting of chlorite, white mica and fine-grained quartz (< 50 µm) together with scattered boudinaged clasts of Na-rich plagioclase usually < 500 µm in size defines the NFZ (Fig. 4a).
Numerous quartz-carbonate veins and veinlets are trans-posed along the phyllonitic foliation. They are locally im-bricated, confirming the top-to-the-SE kinematics. Locally the mylonitic fabric is deformed by a pervasive extensional crenulation cleavage (ECC; Platt and Vissers, 1980) with in-dividual shear bands dipping gently towards the NNW invari-ably indicating top-to-the-SE transport, which, in the present geometry, corresponds to southeastward thrusting along the NFZ (Fig. 2a and b). Field relations indicate that vein em-placement was pre- to syntectonic as most veins are either boudinaged or cut by the ECC shear bands. One of these veins forms the subject of our study (green star in Fig. 2a).
3 Analytical method
H. J. Kjøll et al.: Deformation of vein quartz under fluid-rich lower greenschist facies conditions 685
to 56 µm. Further analysis of the EBSD data was conducted using ImageJ image (Schneider et al., 2012).
4 Results
4.1 Sample description
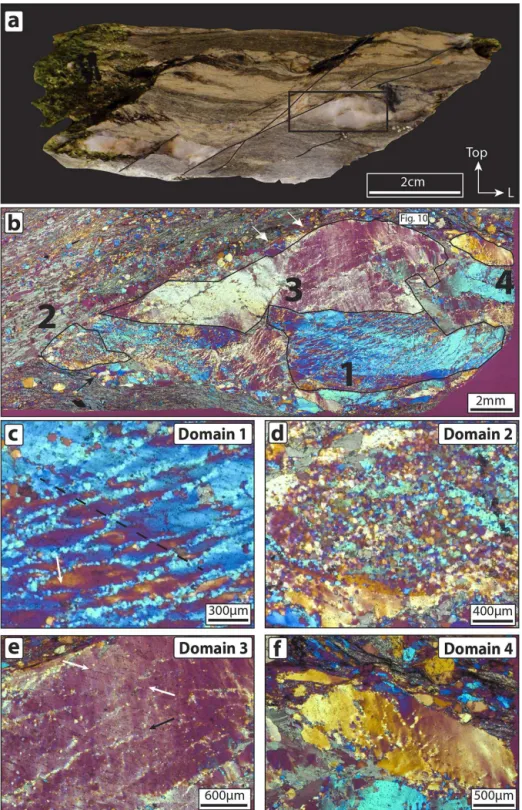
The studied sample is from a quartz vein and its host rock at an outcrop (green star in Figs. 1 and 2), where the main NFZ foliation developed at the expense of metabasalt. The vein is cut and offset by top-to-the-SEC′ shear bands that impart the outcrop a pervasive ECC. The hand specimen is a well-foliated phyllonitic rock containing a centimetric clast of the quartz vein bound by and offset along a centimetric scale shear band, with numerous smaller shear bands also deforming the vein (Fig. 3a). The phyllonitic foliation is pas-sively dragged into the shear bands confirming the kinemat-ics determined by field observations (Figs. 2a, 3a and 4a).
The phyllonitic foliation is defined by layers consisting of varying amounts of feldspathic clasts with albitic com-position within a phyllosilicate-rich matrix of chlorite and sericitic white mica. The grain size of the phyllonite is very fine, usually < 50 µm, except for some residual dolomitic por-phyroclasts, which are up to > 1 mm in size. Feldspar clasts range in size from < 200 to > 1000 µm and are locally asym-metrically boudinaged and deformed by small shear bands. The neck zones of the boudins are commonly filled with new grains of feldspars (Fig. 4a). Small-scale shear bands locally indicate both dextral and sinistral sense of shear, suggesting a component of flattening.
Several euhedral sulfide porphyroblasts, partially broken down to oxides, are dispersed in the phyllonite and within the vein; some are also symmetrically boudinaged and fi-brous quartz is present in the neck domains and pressure shadows (Fig. 4b). Sigmoidal dolomite porphyroclasts are commonly observed. Syntaxially filled calcite veinlets occur sub-parallel to the mylonitic foliation. These veinlets gener-ally accommodated more than one opening event (Fig. 4e)
The studied vein clast consists primarily of quartz with only minor primary calcite. Secondary calcite and accessory sulfides are found both within the quartz crystals and along the grain boundaries. Quartz crystals within the vein range in size from < 0.5 to > 6 mm (Fig. 3b) and show neither a clear crystal preferred orientation (CPO; Figs. 6–9b) nor a shape-preferred orientation (SPO). However, the number of primary quartz grains included in the studied thin section is low, so that we cannot rule out that the quartz vein displayed an ini-tial SPO and CPO. In general, the boundaries between the in-dividual grains are slightly irregular but straight, which gives the individual quartz crystals a blocky appearance (Fig. 3b), although the vein-matrix contact is generally more rounded.
4.2 Microstructural and EBSD analysis
Because of the marked microstructural differences that we have observed within the quartz vein, we have identified and studied in detail several domains, each characterized by in-ternally consistent microstructures. Our study reports four representative domains that are described individually below. Table 1 and Figs. 6–9 sum up the main CPO elements con-strained by petrographic and EBSD analysis.
Several quartz crystals contain narrow bands of much finer grains. In the text these grains are referred to as nucleated “new grains” and are distinguished from the parent grains or “old grains” based on aspect ratio, grain size and misorienta-tion angle to neighbor grains. In detail, all grain boundaries were defined as misorientations larger than 10◦(e.g., Trep-mann et al., 2007).
4.2.1 Domain 1
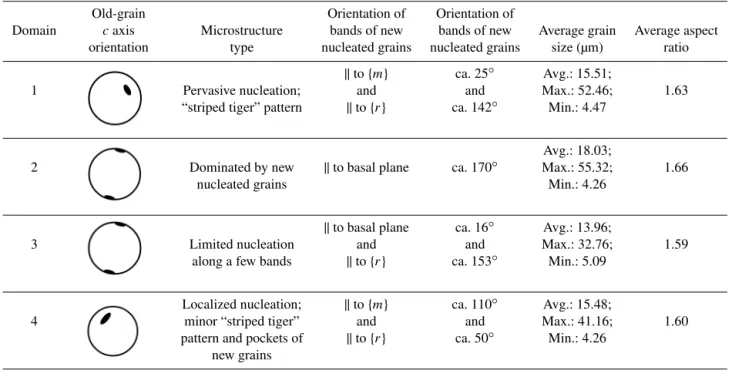
Domain 1 (Fig. 3b and c) is found within a single crys-tal measuring 6×3 mm. It contains a tightly spaced set of sub-parallel and semi-straight bands of nucleated grains. The bands are sub-parallel to theC′ shear planes that offset the quartz vein. They are continuous for several millimeters and are on average 30 µm thick (1–3 grains thick). We name this microstructure “striped tiger”. Bridges between the most pro-nounced bands are observed (white arrow in Fig. 3c). The nucleated grains vary in size between ca. 10 and 60 µm, have a slightly elongated shape and constitute ca. 40 % of the area of the domain. Fluid inclusions occur within the bands where they commonly encircle the nucleated grains. Much smaller fluid inclusions (< ca. 2 µm) are instead abundant and apparently randomly distributed within the host old crystal (Fig. 4d). Some bands also contain small (ca. 50 µm) calcite grains interspersed among the new quartz grains (Fig. 4f).
The host grain displays undulose extinction, which is de-fined by wide extinction bands (WEBs; Derez et al., 2014; black dashed line in Fig. 3c). These are sub-parallel to local fluid inclusion traces that also appear to be cut by the bands of new grains (Fig. 4f). WEBs have an antithetic geometry to the large shear band that cuts through and offsets the quartz vein in the hand specimen (Fig. 3a, b and c) and are them-selves cut by the bands of new grains (Fig. 3b, c and f).
H. J. Kjøll et al.: Deformation of vein quartz under fluid-rich lower greenschist facies conditions 687
Figure 4.All the photomicrographs are taken with crossed polarizers.(a)Albitic feldspar crystals asymmetrically cut and offset by dextral shear bands within the sheared, phyllosilicate-rich foliation of the NFZ. Minor recrystallization of the plagioclase can be seen in some of the shear bands.(b)Euhedral pyrite crystal partially altered to oxides with fibrous quartz and mica growing in the fringes, surrounded by chlorite.(c)Bulging grain boundaries and subgrains indicate low-grade deformation of the vein quartz.(d)Small mica grain within a band of new grains in Domain 3. Fluid inclusions outline the new grains (black arrows) and partially define the band. New grains are seen as different shades of gray.(e)Calcite veinlet displaying several opening events, with fine-grained quartz at the matrix boundary with large, elongated calcite crystals and smaller equidimensional grains with some interspersed sulfides in the center. FoliationSdragged into theC′shear band. (f)Microcracks sub-parallel to the rhomb plane and WEBs in Domain 1, cut by bands of new grains. Microcracks contain secondary phases (calcite) and show incipient recrystallization of quartz. Bands of new grains also show secondary phases (calcite, muscovite).
two sets of bands in the domain, one pervasively developed and one subordinate. The more developed set contains bands that are sub-parallel to the prism plane of the host old grain (dashed line in the pole figure of the prism, m; Fig. 6b) and thus are oriented sub-parallel to the sample-scale C′ shear band and with an average 25◦angle to the foliation, when measured counterclockwise. The less developed bands are seen in the lower left corner of the EBSD map (white ar-row in Fig. 6a) and are sub-parallel to the rhomb (dashed line in the pole figure of the rhomb, {r}; Fig. 6b) forming an angle of ca. 142◦ to the foliation,S, measured counter-clockwise. The new grains within the bands are slightly
Table 1.Summary of microstructures.
Old-grain Orientation of Orientation of
Domain caxis Microstructure bands of new bands of new Average grain Average aspect orientation type nucleated grains nucleated grains size (µm) ratio
|| to{m} ca. 25◦ Avg.: 15.51;
1 Pervasive nucleation; and and Max.: 52.46; 1.63
“striped tiger” pattern || to{r} ca. 142◦ Min.: 4.47
new
Avg.: 18.03;
2 Dominated by new || to basal plane ca. 170◦ Max.: 55.32; 1.66
nucleated grains Min.: 4.26
|| to basal plane ca. 16◦ Avg.: 13.96;
3 Limited nucleation and and Max.: 32.76; 1.59
along a few bands || to{r} ca. 153◦ Min.: 5.09
m
and poc
Localized nucleation; || to{m} ca. 110◦ Avg.: 15.48;
4 minor “striped tiger” and and Max.: 41.16; 1.60
pattern and pockets of || to{r} ca. 50◦ Min.: 4.26 new grains
H. J. Kjøll et al.: Deformation of vein quartz under fluid-rich lower greenschist facies conditions 689
Figure 6.Compilation of EBSD data from Domain 1 (see Fig. 3b and c for location of the domain).(a)EBSD map color-coded according to the inverse pole figures (IPFs) for quartz shown in lower right corner of map. The IPF is with respect to the X direction of the finite strain ellipsoid (stretching lineation of the phyllonite). Black lines: grain boundaries defined by misorientations > 10◦. Green lines: subgrain boundaries defined by misorientations < 10◦. Black grains are calcite. White line 1 (I–IV) and 2 (I–II) are the traces of misorientation profiles in(d). (bandc) Pole figures of quartz showing the orientation of[c],{r},{m}and <a> for old and new grains, respectively. The stereograms are upper hemisphere projections of 10 000 random points. Dashed lines represent the trace of the bands of new grains and the crystallographic plane they are parallel to.(d)Misorientation profiles displaying difference in orientation to neighbor pixel (red line) and to reference orientation (i.e., orientation of pixel at (I); blue line).(e)Rose diagram displaying the orientation of the long axis of the new grains with respect to the trace ofC′,S(horizontal) and the crystallographic planes that the bands are parallel to.(f)Histogram displaying grain size distribution of the new grains.
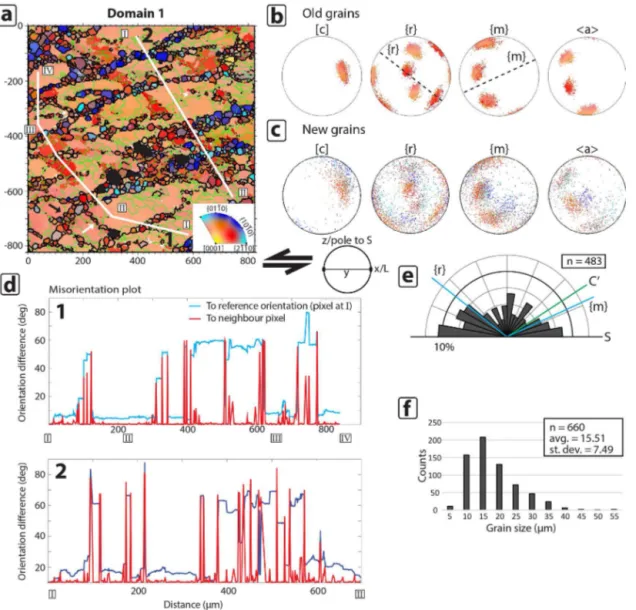
4.2.2 Domain 2
Domain 2 is located at the tip of the quartz vein, where the latter is sandwiched by the foliation S and the micaceous shear plane C′ of the host phyllonite (Fig. 3b). It contains abundant secondary calcite and cavities from sample prepa-ration show pitted grain boundaries (Fig. 5d). Grain size dis-tribution is unimodal. The domain is almost completely made up of new grains (Figs. 3d and 7a), although local relics of a
few host old grains (up to 80 µm in size) can still be recog-nized (Fig. 7a).
Figure 7.Compilation of textural data from Domain 2 (see Fig. 3b and d for its location).(a)EBSD map of crystallographic orientation of quartz. Color-coding and boundary types like in Fig. 6. Black grains are calcite. White line I–IV: trace of misorientation profile in(d). (band c) Pole figures of quartz showing the orientation of[c],{r},{m}and <a> for old and new grains, respectively. The stereograms are upper hemisphere projections of 10 000 random points. Dashed lines represent the trace of the bands of new grains and the crystallographic plane they are parallel to.(d)Misorientation profiles displaying difference in orientation to neighbor pixel (red line) and to reference orientation (i.e., orientation of pixel at (I); blue line).(e)Rose diagram displaying the orientation of the long axis of the new grains with respect to the trace ofC′,S(horizontal) and the crystallographic planes which the bands are parallel to.(f)Histogram displaying grain size distribution of the new grains.
average grain size of all domains and the highest average as-pect ratio, with 18.03 and 1.66 µm, resas-pectively (Fig. 7e, f and Table 1). There is no obvious preferred elongation di-rection of the new grains (Fig. 7e). The new-grain crystallo-graphic orientations are broadly scattered around those of the old grains. The new grains have a high and sharp misorienta-tion to each other and to the old grains, and they are relatively strain free. No progressive lattice rotation is visible towards the new grains (Fig. 7d).
4.2.3 Domain 3
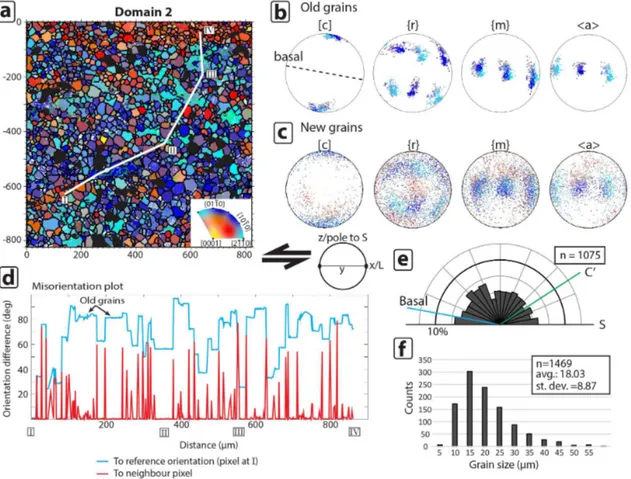
The upper part of the vein hosts a large grain measuring 5×3 mm, which hosts Domain 3 of our study (Fig. 3b and e). The grain displays sweeping and patchy undulose ex-tinction with upright WEBs and two sets of bands of new grains. The new grains in these bands are less developed than in other domains. The most pronounced set is recog-nized due to its slightly different extinction direction
com-pared to the host. Generally, there are few new grains within these bands, although some local, isolated pockets of new grains occur (Fig. 3e). The new grains are encircled by fluid inclusions and some tiny muscovite grains (ca. 20 µm; Fig. 4d), and their grain boundary microstructure shows ev-idence for porosity and solution-precipitation features (e.g., Mancktelow and Pennacchioni, 2004; Fig. 5). The bands and fluid inclusion trails define patchy undulose extinction pat-terns (bLEBs; Derez et al., 2014). The second set of bands is seen as semi-straight trails of small fluid inclusions (< ca. 2 µm), with no visible recrystallization. The left half of the domain is characterized by sub-parallel fluid inclusion trails. No nucleation of new grains is seen along these traces (white arrows in Fig. 3e).
H. J. Kjøll et al.: Deformation of vein quartz under fluid-rich lower greenschist facies conditions 691
Figure 8.Compilation of textural data from Domain 3 (see Fig. 3b and e for its location).(a)EBSD map of crystallographic orientation of quartz. Color-coding and boundary types like in Fig. 6. Black grains are calcite. White line I–II: trace of misorientation profile in(d). (band c) Pole figures of quartz showing the orientation of[c],{r},{m}and <a> for old and new grains, respectively. The stereograms are upper hemisphere projections of 10 000 random points. Dashed lines represent the trace of the bands of new grains and the crystallographic plane they are parallel to.(d)Misorientation profiles displaying difference in orientation to neighbor pixel (red line) and to reference orientation (i.e., orientation of pixel at (I); blue line).(e)Rose diagram displaying the orientation of the long axis of the new grains with respect to the trace ofC′,S(horizontal) and the crystallographic planes which the bands are parallel to.(f)Histogram displaying grain size distribution of the new grains.
with the bulk sinistral sense of shear (Fig. 8b). The host old grains display a clear single-crystal maximum with very lit-tle dispersion of thecaxis and <a> axes, although some un-dulose extinction can be inferred. The bands and clusters of new grains are oriented at ca. 16◦ to the foliationS, mea-sured counterclockwise, which makes them sub-parallel to the basal plane of the old grain (dashed line in Fig. 8b). In the central and left parts of Domain 3, fluid inclusion trails are observed. These trails are sub-parallel to the rhomb di-rection (white arrows in Fig. 3e, and dashed line in Fig. 8b) and are oriented at 153◦measured counterclockwise from the foliationS.
The average grain size of the new grains is 13.96 µm (Fig. 8e and Table 1) and they have an average aspect ra-tio of 1.59 (Fig. 8f) with the preferred elongara-tion at ca. 115◦ measured counterclockwise from the foliation S. The crys-tallographic planes and directions of the new grains are
scat-tered around those of old grains (Fig. 8c and b, respectively). The data seem to have been rotated counterclockwise around they axis. This domain has the smallest grain size, both av-erage and maximum and the lowest aspect ratio (Table 1 and Fig. 8e and f). The measured misorientation profile shows that the orientation difference between neighbor old grains is quite large. Locally, subgrain boundaries grade to high-angle boundaries with misorientations in excess of the threshold value of 10◦ (black arrows in Fig. 8a and d), whereas new grains display misorientations of up to 20◦ with respect to neighbor grains (Fig. 8d). In addition, misorientation profiles locally show what appears to be a progressive lattice rotation towards the grain boundaries.
4.2.4 Domain 4
Figure 9.Compilation of textural data from Domain 4 (see Fig. 3b and f for its location).(a)EBSD map of crystallographic orientation of quartz. Color-coding and boundary types like in Fig. 6. Black grains are calcite. White line I–IV: trace of misorientation profile in(d). (band c) Pole figures of quartz showing the orientation of[c],{r},{m}and <a> for old and new grains, respectively. The stereograms are upper hemisphere projections of 10 000 random points. Dashed lines represent the trace of the bands of new grains and the crystallographic plane they are parallel to.(d)Misorientation plot displaying difference in orientation to neighbor pixel (red line) and to reference orientation (i.e., orientation of pixel at (I); blue line).(e)Rose diagram displaying the orientation of the long axis of the new grains with respect to the trace ofC′,S(horizontal) and the crystallographic planes which the bands are parallel to.(f)Histogram displaying grain size distribution of the new grains.
density of feldspar clasts wrapped in an anastomosed phyl-lonitic matrix with shear indicators suggesting opposite kine-matics than the top-to-the-SE regional sense of shear accom-modated by the NFZ. Microstructurally the crystal resem-bles Domain 1, with a “striped tiger” microstructure. In Do-main 4, however, two well-developed sets of bands with new grains occur, in contrast to Domain 1 where there is only one well-developed direction. One direction, inclined towards the right, is the most pronounced, whereas the one inclined to the left is slightly less pervasive. The traces of the two bands are separated by ca. 70◦. Insertion of the lambda plate reveals that the main band of new grains also separates two subdo-mains within the single crystal with a slight misorientation to each other. The crystal contains some randomly arranged fluid inclusions.
Domain 4 has an old grain with acaxis located in an in-termediate position between thez andy axis of strain and
H. J. Kjøll et al.: Deformation of vein quartz under fluid-rich lower greenschist facies conditions 693
Figure 10. (a)EBSD map crystallographic orientation of quartz of area located within Domain 3 (see Fig. 3b for location). Color-coding and boundary types like in Fig. 6. The map shows Dauphiné twins where one twin, ther-twin, has accommodated more viscous strain than thez-twin, as seen from the pole figures in(b). See text for further explanation.
bands is sharp and not progressive (Fig. 9d), although a small shift in orientation is seen across the band. Furthermore, the boundary is 60◦, which indicates that the band might exploit a Dauphiné twin boundary.
5 Discussion
5.1 Strain accommodation history within the different domains
Our data set documents examples of quartz microstructures developed in a fluid-rich system deformed under low-grade metamorphic conditions. In our conceptual understanding, initial embrittlement of the host greenstones was accommo-dated by fracturing, fluid circulation and quartz (and car-bonate) precipitation as vein material. The initial crystalliza-tion of the vein occurred statically, resulting in a seemingly random crystallographic orientation of the constituting large quartz crystals during the Paleoproterozoic. Later, pervasive viscous deformation led to strain accommodation within the vein and development of the ECC in the host greenstones. Viscous deformation, however, was interrupted by transient episodes of embrittlement, which we relate to both the crys-tallographic framework inherited from the statically crystal-lized vein and the oscillations of the pressure of the fluid phase that was present during continued deformation related to the thrusting history along the NFZ.
This structural evolution is summarized conceptually in Fig. 11, supported by the summary of Table 1 and discussed in detail below.
Following initial fracturing and vein crystallization (pos-sibly related to early Caledonian deformation or even to the Paleoproterozoic evolution of the region; Fig. 11a), the vein became progressively involved in the Caledonian
deforma-tional history of the NFZ, wherein top-to-the-SE thrusting led to the progressive development of the fault zone. En-vironmental conditions were such that quartz began to de-form by low-grade crystal-plastic dede-formation by dislocation glide and possibly creep (Fig. 11b). Two main mechanisms are believed to have controlled this stage of the microstruc-tural evolution: (1) strain partitioning resulting from the high competence contrast between the vein and the surrounding greenstone, which was evolving into a progressively foliated and finer-grained phyllonite as strain was accommodated in the core of the NFZ (Trepmann and Stöckhert, 2009); and (2) presence of fluids as documented by the numerous vein-lets, secondary phases trapped along grain boundaries, pit-ted grain boundaries and fluid inclusions (e.g., Drury and Urai, 1990; Mancktelow and Pennacchioni, 2004; Manck-telow et al., 1998; Fig. 11b). Low-grade viscous deforma-tion produced structures such as bulging grain boundaries (Fig. 4c) caused by slow grain boundary migration (Stipp et al., 2002), sweeping undulatory extinction, subgrains, bLEBs and WEBs (Derez et al., 2014; Figs. 3b–f and 4f). EBSD analysis has shown remarkably different microstructures and CPO patterns in the analyzed domains that can be assigned to this microstructural stage. We ascribe this to the fact that each domain had a different crystallographic orientation, due to the static initial crystallization in the vein and the location of individual domains with respect to the mesoscopic struc-tural features, such as theC′shear band.
(Torg-ersen and Viola, 2014), ideal for activation of basal <a> slip (e.g., Stipp et al., 2002). The crystal of Domain 1 was, however, misoriented for basal <a> slip. Some strain was nonetheless taken up in a ductile fashion in Domain 1 by the development of WEBs (Derez et al., 2014) and possi-bly by dislocation creep, as shown by the subgrain bound-aries. Since easy-glide planes were oriented at a high angle to theC′shear band, dislocation glide and creep soon resulted ineffective, leading to strain hardening, possibly by dislo-cation tangling, and localized embrittlement of the deform-ing quartz accommodated by fracturdeform-ing. Transiently high fluid pressure is also believed to have contributed to local-ized and short-lived embrittlement as the fluid factorλ ap-proached unit value (e.g., Cox, 2010; Hubbert and Rubey, 1959; Fig. 11c). Evidence for fluid-accompanied fracturing, such as fluid inclusion trails (Figs. 5b, c, 4d and f), is in-variably found in the studied samples and within the NFZ in general.
The fractures developed during this stage of the structural evolution of Domain 1 are invariably intra-granular, which points towards sub-critical crack growth, by, for example, stress corrosion, microplasticity or general plasticity (e.g., Atkinson, 1982, 1984; Stünitz and Fitz Gerald, 1993). De-velopment of volumetrically small gouges along the fracture planes is also envisaged (Stünitz et al., 2003; Fig. 11c, insert). The sub-parallel orientation of the fractures suggests in ad-dition that they formed controlled by specific lattice planes, that is, planes with a low density of covalent bonds and thus low surface energy (e.g., Fairbairn, 1939; Flörke et al., 1981; Vollbrecht et al., 1999; van Daalen et al., 1999; Figs. 6, 8 and 9).
The weakest crystallographic plane in quartz is the posi-tive rhomb, both in terms of surface energy and elastic prop-erties (Menegon et al., 2011). Van Daalen et al. (1999) report what they refer to as “micro shear zones”, that is, bands of new grains along the positive and negative rhomb planes. The two sets of bands with nucleated new grains within Domain 1 are sub-parallel to the prism and the rhomb face of the crys-tal. The prism plane direction, parallel to which we find the most pervasive set of bands of new grains, was the optimally oriented direction for brittle failure, as it is sub-parallel to the actual slip plane of the mesoscopic system, that is, theC′ shear band (Fig. 6e). The rhomb, although oriented at high angle to the shear band, is the weakest crystallographic plane in quartz, and, therefore, it did also fail. The geometric orien-tation of the rhomb was such that it was suitably oriented to accommodate strain along the antithetic direction of a conju-gate set of fractures.
Furthermore, the anisotropy of the elastic properties of quartz may also have contributed to promoting preferential failure along specific crystallographic planes (Menegon et al., 2011; McSkimin et al., 1965). This is suggested by Do-main 3 (small square in Fig. 3b), wherein Dauphiné twins are deformed unevenly, with the r-twin accommodating more plastic strain than thez-twin (Fig. 10a;r-twin andz-twin
ter-Figure 11.Conceptual sketch of the temporal evolution of the stud-ied quartz vein with associated microstructures. See text for further details.λ−1σdiagrams (Cox, 2010) illustrate the transient evolu-tion of fluid overpressure.
minology after Menegon et al., 2011). The pole figures in Fig. 10b show that the pole to one of the positive rhombs is oriented close to the Z direction of finite strain (bulk shorten-ing direction). This orientation corresponds to ther-twin ori-entation and, accordingly, ther-twin is more deformed than thez-twin (as evident from the more pronounced dispersion of the poles to{r}compared to the poles to{z}, which indi-cates a higher degree of internal distortion of ther-twin). The twin with the negative rhomb facing the same direction (the z-twin) is stiffer and did not accommodate the same amount of viscous strain.
H. J. Kjøll et al.: Deformation of vein quartz under fluid-rich lower greenschist facies conditions 695
In contrast to Domain 1, Domain 3 was more suitably ori-ented for effective accommodation of viscous deformation, with the basal plane oriented close to the C′ shear band, that is, well oriented for slip along the basal <a> (Schmid and Casey, 1986). Domain 3, however, also contains two sets of bands with new grains, although more poorly developed than in Domain 1 (Figs. 3e and 8). The bands parallel to the basal planes show a larger amount of recrystallization than those parallel to the rhomb planes. Furthermore, mis-orientation profiles locally show a progressive mismis-orientation from the old grain to the new grains along the basal-parallel bands. This suggests that subgrain rotation recrystallization was probably operative in Domain 3. A crystal with the ori-entation of Domain 3 would have been more prone to accom-modate strain by dislocation glide and creep, and would thus not strain harden as much as Domain 1. In addition, one set of fractures would have had to form along the basal plane of the crystal, which is not a crystal plane with particularly low surface energy or Young’s modulus. We interpret the second set, sub-parallel to the rhomb, as sealed fractures. It is worth noting that the positive rhomb is the most compliant crys-tallographic plane in quartz and, therefore, tends to localize fracturing (McSkimin et al., 1965; Lloyd, 2000; van Daalen et al., 1999). EBSD analysis reveals that some new grains de-veloped also along these fractures, but mostly in the junctions where the two fracture sets intersect. However, new-grain nu-cleation along fracture planes parallel to the rhomb is not nearly as pervasive as along the other fracture in the same domain or any of the other fractures in Domain 1 (Figs. 8a and 6a). We suggest that these fractures opened during an earlier embrittlement event, possibly under different physical boundary conditions, wherein the fractures healed by epitax-ial growth on the fracture wall, thus not creating an orienta-tion difference, but rather parallel trails of fluid inclusions. In summary, we argue that less pervasive domainal fractur-ing affected Domain 3, and that crystal-plastic deformation and recovery were locally operative due to the suitable orien-tation of the domain for slip along the basal <a> system.
The quartz crystal of Domain 4 was oriented similarly to the one in Domain 1 and it thus underwent only lim-ited crystal-plastic deformation, with the latter strongly in-hibited by early strain hardening, possibly promoted by dis-location tangling, resulting in undulose extinction and do-mainal fracturing. Similarly to Domain 1, Domain 4 is also characterized by fracturing along the prism and the rhomb planes (Fig. 9b). Both directions are fairly well developed, but the prism-parallel bands are more continuous. In this do-main the rhomb-parallel set has a similar orientation as theC′ shear band, while the prism-parallel set developed along the antithetic direction of the conjugate set. This fits well with the mesoscopic geometry of the vein, which is boudinaged (Fig. 3a).
Domain 2 is remarkably different from all other sites. In it, the orientation of the now almost totally obliterated old grains is similar to that of Domain 3, that is,
opti-mal for glide-accommodated creep with slip along the basal < a >. Despite the similarity in orientation, however, the mi-crostructures observed are remarkably different, with Do-main 2 displaying a significant volume of new grains and with only very few remnants of the old grains (Figs. 3d, 7a and d). We ascribe the pervasive nucleation of Domain 2 to its location. The domain is located in a relatively high strain zone between theC′ shear plane and the foliation, where the tip of the vein is dragged into the C′ shear bands. We argue that Domain 2 represents a high-strain equivalent to Domain 3, where crystal-plastic deformation along the basal plane possibly coupled with nucleation and growth of new grains along rhomb-parallel fractures (like in Domain 2) re-sulted in extensive recrystallization. The high density of sub-grain boundaries in the remnant old sub-grain (Fig. 7a and d) suggests that crystal-plasticity has been active to the same extent as in Domain 3 and has contributed in developing the microstructures observed in the sample.
5.2 Sealing of the microfractures
As discussed above, domainal fractures were sealed by equigranular and slightly elongated, strain free quartz crys-tals that show a slight rotation about the bulk vorticity axis (Y direction of finite strain). We propose that two main mecha-nisms were responsible for the formation of the observed mi-crostructure: (1) precipitation of new grains into the fracture promoted by circulating fluids (Menegon et al., 2008; Hip-pertt and Egydio-Silva, 1996; Vernooij et al., 2006a). New grains started to grow by a solution-precipitation mechanism promoted by the fluids that were forced into the fracture be-cause of the high fluid pressure; and (2) as fractures propa-gated through the crystal, possibly by localized stress corro-sion (e.g., van Daalen et al., 1999; Vernooij et al., 2006b), fragments of the host grain were ripped loose generating mi-cro gouges, especially in volumes with jogs and geometric irregularities along the fracture planes (Fig. 11c). This mech-anism explains the rotation of the crystallographic axes as shown by the EBSD data (Figs. 6c, 7c and 10c, insert). Sub-sequent growth of the new grains occurred either by precipi-tation from the actively infiltrating over pressured fluid (solu-tion precipita(solu-tion; Vernooij et al., 2006a) or by solu(solu-tion trans-fer from one pore wall to another (dissolution precipitation; Hippertt and Egydio-Silva, 1996). This model explains Do-main 1 and 4, where fractures formed pervasively.
may have acted as conduits for fluids during deformation and initiated solution precipitation in pores and micro fractures oriented along the subgrain and grain boundaries. Fluid in-filtration may also have led to hydrolytic weakening, which is known to promote local climb-accommodated dislocation creep (e.g., Kronenberg et al., 1990; Mancktelow and Pen-nacchioni, 2004). This could account for the few observed bands of subgrains. The growth of new grains within pores is well described by Hippertt and Egydio-Silva (1996) and results in intrapore grains, which first grow by solution pre-cipitation followed by grain boundary migration when they touch the opposite fracture wall (Fig. 11c, insert and d, in-sert). Because the new grains are largely strain free, they grew at the expense of the old grains, which are more de-formed and have a higher dislocation density (e.g., Drury and Urai, 1990). Furthermore, Schmid and Casey (1986) pro-posed that grains growing by grain boundary migration tend to grow optimally oriented for basal slip, i.e., with the basal plane at 45◦toσ1(Vernooij et al., 2006a). This mechanism could have also contributed to the rotation of the new-grain crystals seen in the EBSD data (Fig. 6).
As also proposed by several authors (e.g., Derez et al., 2014; Vernooij et al., 2006a; Trepmann et al., 2007), we con-clude that dynamic recrystallization by subgrain rotation re-crystallization can be excluded for the formation of the bands containing new grains in Domain 1 and 4. We base our in-terpretation on the following: (1) no progressive lattice rota-tion towards the bands of new grains is observed (Figs. 6d and 9d); (2) the new grains show large misorientations to the host (Figs. 6d and 9d) at low strains, making grain bound-ary sliding unlikely; (3) new grains are subhedral to euhedral with 120◦angles between the crystal faces, indicating growth within a fluid (Hippertt and Egydio-Silva, 1996); (4) fluid in-clusions encircle the new grains and their pitted grain bound-aries (Figs. 4d and 5); and (5) secondary mineral phases oc-cur between the new grains indicating that fluids penetrated the crystal (Figs. 4d, 5c and d).
New grains, however, have also accommodated some crystal-plastic deformation, because the embrittlement of the system is believed to have occurred only transiently as fluid pressure reduced the effective stresses and caused failure by brittle processes. As stress was released by the opening of intracrystalline fractures and venting of the overpressured fluid phase, viscous deformation became dominant, possi-bly also promoted by residual fluids (Segall and Simpson, 1986). This renewed viscous environment during ongoing deformation enhanced dislocation glide and possibly even lo-cal climb, which caused bulging grain boundaries, subgrain formation (Figs. 10d and 4c) and, as noted above, growth of new grains at the expense of old grains by grain bound-ary migration (Fig. 11d, insert). Vernooij et al. (2006a) and Trepmann et al. (2007) also report partially deformed new grains that show flattening and hence elongation perpendic-ular toσ1. Recrystallization in Domain 2 and 3 was largely the result of crystal plasticity and subgrain rotation due to
the suitable orientation of the crystal for the activation of the basal <a> slip system. Only a minor component of fracturing and neo-crystallization along the rhomb plane is envisaged.
In summary, we propose a model of alternating brittle and viscous deformation localized in intracrystalline bands hosted in vein quartz crystals (e.g., Hirth and Beeler, 2015; Fig. 4f). The relative role of subgrain rotation recrystalliza-tion as opposed to neocrystallizarecrystalliza-tion along microcracks is de-termined by the crystallographic orientation of the host grain, which results in remarkably different microstructures and in-ternal partitioning of strain. Transmission Electron Micro-scope (TEM) analysis of dislocation microstructures in the interior of the old grains and next to the bands of new grains would be necessary to verify and confirm some of our con-clusions.
5.3 Mechanical implications for the PIS development The described microstructures and the proposed conceptual model have implications on both the local geological history and on the rheological properties of quartz and phyllonitic rocks.
The exact timing of vein emplacement remains largely un-constrained. The fact that the vein crystallized statically prior to being cut by a shear band of Caledonian age within the fault core of the NFZ and that it belongs structurally to a Caledonian imbricate structure (Torgersen and Viola, 2014; Torgersen et al., 2014) demonstrates that the vein is pre- to syntectonic. Whether the vein crystallized during the Paleo-proterozoic and was later reworked during Caledonian defor-mation or it formed during the Paleozoic Caledonian orogeny is not known.
disso-H. J. Kjøll et al.: Deformation of vein quartz under fluid-rich lower greenschist facies conditions 697
lution at the vein-matrix contact may have occurred (white arrows in Fig. 3b). The progressively increasing competence contrast between the phyllonitic matrix and the quartz vein generated significant strain partitioning, wherein coaxial de-formation was accommodated by the quartz vein (e.g., the described conjugate shear bands) and non-coaxial deforma-tion by the matrix, as shown by, for example, rotated por-phyroclasts and asymmetric shear bands (e.g., Goodwin and Tikoff, 2002; Menegon et al., 2008). This rheological con-trast is also believed to be crucial for the transient embrit-tlement of the quartz vein as already argued for in the dis-cussion above. Both the phyllonite S andC′ planes, due to their interconnected anastomosing geometry and low coef-ficient of friction, deformed at a significantly higher strain rate than the quartz vein. This contrast enhanced quartz strain hardening, possibly by dislocation tangling within the vein, because deformation mechanisms within the matrix (such as dissolution-precipitation creep and grain boundary sliding) were much more effective than glide-accommodated dislo-cation creep.
The NFZ deformed in a fluid-rich system as shown by a plethora of microstructures within both the matrix and the vein quartz (e.g., Fig. 4). Several authors have stressed the importance of fluids in promoting viscous deformation in quartz (e.g., Kronenberg and Tullis, 1984; Mancktelow and Pennacchioni, 2004) and the role played by fracturing in dis-tributing fluids within a rigid body located in a weak ma-trix (Menegon et al., 2008). Calcite veinlets within the C′ shear bands indicate multiple opening events and thus point towards a fluid pressure cyclicity (λ/1σ plot in Fig. 11b–d). Similar conditions are also described from other parts of the PIS, such as the Kvenklubben Fault some kilometers west of the NFZ (Torgersen and Viola, 2014).
Although the weak phyllonitic core of the NFZ could be interpreted as suggesting that the fault deformed mainly by aseismic creep, the current fault architecture has to be pro-jected against its temporal dynamic evolution. Initial strain accommodation occurred in fact under different rheological conditions, with transient embrittlement of a > 20 m thick dolostone layer possibly inducing seismic stick-slip behav-ior as also suggested by other localities within the PIS. Com-parison of the microstructures described here with the re-sults of Trepmann et al. (2007) and the work by Hirth and Beeler (2015) corroborates the interpretation of the NFZ as a fault that possibly accommodated coseismic deformation.
The cyclic fluid overpressuring in the NFZ might have played an important role in steering deformation towards a more discrete accommodation style, resulting in cyclic os-cillations between brittle and viscous deformation in a fault-valve behavior that facilitated the translation of the Caledo-nian nappes to the foreland (Viola et al., 2006), but also pos-sibly promoted seismic activity by stick-slip behavior.
6 Conclusions
The microstructures presented in this study contribute to the refined understanding of the mechanisms that accommodate strain in quartz during deformation at the brittle–viscous transition. Our observations confirm results from earlier stud-ies and in addition allow refining existing conceptual models by showing the following.
1. Under fluid-rich conditions typical of lower greenschist facies metamorphism, quartz may fracture pervasively along several intracrystalline planes such as the prism, the rhomb, and, to a minor extent, the basal plane. The exploited direction of preferential fracturing depends on the orientation of the crystallographic planes with re-spect to the imposed stress field.
2. Viscous weakening mechanisms, such as effective crystal-plastic deformation, may reduce the need for embrittlement. However, if crystals are misoriented for optimal dislocation glide, strain hardening occurs, which promotes the onset of fracturing. Microfracturing and viscous deformation may occur, however, broadly coevally and cyclically.
3. Nucleation processes can heal and seal the microfrac-tures. Solution-precipitation is the mechanism believed to control the process. Only minor recovery by sub-grain rotation recrystallization is observed, selectively on those grains suitably oriented for slip on the basal <a> system.
4. Cyclic fluid pressure oscillations promoted continuous switches in deformation mechanisms that resulted in transient and possibly seismogenic brittle deformation processes. Aseismic creep rapidly followed these as fluids were vented, and the host phyllonite developed a penetrative, thoroughgoing anastomosing network of weak slip planes.
5. Fluid-assisted breakdown of the host metabasalt formed the weak phyllonite, which promoted strain partition-ing into the matrix rather than in the quartz vein, which escaped most strain. Rheological contrasts between the weak, foliated host and the more rigid quartz vein also contributed to the transient embrittlement of quartz in the vein, providing positive feedback to the embrittle-ment caused by the presence of overpressured fluids.
handling. Tine Derez is thanked for constructive feedback. Es-pen Torgersen is warmly thanked for very many long and fruitful discussions!
Special Issue: “Deformation mechanisms and ductile strain localization in the lithosphere”
Edited by: L. Menegon, G. Pennacchioni, M. Stipp, N. Mancktelow, and R. Law
References
Adams, B. L., Wright, S. I., and Kunze, K.: Orientation imaging: the emergence of a new microscopy, Metall. Trans. A, 24, 819–831, 1993.
Atkinson, B. K.: Subcritical crack propagation in rocks: theory, ex-perimental results and applications, J. Struct. Geol., 4, 41–56, 1982.
Atkinson, B. K.: Subcritical crack growth in geological materials, J. Geophys. Res.-Sol. Ea., 89, 4077–4114, 1984.
Bachmann, F., Hielscher, R., and Schaeben, H.: Texture analysis with MTEX–free and open source software toolbox, Sol. St. Phen., 160, 63–68, 2010.
Bell, T.: Deformation partitioning and porphyroblast rotation in meta-morphic rocks: a radical reinterpretation, J. Metamorph. Geol., 3, 109–118, 1985.
Bestmann, M. and Prior, D. J.: Intragranular dynamic recrystalliza-tion in naturally deformed calcite marble: diffusion accommo-dated grain boundary sliding as a result of subgrain rotation re-crystallization, J. Struct. Geol., 25, 1597–1613, 2003.
Bos, B. and Spiers, C. J.: Frictional-viscous flow of phyllosilicate-bearing fault rock: Microphysical model and implications for crustal strength profiles, J. Geophys. Res.-Sol. Ea., 107, ECV 1-1–ECV 1-13, doi:10.1029/2001JB000301, 2002.
Chen, Y., Hjelen, J., Gireesh, S., and Roven, H.: Optimization of EBSD parameters for ultra-fast characterization, J. Microsc.-Oxford, 245, 111–118, 2012.
Cox, S. F.: The application of failure mode diagrams for exploring the roles of fluid pressure and stress states in controlling styles of fracture.controlled permeability enhancement in faults and shear zones, Geofluids, 10, 217–233, 2010.
Dallmeyer, R. D., Mitchell, J. G., Pharaoh, T. C., Reuter, A., and Andresen, A.: K–Ar and Ar-40/Ar-39 whole-rock ages of slate phyllite from allochthonous basement and cover in the tectonic windows of Finnmark, Norway – evaluating the extent and timing of caledonian tectonothermal activity, Geol. Soc. Am. Bull., 100, 1493–1501, doi:10.1130/0016-7606(1988)100<1493:Kaaaaw>2.3.Co;2, 1988.
Dell’Angelo, L. N. and Tullis, J.: Textural and mechanical evolu-tion with progressive strain in experimentally deformed aplite, Tectonophysics, 256, 57–82, 1996.
den Brok, S. W. J.: An Experimental Investigation into the Effect of Water on the Flow of Quartzite, Utrecht University, Holland, 1992.
den Brok, S. W. J. and Spiers, C.: Experimental evidence for water weakening of quartzite by microcracking plus solution-precipitation creep, J. Geol. Soc. London, 148, 541–548, 1991.
Derez, T., Pennock, G., Drury, M., and Sintubin, M.: Low-temperature intracrystalline deformation microstructures in quartz, J. Struct. Geol., doi:10.1016/j.jsg.2014.07.015, online first, 2014.
Drury, M. R. and Urai, J. L.: Deformation-related recrystallization processes, Tectonophysics, 172, 235–253, 1990.
Fairbairn, H.: Correlation of quartz deformation with its crystal structure, Am. Mineral., 24, 351–368, 1939.
Flörke, O. W., Mielke, H. G., Weichert, J., and Kulke, H.: Quartz with rhombohedral cleavage from Madagascar, Am. Mineral., 66, 596–600, 1981.
Frondel, C., Dana, J. D., and Dana, E. S.: The System of Mineral-ogy: Silica Minerals, Wiley, New York, 1962.
Gee, D. G., Fossen, H., Henriksen, N., and Higgins, A. K.: From the early Paleozoic platforms of Baltica and Laurentia to the Cale-donide Orogen of Scandinavia and Greenland, Episodes, 31, 44– 51, 2008.
Goodwin, L. B. and Tikoff, B.: Competency contrast, kinematics, and the development of foliations and lineations in the crust, J. Struct. Geol., 24, 1065–1085, 2002.
Hippertt, J. and Egydio-Silva, M.: New polygonal grains formed by dissolution–redeposition in quartz mylonite, J. Struct. Geol., 18, 1345–1352, 1996.
Hirth, G. and Beeler, N.: The role of fluid pressure on frictional behavior at the base of the seismogenic zone, Geology, 43, 223– 226, 2015.
Hirth, G. and Tullis, J.: Dislocation creep regimes in quartz aggregates, J. Struct. Geol., 14, 145–159, doi:10.1016/0191-8141(92)90053-Y, 1992.
Holyoke, C. W. and Tullis, J.: Mechanisms of weak phase inter-connection and the effects of phase strength contrast on fabric development, J. Struct. Geol., 28, 621–640, 2006.
Hubbert, M. K. and Rubey, W. W.: Role of fluid pressure in me-chanics of overthrust faulting, I. Meme-chanics of fluid-filled porous solids and its application to overthrust faulting, Geol. Soc. Am. Bull., 70, 115–166, 1959.
Kronenberg, A. K. and Tullis, J.: Flow strengths of quartz aggre-gates: grain size and pressure effects due to hydrolytic weaken-ing, J. Geophys. Res.-Sol. Ea., 89, 4281–4297, 1984.
Kronenberg, A. K., Segall, P., and Wolf, G. H.: Hydrolytic weaken-ing and penetrative deformation within a natural shear zone, in: The Brittle–Ductile Transition in Rocks, American Geophysical Union, Washington, D.C., 21–36, 1990.
Lloyd, G. E.: Grain boundary contact effects during faulting of quartzite: an SEM/EBSD analysis, J. Struct. Geol., 22, 1675– 1693, 2000.
Mainprice, D., Hielscher, R., and Schaeben, H.: Calculating anisotropic physical properties from texture data using the MTEX open-source package, Geol. Soc. Spec. Publ., 360, 175– 192, 2011.
Mancktelow, N. S. and Pennacchioni, G.: The influence of grain boundary fluids on the microstructure of quartz-feldspar my-lonites, J. Struct. Geol., 26, 47–69, 2004.
H. J. Kjøll et al.: Deformation of vein quartz under fluid-rich lower greenschist facies conditions 699
McSkimin, H., Andreatch Jr, P., and Thurston, R.: Elastic moduli of quartz versus hydrostatic pressure at 25 and−195.8◦C, J. Appl. Phys., 36, 1624–1632, 1965.
Menegon, L., Pennacchioni, G., Heilbronner, R., and Pittarello, L.: Evolution of quartz microstructure and c-axis crystallographic preferred orientation within ductilely deformed granitoids (Arolla unit, Western Alps), J. Struct. Geol., 30, 1332–1347, doi:10.1016/j.jsg.2008.07.007, 2008.
Menegon, L., Piazolo, S., and Pennacchioni, G.: The effect of Dauphiné twinning on plastic strain in quartz, Contrib. Mineral. Petrol., 161, 635–652, doi:10.1007/s00410-010-0554-7, 2011. Moen, K., Hjelen, J., and Malvik, T.: Preparation of Quartz samples
for EBSD analysis, poster presented at the Applied Mineralogy ’03 Conference, Helsinki, 17–18 March 2003.
Pharaoh, T.: Volcanic and geochemical stratigraphy of the Nussir Group of Arctic Norway – an early Proterozoic greenstone suite, J. Geol. Soc., 142, 259–278, 1985.
Pharaoh, T., Macintyre, R., and Ramsay, D.: K–Ar age determina-tions on the Raipas suite in the Komagfjord Window, Northern Norway, Norsk Geol. Tidsskr., 62, 51–57, 1982.
Pharaoh, T. C., Ramsay, D. M., and Jansen, Ø.: Stratigraphy and structure of the northern part of the Repparfjord-Komagfjord Window, Finnmark, Northern Norway, Norg. Geol. Unders. B., 337, 1–45, 1983.
Platt, J. and Vissers, R.: Extensional structures in anisotropic rocks, J. Struct. Geol., 2, 397–410, 1980.
Prior, D. J., Boyle, A. P., Brenker, F., Cheadle, M. C., Day, A., Lopez, G., Peruzzo, L., Potts, G. J., Reddy, S., and Spiess, R.: The application of electron backscatter diffraction and orienta-tion contrast imaging in the SEM to textural problems in rocks, Am. Mineral., 84, 1741–1759, 1999.
Prior, D. J., Mariani, E., and Wheeler, J.: EBSD in the earth sci-ences: applications, common practice, and challenges, in: Elec-tron Backscatter Diffraction in Materials Science, Springer US, 345–360, doi:10.1007/978-0-387-88136-2_26, 2009.
Rice, A. H. N.: Stretching lineations and structural evolution of the Kalak Nappe Complex (Middle Allochthon) in the Repparfjord–Faegfjord area, Finnmark, northern Norway, Norsk Geol. Tidsskr., 78, 277–289, 1998.
Roberts, D.: The Scandinavian Caledonides: event chronology, pa-leogeographic settings and likely modern analogues, Tectono-physics, 365, 283–299, doi:10.1016/S0040-1951(03)00026-X, 2003.
Schmid, S. and Casey, M.: Complete fabric analysis of some commonly observed quartz c-axis patterns, in: Mineral and Rock Deformation: Laboratory Studies: The Paterson Volume, American Geophysical Union, Washington, D.C., 263–286, doi:10.1029/GM036p0263, 1986.
Schneider, C. A., Rasband, W. S., Eliceiri, K. W., Schin-delin, J., Arganda-Carreras, I., Frise, E., Kaynig, V., Lon-gair, M., Pietzsch, T., and Preibisch, S.: 671 nih image to im-ageJ: 25 years of image analysis, Nat. Methods, 9, 671–675, doi:10.1038/nmeth.2089, 2012.
Segall, P. and Simpson, C.: Nucleation of ductile shear zones on dilatant fractures, Geology, 14, 56–59, 1986.
Stipp, M. and Kunze, K.: Dynamic recrystallization near the brittle–plastic transition in naturally and experimentally de-formed quartz aggregates, Tectonophysics, 448, 77–97, 2008.
Stipp, M., Stunitz, H., Heilbronner, R., and Schmid, S. M.: The east-ern Tonale fault zone: a “natural laboratory” for crystal plastic deformation of quartz over a temperature range from 250 to 700 degrees C, J. Struct. Geol., 24, 1861–1884, doi:10.1016/S0191-8141(02)00035-4, 2002.
Stünitz, H. and Fitz Gerald, J.: Deformation of granitoids at low metamorphic grade. II: Granular flow in albite-rich mylonites, Tectonophysics, 221, 299–324, 1993.
Stünitz, H., Fitz Gerald, J., and Tullis, J.: Dislocation generation, slip systems, and dynamic recrystallization in experimentally de-formed plagioclase single crystals, Tectonophysics, 372, 215– 233, 2003.
Torgersen, E. and Viola, G.: Structural and temporal evolution of a reactivated brittle–ductile fault – Part I: Fault architecture, strain localization mechanisms and deformation history, Earth Planet. Sc. Lett., 407, 205–220, doi:10.1016/j.epsl.2014.09.019, 2014.
Torgersen, E., Viola, G., Zwingmann, H., and Harris, C.: Structural and temporal evolution of a reactivated brittle–ductile fault – Part II: Timing of fault initiation and reactivation by K–Ar dating of synkinematic illite/muscovite, Earth Planet. Sc. Lett., 407, 221– 233, 2014.
Trepmann, C. A. and Stöckhert, B.: Microfabric of folded quartz veins in metagreywackes: dislocation creep and subgrain ro-tation at high stress, J. Metamorph. Geol., 27, 555–570, doi:10.1111/j.1525-1314.2009.00842.x, 2009.
Trepmann, C. A., Stöckhert, B., Dorner, D., Moghadam, R. H., Küster, M., and Röller, K.: Simulating coseismic deformation of quartz in the middle crust and fabric evolution during postseis-mic stress relaxation – an experimental study, Tectonophysics, 442, 83–104, 2007.
Tullis, J. and Wenk, H.-R.: Effect of muscovite on the strength and lattice preferred orientations of experimentally deformed quartz aggregates, Mat. Sc.d Eng. A-Struct., 175, 209–220, 1994. van Daalen, M., Heilbronner, R., and Kunze, K.: Orientation
analysis of localized shear deformation in quartz fibres at the brittle–ductile transition, Tectonophysics, 303, 83–107, doi:10.1016/s0040-1951(98)00264-9, 1999.
Vernooij, M. G., den Brok, B., and Kunze, K.: Development of crys-tallographic preferred orientations by nucleation and growth of new grains in experimentally deformed quartz single crystals, Tectonophysics, 427, 35–53, 2006a.
Vernooij, M. G., Kunze, K., and den Brok, B.: “Brittle”shear zones in experimentally deformed quartz single crystals, J. Struct. Geol., 28, 1292–1306, 2006b.
Viola, G., Mancktelow, N. S., and Miller, J. A.: Cyclic frictional– viscous slip oscillations along the base of an advancing nappe complex: insights into brittle-ductile nappe emplacement mech-anisms from the Naukluft Nappe Complex, central Namibia, Tec-tonics, 25, TC3016, doi:10.1029/2005tc001939, 2006.