Abstract— The Leiden ranking methodology (LRM), also sometimes called the crown indicator, is a quantitative method for evaluating the research quality of a research group or academic department based on the citations received by the group in comparison to averages for the field. There have been a number of applications but these have mainly been in the hard sciences where the data on citations, provided by the ISI Web of Science (WoS), is more reliable. In the social sciences, including business and management, many journals and books are not included within WoS and so the LRM has not been tested here. In this research study the LRM has been applied on a dataset of over 3,000 research publications from three UK business schools. The results show that the LRM does indeed discriminate between the schools, and has a degree of concordance with other forms of evaluation, but that there are significant limitations and problems within this discipline.
Index Terms—citations, crown indicator, Leiden methodology, research quality assessment
I. INTRODUCTION
In recent years, excellent scientific research, as the main driving force of our modern society, has been proved to be the source of breakthroughs in the diffusion of our knowledge of the world. The evaluation of such scientific research is considered to be of paramount importance. One of the main factors in the assessment of research performance is international scientific influence, representing a measurable aspect of scientific quality.
Current research evaluation methodologies are either qualitative or quantitative assessments of research performance. The former is primarily peer review methodologies - reviews conducted by colleague-scientists (peers) in order to evaluate research groups and programs, to make appointments of research staff, to judge research proposals and projects etc. The latter contains certain bibliometric methodologies for evaluating research performance within the framework of international scientific influence.
Both qualitative and quantitative methodologies have limitations in their application for academic research quality evaluation [1]-[4]. It should be noted that certain quantitative elements are present in the class of qualitative methods, while qualitative elements appear also in the quantitative methods. Furthermore, new classes of hybrid
Manuscript received September 18, 2013; revised December 15, 2013. J. C. Mingers is with Kent Business School, University of Kent, UK, +44 (0)1227 263236, [email protected]
A. E. Lipitakis is with Kent Business School, University of Kent, UK, [email protected].
methodologies incorporating both qualitative and quantitative advantageous elements are being developed. Although peer reviewing and other related expert-based judgments are considered the principal methodologies of research quality evaluation, bibliometric methods when applied in parallel to peer based evaluation methodologies can offer substantial improvements of decision making procedures. Bibliometric methodologies have proved to perform efficiently in the large majority of applied sciences, natural and medical sciences, and in certain fields of social and behavioral sciences (provided that the performance measurements cover wide ranges of years), [5] but have not been widely applied within the social sciences and humanities more generally [6].
At the individual researcher level the most important aspects of researchers’ performance are: (i) the productivity, represented by the number of different papers and (ii) the impact, represented by the number of citation per paper, [7],[8]. At the departmental or institutional level, citation rates for the individual researchers can be measured, but it is generally agreed that these need to be normalised for comparative purposes. First, because the different disciplines or fields vary immensely in their citation rates, and second because citations grow over time and so cannot be compared across different time periods. One of the most widely used approaches for departmental evaluation, that has been developed by the Centre for Science and Technology Studies (CWTS) at Leiden University, uses a standard set of bibliometric indicators including the crown indicator, called here the Leiden Ranking Methodology (LRM) [9]. In essence, the LRM compares the citations per paper (CPP) for each publication of a department with that which would be expected on a world-wide basis across the appropriate field and for the appropriate publication date. In this way, it normalises the citation rates for the department to rates for its whole field. Typically, top departments may have citation rates that are three or four times the field average.
The contribution of this paper is in applying the crown indicator for the first time to social science departments, in this case three business schools in the UK. The reliability and limitations of the results are assessed.
II. THE LEIDEN METHODOLOGY (THE CROWN INDICATOR) In using citations as a measure of a paper’s quality, or perhaps impact, many empirical studies have shown that the average number of citations varies significantly across disciplines [10]-[11], [3]. It is also clear that citations depend on the length of time that a paper has been published
A Bibliometric Comparison of the Research of
Three UK Business Schools
for. There may well be other factors that are significant, such as the type of paper – article, letter or review. This means that it is not possible to compare citations directly, in absolute terms, they must always be normalised with respect to these factors. .
There have been several ways of implementing this normalisation and one of the most well-known is that developed by CWTS which they call the crown indicator. The method works as follows. First the number of citation for a paper is found from the ISI Web of Science (WoS), assuming that the publication journal is actually included in WoS. Next, the method calculates how many citations such a paper would have expected to have received based on its field and its year of publication (type of document is not counted). The expected number is calculated from data in WoS. The citations for all the journals in the appropriate field for the particular year are accumulated and divided by the number of papers published to provide the overall field normalised cites per paper (FCSm). Note that the list of appropriate journals for the field is simply taken from the list provided by WoS. The exact basis for these WoS lists is not transparent – a point we shall return to below. CWTS also calculate a figure for the cites per paper for the particular set of journals that the department or institute concerned actually publishes in (JCSm). .
To calculate the crown indicator, the total of actual citations received by the department’s papers is divided by the total of the expected citations to give an overall ratio. If the ratio is exactly 1 then the department is receiving exactly as many citations as should be expected for its field or fields. If the number is above 1 it receives more citation than the average, and below 1 it receives less. The result typically ranges between [0.5 , 3.0].
This is the traditional crown indicator, and is the one primarily examined in this paper. However, recently this approach to normalisation has been criticised [13]-[15] and an alternative has been used in several cases [16]-[18]. This has generated considerable debate in the literature [19]-[24]. The alternative method calculates the expected number of citations for a field in the same way but then, instead of summing the actual citations and the expected citations and then dividing the two, it performs the division first for each paper. In other words, it calculates the ratio of actual to expected for each paper and then averages these ratios. It might be thought that this is purely a technical issue, but it has been argued that it can affect the results significantly. In particular, the older CWTS method tends to weight more highly publications from fields with high citation numbers whereas the new one weights them equally. Also, the older method is not consistent in its ranking of institutions when both improve equally in terms of publications and citations. Reference [23], [24] (from CTWS) have produced both theoretical and empirical comparisons of the two methods and concluded that the newer one is theoretically preferably but does not make much difference in practice. This is an ongoing debate and we have calculated both versions for our data. .
Although the crown indicator is the most informative single measure, the LRM actually utilizes a range of bibliometric indicators: .
(P): the total number of published papers in a particular time period.
(C): the total number of citations received by the P papers in a predetermined time period.
(CPP) the mean number of citation per publication . (%Pnc): the percentage of not-cited papers.
(JCSm): the journal citation score – the mean citations per paper for the journals that the department publishes in (its journal set) .
(CPP/JCSm): the average impact relative to the worldwide citation rate for the department’s journal set.
(FCSm): the field citation score – the mean cites per paper worldwide for all journals in the field (these journals being defined by the WoS field definitions.
(CPP/FCSm): the average impact relative to the worldwide citation rate for the field’s journal set.
(JCSm/FCSm): compares the mean impact of the department’s journal set with the mean impact of the field as a whole. Thus, if a department publishes in particularly good journals this ratio will be greater than 1. If it publishes in low impact journals the ratio will be less than 1.
(%Scit): the percentages of self-citations.
Note that it is the eighth bibliometric indicator (CPP/FCSm), the internationally standardized impact indicator, that is the crown indicator enabling us to classify directly the performance level of a considered research group, institution or academic foundation, i.e. the performance evaluation position in the international impact standard of the field.
There are two more general issues that we should mentioned before moving to the results. The first is the source of the citations. There is a range of bibliometric databases including discipline specific (ACM Digital Library) and generic (Elsevier’s Scopus), classified into the following three main types: (i) those that search the full text of documents for citations (e.g., Scirus, Emerald full text) or home pages and repositories on the web (e.g., Google Scholar); (ii) those that search the cited reference field of the documents (EBSCO products) and (iii) WoS type designed for capturing citations (e.g., Scopus) [25]. It has been reported that WoS has a clearly specified list of journals and records all the citations from such journals; has special tools for collecting accurate citations in particular concerning the unique identification of authors; and has also a satisfactory coverage in many natural sciences but has poor coverage in social sciences and humanities [26]-[28] .
works directly from the papers themselves. GS simply searches the Web for citations and so this can be much more hit and miss, and also includes citations from non-research documents such as teaching materials [30]. The research study concluded that the WoS should not be used for measuring research impact in management and business. But, CWTS always use WoS for their citation analyses, partly because it provides the field lists and also because they have special access to WoS results. Because of this, it was decided that in this study WoS would also be used, not least to see if the limitation caused a major problem.
The second general point is that, as [4], [31] have argued, bibliographic measures should not be used individually or by themselves, but rather should be used in conjunction with other approaches, especially peer review. Various national research assessment exercises are presently performed in several countries. A recent research study [32], compares qualitative methods (peer review) with quantitative methods (bibliometric approach). Special emphasis is given to the following six main components of any measurement system: (i) accuracy, (ii) robustness, (iii) validity, (iv) functionality, (v) time and (vi) costs. The authors conclude that for the natural and formal science (i.e. mathematics and computer sciences, physics, chemistry, biological sciences, medical sciences, earth sciences, Engineering etc.) bibliometric methodology proved to be far preferable to peer reviewing approach. They also claim that by setting up national publication databases by individual authors derived from WoS or Scopus would lead to better, economical and frequent national research assessments. Thus, although we are only testing the specific LRM, the recommendation is that it should always be used in combination with others, especially peer review.
III. DATA COLLECTION AND METHODOLOGY
The LRM bibliometric indicator methodology has been applied in a large scale data set consisted of over 3,000 research outputs produced by academic staff at three UK business schools, primarily from 2001 to 2008. Although the three business schools are of similar sizes, they have certain different academic characteristics. Specifically, School A is relatively new as a business school but has gained very high scores in the UK Research Assessment Exercise (RAE) and belongs to a world-leading university. The second business school, School B, is also relatively new, belonging to a traditional university, and has expanded considerably in recent years. Finally, School C has been established since the 1990s but has recently oriented itself more towards research rather than teaching. An classification of the number of research publications and
other informative publication type of members of staff has been presented in [29]. It is summarised in Table 1.
The main thing that Table 1 shows is that WoS includes only a proportion of all the research outputs produced – roughly 50% of the journal papers and only 20% of the total publications.
TABLE 1
RESEARCH OUTPUTS FOR THREE SCHOOLS Years
covered by outputs
Staff in the 2008 UK RAE
Authors involved in outputs
Total output s
Total journa l papers
Total outputs in Web of Science
School A
1981-2008
45 816 1933 705 403
School B
1984-2009
39 675 1455 629 309
School C
1980-2008
39 461 1212 548 292
The output of the academic members of staff of the three business schools for the time period 2001-2008 has been used. We looked up the corresponding citations of every research paper that was included in WoS and recorded how many citations each publication received from its year of publication until 2008 on an annual basis. This is a very time consuming process, not least because the publication details in the databases were often inaccurate. We then divided up the time period 2001-2008 into 5 four-year sub-periods as follows: 2001-2004, 2002-2005, …, 2005-2008. This enables us to see if the departments are changing over time. It has been reported that in natural and life sciences the average peak in the number of citations is the 3rd or 4th year cycle, while in the social sciences the time lag is much longer, i.e. around 5th or 6th year cycle [32], [4]. In our research study the above moving and partially overlapping 4-year analysis period has been chosen as an appropriate for the research quality assessment.
TABLE 2
WOS FIELDS AND OVERLAPPING COVERAGE
Business Business Fin. Economics Ind. Rel. Inf. Sci. Int. Rel. Management Ops. Res.
Business 103 - 13 - - 1 39 -
Business Finance - 76 35 - - 1 1 -
Economics 13 35 305 4 - 10 9 1
Ind. Rel. - - 4 22 - - 4 -
Inf. Sci. - - - - 77 - 8 -
Int. Rel. 1 1 10 - - 78 - -
Management 39 1 9 4 8 - 144 8
Ops. Res. - - 1 - - - 8 75
We can see from Table 2 that there is significant overlap between the business and management categories, and also overlap between business finance and economics, while international relations and information science are largely autonomous (note that the IS field is mainly information science journals rather than information systems ones, and that they may have different citation characteristics). We can see from Table 2 that there is significant overlap between the business and management categories, and also overlap between business finance and economics, while international relations and information systems are largely autonomous (note that the IS field is largely information science journals rather than information systems ones, and that they may have different citation characteristics).
There are several issues concerning the field definitions and this is important as the field normalisation is the main attraction of the LRM methodology. First, are these particular fields appropriate for the business and management (B&M) area as a whole? It is notable that the Association of Business Schools journal listing for B&M, for example, has 14 distinct fields. Obvious ones missing are more specific fields such as marketing, operations management and strategy. Second, are the journals correctly classified within them – there is no information within WoS as to the justification for the classification? And third, there is the problem of a journal being classified in more than one field - how should we estimate its expected number of citations if the fields differ markedly? We will also find that there are many papers in our dataset submitted to journals outside even this quite large range of fields.
To some extent, the seriousness these problems all depend on the extent of differentiation of citation rates between the fields. If, in fact, all the fields have similar citation rates then it does not matter very much and we could actually just normalise to the B&M field as a whole, but if the fields differ markedly these problems will be exacerbated. The other issue is the coverage of journals. As with much social science, WoS has a poor coverage in general, often less than 50% and it does not cover books at all. But there is evidence [29] that there is a differential coverage within fields with management science and economics being high while accounting and finance is low. This would mean that a department might be advantaged or disadvantaged depending on its subject mix. Information on the differences between fields will be presented in the results section.
IV. RESULTS
In the following text we present indicative numerical experimentation and relative results of the application of LRM in three UK business schools using the fields of management, business, and economics for predetermined time periods. The definitions of coverage of these fields in WoS are (WoS scope notes 2011):
Management covers resources on management science, organization studies, strategic planning and decision-making methods, leadership studies, and total quality management.
Business covers resources concerned with all aspects of business and the business world. These may include marketing and advertising, forecasting, planning, administration, organizational studies, compensation, strategy, retailing, consumer research, and management. Also covered are resources relating to business history and business ethics.
Business, Finance covers resources primarily concerned with financial and economic correlations, accounting, financial management, investment strategies, the international monetary system, insurance, taxation, and banking
As stated above, the first step, and a major task, is determining the expected number of citations for each field. Because the majority of papers were in journals contained in the fields management, business and economics thesee were the only ones for which statistics were calculated. This is, in itself, one of the problems with the LRM when applied to departments like business schools which encompass within themselves a wide range of disciplines. When the methodology was developed, primarily for the natural sciences, it was expected that a research department or institute would be fairly specialized. For example, in one of the main studies produced by Leiden, of a medical research institute, [4, p.5] says, “Often an institute is active in more than one field. … For instance, if the institute publishes in journals belonging to genetics and heredity as well as to cell biology, then …”. Here there are only three different but related fields.
However, business and management is markedly more diverse than that. In fact, the journals used by our three business schools actually occur in sixteen different fields within WoS, some in SSCI and some in SCI, and some journals are included in more than two fields. Also, the field categorisations in WoS are not very consistent in their level of resolution, for example, whereas there is only one field of “management” there are ten different fields of “psychology”.
TABLE 3
A COMPARISON OF RESEARCH OUTPUTS ACROSS SCHOOLS
School A School B School C
ISI WoS subject areas Number of
publications
Number of journals
Number of publications
Number of journals
Number of publications
Number of journals
Agriculture* - - - - 30 10
Business 76 34 34 18 32 19
Business Finance 14 5 11 4 2 2
Computer Science* 17 10 3 3 20 14
Economics 60 33 37 21 59 23
Engineering 14 10 17 7 20 10
Environmental Sciences 25 9 2 2 11 6
Environmental Studies - - 6 3 12 7
Ethics 10 2 - - 1 1
Food Science Technology - - 2 2 15 4
Geography 10 4 7 5 4 4
Health Care Sciences & Services 3 2 32 6 - -
Management 135 46 79 29 78 24
Mathematics Applied 12 7 6 2 30 13
Operations Research & Management Science 20 10 6 3 60 14
Pharmacology Pharmacy 1 1 10 2 - -
Planning Development 14 7 10 5 3 4
Political Science - - 15 5 2 2
Public Administration 4 4 11 5 9 4
Social Sciences* 21 7 14 10 10 6
Others ( <10 Publications/ Field) 30 54 38 90 24 44
Journal papers not in WoS 302 320 256
Table 3 shows the breakdown of journals between the various WoS fields. The top three fields that all schools have produced their most research output are business, economics and management (BEM). However, the proportion of research output in these three fields differs between the schools. We also note that there are certain relevant ‘not BEM’ fields in which one institute is active while another is not. That can be considered as an indicator of interdisciplinarity within the same broad scientific field and it points out the need for extending the research output of a department beyond a traditional defined field. The increasing production of research output in hybrid fields (research output that can be classified under more than one area within the same scientific field) can be seen as an (positive) indicator of improved/efficient scholarly communication within the scientific community, in the sense that high quality research in one scientific field influences the development and improvement in the advancement of another scientific field.
It is also possible to see from the original data (although not included as a table here) that school A has increased the proportion of its journals that are included in these three fields consistently over the years, suggesting a policy, explicit or implicit, of concentrating on the mainstream business and management journals at the expense of the more peripheral. This again may well be an effect of trying to improve in the UK Research Assessment Exercise. This Table also reveals starkly the extent to which a methodology based on WoS excludes large numbers of research outputs (counting only journal papers).
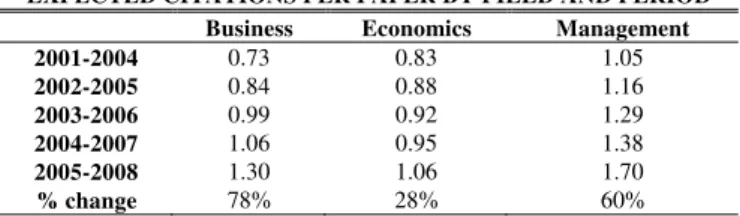
Moving now to the expected cites per paper per field, Table 4 shows the values by field and period.
To be clear on the data used, the citations for a set of
papers in a particular period were confined to that particular period – e.g., the citations for papers published in the period 2001-2004 were only those between 2001-2004. Thus each four year period is directly comparable. The first and most obvious comment is that the expected citations have risen significantly in all three fields over the years. Given that the periods only differ by a year and are overlapping these rises are quite large. This agrees with other data – e.g., that the journal impact factors produced by WoS (which are essentially citations per paper over a two year period) have also been rising. This presumably reflects both greater research productivity and also perhaps a greater use of citations because of the greater publicity given to bibliometric methods.
TABLE 4
EXPECTED CITATIONS PER PAPER BY FIELD AND PERIOD Business Economics Management
2001-2004 0.73 0.83 1.05
2002-2005 0.84 0.88 1.16
2003-2006 0.99 0.92 1.29
2004-2007 1.06 0.95 1.38
2005-2008 1.30 1.06 1.70
% change 78% 28% 60%
TABLE 5
LEIDEN INDICATOR FOR THREE UK SCHOOLS FOR SEVERAL TIME PERIODS P C CPP Total papers
of journals
Total cites of journals
JCSm CPP/ JCSm
CPP/ FCSm
MNCS JCSm/ FCSm
2001-2004
A 108 193 1.79 17,324 15,682 0.91 1.97 1.95 2.03 0.99 B 60 94 1.57 11,359 9532 0.84 1.87 1.69 1.70 0.91 C 56 55 0.98 11,155 8,975 0.80 1.22 1.07 1.03 0.87
2002-2005
A 124 242 1.95 17,528 18,907 1.08 1.81 1.91 1.90 1.05 B 50 53 1.06 10,454 10,154 0.97 1.09 1.03 1.07 0.95 C 70 51 0.73 13,008 10,954 0.84 0.87 0.72 0.73 0.83
2003-2006
A 121 235 1.94 20,712 24,585 1.19 1.64 1.74 1.67 1.06 B 61 80 1.31 11,809 12,224 1.04 1.27 1.15 1.20 0.91 C 75 101 1.35 13,970 13,661 0.98 1.38 1.22 1.24 0.88
2004-2007
A 143 299 2.09 24,110 32,521 1.35 1.55 1.77 1.73 1.14 B 65 102 1.57 12,661 14,724 1.16 1.35 1.31 1.34 0.97 C 94 150 1.60 16,389 16,785 1.02 1.56 1.34 1.40 0.96
2005-2008
A 118 346 2.93 23,642 41,520 1.76 1.67 2.05 2.01 1.23 B 60 162 2.70 10,111 12,954 1.28 2.11 1.87 1.97 0.89 C 79 190 2.41 16,114 20,943 1.30 1.85 1.70 1.71 0.92
Moving now to the actual calculations of the crown indicator, Table 5 shows the values by business school and period. If we consider the first row it is for Department A, 2001-2004. There were 108 publications in journals that were included in the three WoS fields. These gathered 193 citations within the period giving a basic CPP of 1.79 cites per paper. The next columns show the particular set of journals used by the department. They published 17,324 papers, gaining 15,682 citations for a CPP for the journal set (JCSm) of 0.91. Thus normalizing their CPP to their particular set of journals gives a value of 1.97 – the department gained citations at around double the rate for its journal set. The crown indicator itself (CPP/FCSm) is calculated from the expected field citations as in Table 2. The actual citations for the papers are totaled up and then divided by the total of the expected citations for the relevant fields. A special weighting is used when a journal appears in more than one field. The result in this case is 1.95 – very close to the value for the journal set, showing that this department publishes in journals that are broadly representative of the field.
The next column, MNCS, shows the crown indicator calculated in the alternative way as discussed above – i.e., dividing the ratios and then averaging rather than summing and then dividing. Its value of 2.03 is very close. The final column, the ratio of the journal citation score to the field citation score just confirms that the journal set is neither particularly good nor poor.
From the data presented in the Table 5 we can see that there is a noticeable difference between the average citation rates of the 3 institutes. School A appears to have the higher CPP in all time periods. It is also rising slightly but with a particularly significant rise in 2005-2008. Schools B and C are below A but alternate in terms of which is better. Again, they both rise particularly in 2005-2008. It may be relevant that the UK RAE exercise was in 2008 which probably led to an increase in publications in the run-up to it. The main
question to be answered is whether the significant extra effort in normalization actually gives a better picture of the differences between the schools or the standing of the schools more generally.
We can begin by looking at JCSm/FCSm which reflects the quality of the school’s journal set relative to the field as a whole. All three schools were just under 1 in the first period, but school A rose significantly to 1.23 by 2005-2008. This suggests that there was a significant improvement in the quality of journals used during the period by A. The others remained the same. Looking at CPP/JCSm, all schools are significantly above 1, although there is a degree of volatility from year to year. There is no overall trend. Finally, the crown indicator shows that all the schools, in almost every period, were above 1 showing they are performing better than the field average. School A actually fell for the first four periods before rising. This may reflect the fact that they were improving the quality of their journal set and thus competing against a stronger field. School C has also generally risen with the exception of one year.
The differences between the two versions of the crown indicator are very marginal, the only consistency being that school A was generally lower in the new version that the old one. This does fit in with the arguments about the two if it is the case that school A tended to publish in better, higher cited journals.
years before rising again. This is because the field citation rates were rising generally so the apparent continual improvement is actually a field effect. Finally, we could say that the field normalization would allow us to compare these schools against other business schools with perhaps significantly mixes of fields, or against other departments in completely different fields. This would obviously be of importance when evaluating the quality of universities as a whole rather than departments in a particular field.
How do the results compare with the actual results from the UK RAE which was carried out in 2008? In the RAE, every department was assessed on a 4-point scale (where 4 indicated “world-leading” quality and 1 merely “national” quality). The proportions of the department’s work in each quality level was evaluated (e.g., 20% 4, 30% 3, 40% 2 and 10% 1) and this was then used to calculate an average quality level or GPA which was then reported to the nearest 0.05. The actual results were: School A: 3.05, School B: 2.45, and School C 2.50 (where the highest was 3.35 and the lowest 1.25).
The two sets of results clearly show a degree of concordance with School A being significantly better than Schools B and C, which were themselves roughly equivalent. So one could argue, admittedly on the basis of a small sample, that bibliometrics produced similar results to the peer review exercise.
V.CONCLUSIONS
In this paper we have demonstrated how the Leiden Ranking Methodology can be implemented for a sample of three UK business schools. Practically speaking, it required a significant amount of effort just for these three schools and utilising only three field categories in WoS. Clearly if it were to be done on a wide basis it would require some form of automation through WoS, which is how Leiden do it.
The main purpose of the method is to normalise the raw citation scores for the field and the year of publication – other factors such as type of publication or country could be included if desired. The purpose of this is to generate standardised scores so as to properly compare across different departments, disciplines and universities. The results we have obtained do indeed reveal more than the basic citation scores. For instance, school A had continuously rising citation rates but when normalised they actually fell over some years because the citations in the field as a whole were rising. It was also possible to compare the quality of the journal sets used by the different schools. . Against this, we must recognise severe problems with the methodology at least using WoS in the social sciences. We saw from Table 1 that WoS only includes around 20% of a department’s total research outputs, that is about 50% of its journal papers. We then saw that there are significant problems with the field categories in WoS: they are poorly defined; there are many that could apply to business and management; and journals appear in more than one often with different normalised citation rates. In our example, where we concentrated on the three major fields, this reduced the proportion of outputs analysed still further..
Given this, our conclusion is that at the moment the LRM is not suitable for evaluating the performance of
departments in business and management although it is a good idea in principle. One possibility is for it to be based on Google Scholar instead. This gives a much wider coverage of all disciplines and includes books and reports although the reliability and validity of its results is questionable [29]. The main practical problem is that it does not include any field categorisations as does WoS. It might be a valuable activity for scholarly associations to perhaps agree lists of journals that are relevant to their disciplines without, of course, assessing their quality.
REFERENCES
[1] Horrobin, D. (1990). The philosophical basis of peer review and the suppression of innovation. Journal of the American Medical
Association, 263, 1438-1441.
[2] Moxham, H., & Anderson, J. (1992). Peer review: A view from the inside. Science and Technology Policy, 5, 7-15.
[3] Rinia, E. J., van Leeuwen, T. N., van Vuren, H. G., & van Raan, A. F. J. (1998). Comparative analysis of a set of bibliometric indicators and central peer review criteria: Evaluation of condensed matter physics in the Netherlands. Research Policy, 27, 95-107.
[4] van Raan, A. (2003). The use of bibliometric analysis in research performance assessment and monitoring of interdisciplinary scientific developments. Technology Assessment - Theory and Practice, 1, 20-29.
[5] Nederhof, A., Van Leeuwen, T., & Tijssen, R. (2004). International benchmarking and bibliometric monitoring of UK research performance in the social sciences. In. Leiden: Centre for Science and Technology Studies (CWTS), University of Leiden.
[6] Nederhof, A. (2006). Bibliometric monitoring of research performance in the social sciences and humanities. Scientometrics, 66, 81-100.
[7] Aksnes, D., & Sivertsen, G. (2009). A macro-study of scientific productivity and publication patterns across all scholarly disciplines. In Larsen & Leta (Eds.), 12th International Conference on
Scientometrics and Informetrics (pp. 394-398).
[8] Todeschini, R. (2011). The j-index: a new bibliometric index and mulitvariate comparisons between other bibliometric indices.
Scientometrics, 87, 621-639.
[9] van Raan, A. (2005b). Measuring science: Capita selectaof current main issues. In H. Moed, W. Glenzel & U. Schmoch (Eds.),
Handbook of Quantitative Science and Technology Research (Vol.
19-50). New York: Springer.
[10] Leydesdorff, L. (2008). Caveats for the use of citation indicators in research and journal evaluation. Journal of the American Society for
Information Science and Technology, 59, 278-287.
[11] Mingers, J., & Burrell, Q. (2006). Modelling citation behavior in Management Science journals. Information Processing and
Management, 42, 1451-1464.
[12] Moed, H. F., Burger, W., Frankfort, J., & Van Raan, A. (1985). The use of bibliometric data for the measurement of university performance. Research Policy, 14, 131-149.
[13] Leydesdorff, L., & Opthoft, T. (2011). Remaining problems with the “New Crown Indicator” (MNCS) of the CWTS. Journal of Informetrics, forthcoming.
[14] Lundberg, J. (2007). Lifting the crown—citation z-score. Journal of Informetrics, 1, 145–154.
[15] Opthof, T., & Leydesdorff, L. (2010). Caveats for the journal and field normalizations in the CWTS ("Leiden") evaluations of research performance. Journal of Informetrics, 4, 423-430.
[16] Cambell, D., Archambaulte, E., & Cote, G. (2008). Benchmarking of Canadian Genomics: 1996-2007. In.
[17] Rehn, C., & Kronman, U. (2008). Bibliometric handbook for Karolinska Institutet,. In.
[18] Van Veller, M., Gerritsma, W., Van der Togt, P., Leon, C., & Van Zeist, C. (2009). Bibliometric analyses on repository contents for the evaluation of research at Wageningen UR. In A. Katsirikou & C. Skiadas (Eds.), Qualitative and Quantitative Methods in Libraries:
Theory and Applications (pp. 19-26,): World Scientific.
[19] Bornmann, L. (2010). Towards an ideal method of measuring research performance: Some comments to the Opthof and Leydesdorff (2010) paper. Journal of Informetrics, 4, 441-443.
(ratio) averages in field-normalization. Journal of Informetrics, 5, 228-230.
[21] Moed, H. (2010). CWTS crown indicator measures citation impact of a research group's publication oeuvre. Journal of Informetrics, 4, 436-438.
[22] van Raan, A., van Leeuwen, T., Visser, M., van Eck, N., & Waltman, L. (2011). Rivals for the crown: Reply to Opthof and Leydesdorff.
Journal of Informetrics, 4, 431-435.
[23] Waltman, L., van Eck, N., van Leeuwen, T., Visser, M., & van Raan, A. (2010). Towards a new crown indicator: Some theoretical considerations. Journal of Informetrics, 5, 37-47.
[24] Waltman, L., van Eck, N., van Leeuwen, T., Visser, M., & van Raan, A. (2011). Towards a new crown indicator: an empirical analysis.
Scientometrics, 1-15.
[25] Meho, L., & Yang, K. (2007). Impact of data sources on citation counts and rankings of LIS faculty: Web of Science, Scopus and Google Scholar. Journal American Society for Information Science
and Technology, 58, 2105-2125.
[26] HEFCE. (2008). Counting what is measured or measuring what counts. In: HEFCE.
[27] Mahdi, S., D'Este, P., & Neely, A. (2008). Citation counts: Are they good predictors of RAE scores? In. London: AIM Research.
[28] Moed, H., & Visser, M. (2008). Appraisal of Citation Data Sources. In. Leiden: Centre for Science and Technology Studies, Leiden University.
[29] Mingers, J., & Lipitakis, L. (2010). Counting the citations: A comparison of Web of Science and Google Scholar in the field of management. Scientometrics, 85, 613-625.
[30] Walters, W. (2007). Google Scholar coverage of a multidisciplinary field. Information Processing and Management, 43, 1121-1132. [31] van Raan, A. (2005). Fatal attraction: Conceptual and methodological
problems in the ranking of universities by bibliometric methods.
Scientometrics, 62, 133-143.
[32] Abramo, G., & D’Angelo, C. (2011). Evaluating research: from informed peer review to bibliometric. Scientometrics, 87, 499-514. [33] Mingers, J. (2008). Exploring the dynamics of journal citations: