Intracellular labeling and quantification process by
magnetic resonance imaging using iron oxide magnetic
nanoparticles in rat C6 glioma cell line
Marcação intracelular e processo de quantificação por imagem por ressonância magnética
utilizando nanopartículas magnéticas de óxido de ferro em
células da linhagem C6 de glioma de rato
Javier Bustamante Mamani1, Lorena Favaro Pavon1, Liza Aya Mabuchi Miyaki2,Tatiana Tais Sibov1, Fabiana Rossan1,
Paulo Henrique Silveira1, Walter Humberto Zavala Cárdenas1, Edson Amaro Junior3, Lionel Fernel Gamarra1
Study carried out at the Instituto Israelita de Ensino e Pesquisa Albert Einstein, Hospital Israelita Albert Einstein – HIAE, São Paulo (SP), Brazil.
1 Instituto do Cérebro – InCe, Hospital Israelita Albert Einstein – HIAE, São Paulo (SP), Brazil.
2 Instituto do Cérebro – InCe, Hospital Israelita Albert Einstein – HIAE, São Paulo (SP), Brazil; Faculdade de Enfermagem do Hospital Israelita Albert Einstein – HIAE, São Paulo (SP), Brazil. 3 Department of Diagnostic Imaging and Instituto do Cérebro – InCe, Hospital Israelita Albert Einstein – HIAE, São Paulo (SP), Brazil.
Corresponding author: Javier Bustamante Mamani – Instituto do Cérebro – Hospital Israelita Albert Einstein – Avenida Albert Einstein, 627/701 – Morumbi – Zip code: 05651-901 – São Paulo (SP), Brazil – Phone: (55 11) 2151-2044 – E-mail: [email protected]
Received on: Mar 30, 2012 – Accepted on: May 25, 2012 Conflicts of interest: none.
ABSTRACT
Objective: To assess intracellular labeling and quantification by magnetic resonance imaging using iron oxide magnetic nanoparticles coated with biocompatible materials in rat C6 glioma cells in vitro. These methods will provide direction for future trials of tumor induction in vivo as well as possible magnetic hyperthermia applications. Methods: Aminosilane, dextran, polyvinyl alcohol, and starch-coated magnetic nanoparticles were used in the qualitative assessment of C6 cell labeling via light microscopy. The influence of the transfection agent poly-L-lysine on cellular uptake was examined. The quantification process was performed by relaxometry analysis in T1 and T2weighted phantom images. Results: Light microscopy revealed that the aminosilane-coated magnetic nanoparticles alone or complexed with poly-L-lysine showed higher cellular uptake than did the uncoated magnetic particles. The relaxivities of the aminosilane-coated magnetic nanoparticles with a hydrodynamic diameter of 50nm to a 3-T field were r1=(6.1±0.3)×10-5 ms-1mL/µg,
r2=(5.3±0.1)× 10-4 ms-1mL/µg, with a ratio of r
2 / r1≅ 9. The iron uptake in the cells was calculated by analyzing the relaxation rates (R1 and R2) using a mathematical relationship. Conclusions: C6 glioma cells have a high uptake efficiency for aminosilane-coated magnetic nanoparticles complexed with the transfection agent poly-L-lysine. The large ratio r2 / r1≅ 9 indicates that these magnetic nanoparticles are ideal for quantification by magnetic resonance imaging with T2 -weighted imaging techniques.
Keywords: Glioma; Cell line, tumor; Nanoparticles; Magnetic resonance imaging
RESUMO
Objetivo: Avaliar a marcação intracelular e o processo de quantificação por imagem por ressonância magnética usando nanopartículas magnéticas à base de óxido de ferro recobertas com materiais biocompatíveis em células da linhagem de glioma de rato C6 em experimentos in vitro. Esses métodos visam orientar ensaios futuros de indução de tumor in vivo, bem como possíveis aplicações da técnica de magneto-hipertermia. Métodos: Na avaliação qualitativa da marcação de células C6, realizada mediante microscopia óptica comum, foram utilizadas nanopartículas magnéticas recobertas com aminosilana, dextrana, álcool polivinílico e amido. A influência do agente de transfecção poly-L-lisine na captação celular foi analisada. O processo de quantificação foi realizado mediante a análise de relaxometria em imagens ponderadas em T1 e T2 do phantom. Resultados: A avaliação por microscopia óptica comum mostrou que nanopartículas magnéticas recobertas com aminosilana complexadas e não complexadas com poly-L-lisine apresentam melhor captação pelas células. As relaxatividades de nanopartículas magnéticas recobertas com aminosilana com diâmetro hidrodinâmico de 50nm para um campo de 3T foram: r1=(6,1±0,3)×10-5ms-1mL/µg,
r2=(5,3±0,1)×10-4ms-1mL/µg; com uma razão de r
ferro captado pelas células foi calculado pela análise das taxas de relaxação (R1 e R2) mediante relação matemática. Conclusões: Linhagem de células C6 marcadas com nanopartículas magnéticas revestidas com aminosilana e complexadas com o agente de transfecção poly-L-lisine tem uma alta eficiência de captação das nanopartículas magnéticas. A grande razão r2 / r1 ≅ 9 determina
que essas nanopartículas magnéticas sejam ideais para estudar o processo de quantificação por imagem por ressonância magnética com técnicas de imagem ponderadas em T2.
Descritores: Glioma; Linhagem celular tumoral; Nanopartículas; Imagem por ressonância magnética
INTRODUCTION
Several approaches for the use of contrast agents in magnetic resonance imaging (MRI) to label cells have been developed for experimental and clinical
applications. The development of methods for in
vivo cell detection and the differentiation of cells labeled with a contrast agent that is composed of magnetic nanoparticles (MNPs) that are based on iron oxide have made MRI an essential technique in the monitoring of cells labeled with implanted MNPs. The MRI technique is advantageous because it is non-invasive and does not cause ionizing radiation damage, making it ideal for studies of cell labeling by analyzing the characteristic relaxation times, i.e., the
longitudinal relaxation time (T1) and the transverse
relaxation time (T2).
Iron oxide nanoparticles coated with biocompatible materials are developed to examine the reticuloendothelial
system (RES)(1), perform MRI lymphography(2) and
MRI of gene expression(3), and monitor in vivo cell
migration(4-6), among other applications. These applications
intrinsically depend on an efficient MNP uptake by the cell types of interest. The internalization or uptake of MNPs occurs by pinocytosis, a mechanism by which
nanoparticles are brought into the cells(7).
There are several MNPs used for cell labeling that are coated with different biocompatible materials, such as aminosilane, dextran, polyvinyl alcohol (PVA), and starch, among others. Uptake efficiency is low in certain types of cells; therefore, a high MNP concentration must be used for labeling, with long incubation times. However, there are some alternatives, such as the use of transfection agents, for increasing the MNP uptake efficiency.
Cell labeling with MNPs for in vivo experiments
can be performed in the following three ways: (i) intravenous MNP administration and their subsequent uptake by the target cells, (ii) direct
MNP administration in the target tissues, and (iii)
administration of cells labeled in vitro for subsequent
implantation in the target sites.
One technique that involves the administration of
MNP-labeled cells is magnetic hyperthermia(8) for in vivo
studies in animal models (induction of tumor tissue). Tumor induction after the administration of previously labeled cells enables MRI monitoring of tumor
development in vivo. Induced tumor tissue labeled with
MNPs can be lysed through magnetic hyperthermia, which is based on the increased temperature of the tumor tissue when the labeled cells are subjected to an AC magnetic field.
After cells are labeled by the methods described above, the iron load per unit of tissue volume or per cell must be quantified, in addition to monitoring the labeled cell. One technique that allows such monitoring
and quantification is MRI(9,10).
The understanding and control of cell labeling using MNPs are essential for these applications. MNP intracellular labeling has been shown to be
an adequate system for in vivo identification and
monitoring by MRI. This labeling can be performed
in vivo or in vitro (i.e., stem cells cultivated and labeled
before in vivo implantation) by cell internalization
pathways(11).
This work aimed to optimize the labeling of rat C6
glioma cells with magnetite (Fe3O4) and Fe3O4 MNPs
coated with aminosilane, dextran, PVA, or starch.
These four types of particles are also complexed with
poly-L-lysine (PLL). After the optimal type of MNP (i.e., highest cellular MNP uptake) was determined, quantification was performed by MRI via the study of relaxometry in a 3-T MRI scanner.
OBJECTIVE
To study intracellular labeling and MRI quantification using iron oxide MNPs coated with biocompatible materials in rat C6 glioma cells to further research
on the tumor induction process in vivo, as well as the
application of the magnetic hyperthermia technique.
METHODS
Iron oxide MNPs
of 50nm. The crystalline phase of the superparamagnetic
core corresponds to Fe3O4. The colloidal suspension
concentration corresponds to 50mgFe/mL that is dispersible in double distilled water.
Cell culture
The C6 cell line was acquired from the Rio de
Janeiro Cell Bank (Banco de Células do Rio de Janeiro
– BCRJ), which is managed by the Paul Ehrlich
Technical and Scientific Association (Associação
Técnico-Científica Paul Ehrlich – APABCAM). The
cells were plated at a density of 107 cells per 75cm2
in culture flasks (Corning, USA) using Dulbecco’s
modified Eagle’s medium (GIBCO® Invitrogen
Corporation, CA, USA) supplemented with 10%
fetal bovine serum (FBS) (GIBCO® Invitrogen
Corporation, CA, USA), 1% penicillin-streptomycin
(GIBCO® Invitrogen Corporation, CA, USA), and 1%
L-glutamine (GIBCO® Invitrogen Corporation, CA,
USA). The cells were cultured at 37°C with 5% CO2.
After reaching 70% cell confluence, adherent C6 cells
were collected with the use of 0.25% trypsin (GIBCO®
Invitrogen Corporation, CA, USA) at 37°C for five minutes.
Cell labeling
C6 cells at 70-80% confluence were incubated overnight
(approximately 12 hours at 37oC, 5% CO
2) in 20mL
of culture medium plus MNPs at concentrations of 0, 5, 10, 50 and 100μg Fe/mL. After incubation, the supernatant was removed, and the C6 cells were washed twice with FBS to remove extracellular MNPs. The C6 cells labeled with MNPs were collected with trypsin to remove adherent cells and were manually counted in a Neubauer chamber.
Intracellular distribution of MNPs in C6 cells
MNP internalization by C6 cells was assessed qualitatively by the distribution and intracellular location of MNPs using Prussian blue staining (Prussian Blue Kit, BioPAL Inc., Worcester, MA) and analysis using a compound light microscope (CLM). This cytochemical test with labeled C6 cells was performed for a period of two minutes.
These properties were evaluated for concentrations of 10 and 500μg Fe/mL in the presence and absence of the transfection agent PLL (Sigma-Aldrich Chemie GmbH, Germany) at a concentration of 1.5μg/mL.
In vitro
assessment using MRI
Phantomdesign
A phantom consisting of a set of 250-μL Eppendorf
tubes filled with pellets of an equal number of cells
(5× 10⁶) that were incubated with concentrations
of 0, 5, 10, 50 and 100μg Fe/mL was prepared. In Eppendorf tubes, the pellets were mixed with 150μL 1% agarose (Sigma-Aldrich Chemie GmbH, Germany). After the agarose cooled and solidified, MRI analysis was performed. To compare the iron uptake of the C6 cells, an Eppendorf tube containing the contrast agent at a concentration of 50μgFe/mL was added to each phantom.
Imaging sequence
The relaxometry characteristics of the phantom were evaluated with a whole-body 3-T MRI scanner with a wrist coil (Magnetom Vision, Siemens, Germany), using
T1- and T2-weighted imaging sequences. The parameters
used in the imaging sequences were published by
Gamarra et al.(12). The MNP relaxation times were
measured for different samples. For the measurements
of T2 relaxation times, the multicontrast turbo-spin-echo
(se_mc) sequence was used. The T2 relaxation time of
each nanoparticle sample was obtained by adjusting the decay curve with a monoexponential linear algorithm,
Intensity=C1 exp(–TE/T2). For the T1 measurements,
the multiple spin-echo (SE) sequence was used. The
equation of signal intensity for T1 measurements is
Intensity=C2 (1–exp(TR/T1)), where TE is the echo
time, TR is the repetition time, and C1 and C2 are
constants. The MR signal intensities from different areas were determined by measurements of the regions of interest.
MRI quantification of MNPs internalized in C6 cells
The quantification of MNPs in labeled C6 cells was performed by relaxometry. The relaxation rates(R1=1/T1 and R2=1/T2) were determined in ms-1 for
subsequent correlation with the MNP concentration in the cells and their relaxivities r1 and r2 (in ms-1mL/μg).
The relaxation rate can thus be expressed by(13)
Figure 1. Cytochemical assay by the Prussian blue method highlights C6 cells labeled with varying concentrations of magnetic nanoparticles coated with aminosilane, dextran, polyvinyl alcohol, or starch using the transfection agent PLL
Table 1. Parameters obtained from the analysis of the relaxation curves at different iron concentrations. The number of labeled cells is the same at each concentration (5×10⁶ cells) after the incubation period
[Fe] (µg/mL)
r1=(6.1±0.3)×10-5 ms-1mL/µg r
2=(5.3±0.1)×10
-4 ms-1mL/µg
T1 (ms)
R1 (10-6ms-1)
[Fe] uptake (µg/mL)
T2 (ms)
R2 (10-5ms-1)
[Fe] uptake (µg/mL)
0 2,554±21 392±3 - 544±22 184±7
-5 2,455±17 407±3 0.47±0.04 232±5 431±9 3.2±0.3 10 2,364±19 423±3 0.93±0.10 212±4 472±9 3.7±0.4 50 2,360±23 424±4 0.95±0.12 182±3 550±9 4.7±0.5 100 1,978±3 506±1 3.37±0.28 99±3 1,010±31 10.6±1.2
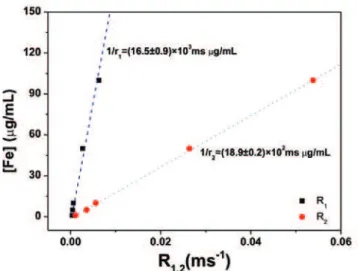
Figure 2. Concentration of Fe versus the relaxation rates R1 and R2. The values of 1/r1 and 1/r2 resulting from the fit to the experimental data are shown for each
adjusted curve
RESULTS
Qualitative analysis of cell labeling
MNPs coated with aminosilane, dextran, PVA, or starch were used to label C6 cells. The concentrations used for incubation were 10 and 500μg Fe/mL. The cells were incubated in the presence or absence of the transfection agent PLL. The qualitative analysis of the Prussian blue staining is presented in figure 1.
Figure 3. Intensity curves versus the TR representative of the longitudinal relaxation obtained from the analysis of the phantommagnetic resonance images. The T1 times of each curve were calculated from the fit to the experimental data (values in table 1). The insetshows the T1-weighted phantom magnetic resonance image obtained by the multiple SE sequence at TR=500ms and TE=8.5ms. The intensity curve of the contrast agent at a concentration of 50µg Fe/mL is higher than the intensity of the labeled cells at the same TR
Relaxivity determination using MRI
The relaxivities r1 and r2 in ms-1mL/μg (Table 1) were
calculated by analyzing the results of the linear least-squares adjustment of the slope of the graph of the contrast agent dispersed in water (5 to 100μgFe/mL)
versus the relaxation rates R1=1/T1 and R2=1/T2.In this
In vitro
quantification using MRI
The T1 and T2 proton relaxation times of cells labeled
with different MNP concentrations were obtained by MRI analysis. The intensity curves associated with
the contrast of the characteristic T1 and T2 images are
shown in figures 3 and 4, respectively. The T1 and T2
the characteristic functions and the relaxation rates R1
and R2 are shown in table 1.
Table 1 contains a summary of the phantom MRI analysis parameters used in this study, including the relaxation times (T1 and T2), relaxation rates (R1 and R2),
the relaxivities (r1 and r2), and the iron concentrations
taken up by the cells ([Fe]uptake).
DISCUSSION
The images obtained through CLM (Figure 1) show that MNPs coated with dextran, PVA, or starch were not internalized by the cells when incubated at high (500μg Fe/mL) or low (10μg Fe/mL) concentrations. However, when these MNPs were complexed with PLL, the cells internalized MNPs, albeit with a low uptake efficiency. In the case of aminosilane-coated MNPs, the cells internalized MNPs even without the use of PLL. An increased uptake was observed in comparison with other MNPs. PLL complexing decreased the internalization of aminosilane-coated MNP, although it increased the efficiency of C6 cell labeling.
MRI quantification of iron loading by C6 cells was only performed with MNP coated with aminosilane and complexed with PLL due to the high labeling efficiency of this MNP preparation compared with the other MNPs analyzed.
The MRI relaxometry analysis yielded the following
values for r1 and r2, calculated from the slopes of the
Figure 4. Intensity curves versus the TE representative of the transverse relaxation obtained from the analysis of the phantommagnetic resonance images. The T2 times of each curve were calculated by the fit to the experimental data (values in table 1). The insetshows the T2-weighted phantom magnetic resonance image obtained by the se_mc sequence at TR=3,000ms and TE=26.2ms. The intensity curve of the contrast agent at a concentration of 50µg Fe/mL is lower than the intensity of the labeled cells at the same TE
curves in figure 2: r1=(6.1±0.3) × 10-5ms-1mL/μg,
r2=(5.3±0.1) × 10-4ms-1mL/μg. The r
1 relaxivity was
smaller than r2, indicating that the distance between
the water molecules and cores of the coated MNPs was small. A slightly higher relaxivity could be the result of aggregated MNPs, which generate a slightly larger local magnetic field fluctuation than do dispersed MNPs.
The r2 relaxivity was high, indicating that T2 was
much more influenced by the nanoparticle coating than
was T1; this finding was expected, considering that T2 is
more sensitive to magnetic inhomogeneity than is T1. To
achieve the maximum effect of the contrast agent in T2,
the MNPs should be coated with layers that are as thin as possible because the interaction between magnetic particles and water molecules depends on the distance between them.
In MRI, the relaxation times can be manipulated
with a contrast agent, for example, T1 with gadolinium
or manganese and T2 with iron oxide particles. The
efficiency of the MRI contrast agent is commonly
evaluated in terms of its r1 and r2 relaxivity. For a T2
contrast agent, a higher r1/r2 ratio indicates a better
contrast efficiency(14). Thus, with its ratio of r
2 / r1 ≅ 9,
aminosilane-coated MNP is a high-efficiency T2 contrast
agent in 3-T fields.
The insets in figures 3 and 4 show T1- and T2
-weighted images, respectively. The T1-weighted image
obtained for different concentrations shows a signal intensity increase with increasing MNP concentrations
taken up by C6 cells due to the shortening of T1, as
shown in the curves of figure 3. In the case of T2, the
opposite trend occurs, as shown in figure 4, because the increase in MNP uptake by the C6 cells was equal to the decrease in signal intensity.
The MRI assessment of the MNP uptake by C6
cells was more evident in the analysis of T2-weighted
images due to the coating of MNPs with aminosilane,
which acted as a high-efficiency contrast agent in T2.
Therefore, for this contrast agent, the determination of iron uptake by cells should be performed by
analyzing T2-weighted images(15). Conversely, the values
for iron uptake by cells analyzed in the T1-weighted
images were unreliable due to the small values of R1
compared to R2. The iron uptake values are shown
in table 1. The iron concentrations taken up by C6
cells ([Fe]uptake) were calculated after the parameters
CONCLUSION
RatC6 glioma cells efficiently internalized
aminosilane-coated MNPs complexed with the transfection agent PLL. The MNPs coated with dextran, PVA, or starch, even when complexed with PLL, showed little uptake by C6 cells. The relaxivity values of the aminosilane-coated MNPs determined in a 3-T magnetic field were
r1=(6.1±0.3)×10-5 ms-1mL/μg and r
2=(5.3±0.1)×
10-4 ms-1mL/μg. The large ratio r
2 / r1≅ 9 indicates that
these MNPs are ideal for quantitative T2-weighted
MRI studies.
A standardized assay for rat C6 glioma cell line
labeling and in vitro quantification by MRI were shown
to be efficient tools for future studies toward the implementation of magnetic hyperthermia techniques.
ACKNOWLEDGEMENTS
This study was supported by the Instituto Israelita de
Ensino e Pesquisa Albert Einstein – IIEPAE, Conselho Nacional de Desenvolvimento Científico e Tecnológico
– CNPq, Financiadora de Estudos e Projetos – FINEP,
Coordenação de Aperfeiçoamento de Pessoal de Nível Superior – CAPES, and the Fundação de Amparo à Pesquisa do Estado de São Paulo – FAPESP.
REFERENCES
1. Oswald P, Clement O, Chambon C, Schouman-Claeys E, Frija G. Liver positive enhancement after injection of superparamagnetic nanoparticles: respective role of circulating and uptaken particles. Magn Reson Imaging. 1997; 15(9):1025-31.
2. Réty F, Clément O, Siauve N, Cuénod CA, Carnot F, Sich M, et al. MR lymphography using iron oxide nanoparticles in rats: pharmacokinetics in the
lymphatic system after intravenous injection. J Magn Reson Imaging. 2000; 12(5):734-9.
3. Weissleder R, Moore A, Mahmood U, Bhorade R, Benveniste H, Chiocca EA, et al. In vivo magnetic resonance imaging of transgene expression. Nat Med. 2000;6(3):351-5.
4. Lewin M, Carlesso N, Tung CH, Tang XW, Cory D, Scadden DT, et al. Tat peptide-derivatized magnetic nanoparticles allow in vivo tracking and recovery of progenitor cells. Nat Biotechnol. 2000;18(4):410-4.
5. Bulte JW, Zhang S, van Gelderen P, Herynek V, Jordan EK, Duncan ID, et al. Neurotransplantation of magnetically labeled oligodendrocyte progenitors: magnetic resonance tracking of cell migration and myelination. Proc Natl Acad Sci USA. 1999;96(26):15256-61.
6. Bulte JW, Douglas T, Witwer B, Zhang SC, Strable E, Lewis BK, et al. Magnetodendrimers allow endosomal magnetic labeling and in vivo tracking of stem cells. Nat Biotechnol. 2001;19(12):1141-7.
7. Conner SD, Schmid SL. Regulated portals of entry into the cell. Nature. 2003; 422(6927):37-44.
8. Silva AC, Oliveira TR, Mamani JB, Malheiros SM, Malavolta L, Pavon LF, et al. Application of hyperthermia induced by superparamagnetic iron oxide nanoparticles in glioma treatment. Int J Nanomedicine. 2011;6:591-603. 9. Liu W, Frank JA. Detection and quantification of magnetically labeled cells by
cellular MRI. Eur J Radiol. 2009;70(2):258-64.
10. Rad AM, Arbab AS, Iskander AS, Jiang Q, Soltanian-Zadeh H. Quantification of superparamagnetic iron oxide (SPIO)-labeled cells using MRI. J Magn Reson Imaging. 2007;26(2):366-74.
11. Modo M, Hoehn M, Bulte JW. Cellular MR imaging. Mol Imaging. 2005; 4(3):143-64.
12. Gamarra LF, Amaro E Jr, Alves S, Soga D, Pontuschka WM, Mamani JB, et al. Characterization of the biocompatible magnetic colloid on the basis of Fe3O4 nanoparticles coated with dextran, used as contrast agent in magnetic resonance imaging. J Nanosci Nanotechnol. 2010;10(7):4145-53.
13. Boutry S, Forge D, Burtea C, Mahieu I, Murariu O, Laurent S, et al. How to quantify iron in an aqueous or biological matrix: a technical note. Contrast Media Mol Imaging. 2009;4(6):299-304.
14. Qin J, Laurent S, Jo YS, Roch A, Mikhaylova M, Bhujwalla ZM, et al. A high-performance magnetic resonance imaging T2 contrast agent. Adv Mater. 2007;19(14):1874-8.