ISSN 1806-3713 © 2017 Sociedade Brasileira de Pneumologia e Tisiologia
http://dx.doi.org/10.1590/S1806-37562017000000330
Understanding diagnostic tests. Part 1.
Juliana Carvalho Ferreira1,2, Cecilia Maria Patino1,31. Methods in Epidemiologic, Clinical, and Operations Research–MECOR–program, American Thoracic Society/Asociación Latinoamericana del Tórax, Montevideo, Uruguay.
2. Divisão de Pneumologia, Instituto do Coração, Hospital das Clínicas Faculdade de Medicina, Universidade de São Paulo, São Paulo (SP) Brasil. 3. Department of Preventive Medicine, Keck School of Medicine, University of Southern California, Los Angeles, CA, USA.
PRACTICAL SCENARIO
Investigators studied the diagnostic accuracy of serum procalcitonin levels to diagnose parapneumonic pleural effusions (PPE) and differentiate it from other causes of pleural effusions. They found that procalcitonin (with a cut-off value of 0.195 ng/mL) had a sensitivity of 83%
and a speciicity of 80% to diagnose PPE and accurately
diagnosed individuals with PPE.(1)
USING DIAGNOSTIC TESTS IN CLINICAL PRACTICE
Clinicians are frequently faced with the challenge of diagnosing a disease based on diagnostic test results. Most diagnostic tests used in clinical practice, however, are not perfect and produce false positive results (the test is positive, but the patient does not have the disease) and false negative results (the test is negative, but the patient has the disease). Therefore, learning to interpret the properties of diagnostic tests is a critical competency for clinicians and researchers. In this article, we discuss
sensitivity and speciicity. In the forthcoming parts, we
will discuss positive and negative predictive values, and receiver operating characteristic (ROC) curves.
Sensitivity and speciicity are important measures of
a diagnostic test because they give us an idea of how well a new diagnostic test performs when compared with
an existing gold standard test. Sensitivity is deined as
the proportion of subjects with the disease who have a positive test. In the example in Table 1, true positives (n = 39) divided by the total number of subjects with
disease (n = 47) results in 83%. Speciicity is deined
as the proportion of subjects without the disease who have a negative test. In the example, true negatives (n = 81) divided by total number of subjects without the disease (n = 101) results in 80%.
When a new diagnostic test is evaluated, the investigator
sets a cut-off point which deines whether the test is
positive or negative, and there is always a trade-off
between sensitivity and speciicity. In our example, if
the cut-off point for a positive procalcitonin test was decreased from 0.195 ng/mL to 0.095 ng/mL, it might detect more cases of PPE, decreasing the false negative rate and increasing sensitivity, but the test would also be positive in more subjects without PPE, increasing
the false positive rate and decreasing speciicity. This trade-off between sensitivity and speciicity for several
possible cut-off points can be used to plot a ROC curve and describe the overall test performance in discriminating between presence and absence of the disease; we can
also use sensitivity and speciicity to calculate likelihood
ratios, as we will see later in this series.
Sensitivity and speciicity are useful measures to evaluate
the performance of a diagnostic test but are not very
helpful for personalized clinical decision making.(2) When a clinician is facing a patient with a positive test result, the most important question is: what is the probability that, given that the test is positive, the patient has the disease? The sensitivity of the test does not tell us that; it tells us the probability of a positive test, given that the patient has the disease. We will address more relevant clinical measures of diagnosis in part 2 of this series.
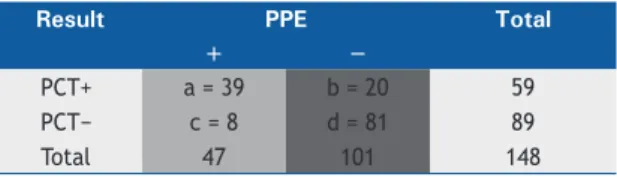
Table 1. Diagnostic performance of serum procalcitonin testing for identifying parapneumonic pleural effusion.
Result PPE Total
+ −
PCT+ a = 39 b = 20 59
PCT− c = 8 d = 81 89
Total 47 101 148
Data obtained from He et al.(1)PCT: procalcitonin; PPE: parapneumonic pleural effusion. Sensitivity (light grey column) = a/(a + c). Speciicity (dark grey column) = b/(b + d).
REFERENCES
1. He C, Wang B, Li D, Xu H, Shen Y. Performance of procalcitonin in diagnosing parapneumonic pleural effusions: A clinical study and meta-analysis. Medicine (Baltimore). 2017;96(33):e7829. https://doi.
org/10.1097/MD.0000000000007829
2. Altman DG, Bland M. Diagnostic tests. 1: Sensitivity and speciicity. BMJ. 1994;308(6943):1552. https://doi.org/10.1136/bmj.308.6943.1552 J Bras Pneumol. 2017;43(5):330-330
330