The aim in this study was to evaluate the influence of different ratio of camphorquinone/ tertiary amine concentration on the flexural strength (FS), elastic modulus (EM), degree of conversion (DC), yellowing (YL), water sorption (WS) and water solubility (WSL) of experimental composites. Thus, acrylate blends were prepared with different camphorquinone (CQ) and amine (DABE) concentrations and ratios by weight: (CQ/DABE%): 0.4/0.4% (C1), 0.4/0.8% (C2), 0.6/0.6% (C3), 0.6/1.2% (C4), 0.8/0.8% (C5), 0.8/1.6% (C6), 1.0/1.0% (C7), 1.0/2.0% (C8), 1.5/1.5% (C9), 1.5/3.0% (C10). For the FS and EM, rectangular specimens (7x2x1 mm, n=10) were photo-activated by single-peak LED for 20 s and tested at Instron (0.5 mm/ min). Then, the same specimens were evaluated by FTIR for DC measurement. For YL, disks (5x2 mm, n=10) were prepared, light-cured for 20 s and evaluated in spectrophotometer using the b aspect of the CIEL*a*b* system. For WS and WSL, the volume of the samples was calculated (mm³). For WS and WSL, composites disks (5x0.5 mm, n=5) were prepared. After desiccation, the specimens were stored in distilled water for 7 days and again desiccated, in order to measure the WS and WSL. Data were submitted to one-way ANOVA and Tukey’s test (5%). The groups C8, C9 and C10 showed higher DC, EM and YL means, compared to other composites. Therefore, the FS and WS values were similar among all groups. Also, C1, C2 and C3 presented higher WSL in 7 days, compared to other composites. In general, higher concentrations of camphorquinone promoted higher physical-mechanical properties; however, inducing higher yellowing effect for the experimental composites.
Influence of Different Concentration
a n d R a t i o o f a P h o t o i n i t i a t o r
S y s t e m o n t h e P r o p e r t i e s o f
Experimental Resin Composites
Caio Vinícius Signorelli Grohmann1, Eveline Freitas Soares1, Eduardo José Carvalho Souza-Junior2, William Cunha Brandt3, Regina Maria Puppin-Rontani4, Saulo Geraldeli5, Mário Alexandre Coelho Sinhoreti1
1Department of Restorative Dentistry, Dental Materials Division, Piracicaba Dental School, UNICAMP - Universidade Estadual de Campinas, Piracicaba, SP, Brazil 2Department of Prosthodontics, UNIVAG - Centro Universitário de Várzea Grande, Cuiaba, MT, Brazil 3Dental School, UNISA - Universidade de Santo Amaro, São Paulo, SP, Brazil 4Department of Pediatric Dentistry, Piracicaba Dental School, UNICAMP - Universidade Estadual de Campinas, Piracicaba, SP, Brazil 5Restorative Dental Science Department, Operative Dentistry Division, College of Dentistry, University of Florida, Gainesville, FL, USA
Correspondence: Mário Alexandre Coelho Sinhoreti, Avenida Limeira, 901, 13414-903 Piracicaba, SP, Brasil. Tel: +55-19-2106-5374. e-mail: [email protected]
Key Words: camphorquinone, dental resin, curing performance.
Introduction
To achieve satisfactory polymerization of the resin composites, a proper combination of photoinitiator/co-initiator system, which are usually camphorquinone (CQ) and a tertiary amine, respectively (1,2) should be used. Light absorption raises CQ to an excited state that interacts with a tertiary amine, forming a triplet exciplex that disintegrates into free radicals. These radicals initiate the polymerization of methacrylates, which success conducts on obtaining a reliable bond and good polymerization (3). The concentration of CQ and amine, as well as the CQ/amine ratio, play important roles in the polymerization efficiency and ultimately in the physical and mechanical properties of resin composite materials (4-6).
CQ is inherently yellow and can cause a color mismatch in aged aesthetic resin-based composite restorations. This mismatch becomes even more pronounced if bleaching is performed in those restored teeth (7). Moreover, due to the tendency for internal discoloration of the resin composite, the amount of the tertiary amine may be a concern, since these amines have double bonds, which are capable of absorbing UV light and react with oxygen or other aromatic groups, causing the yellowing of the
material (8). According to Musanje et al. (4), higher quantities of CQ promote a rapid generation of large amounts of free radicals, but this may result in a reduced ability to form an adequate polymer network, since polymers with relatively lower molecular weight are formed. On the other hand, in accordance with Schneider et al. (5), the high concentration of the photoinitiator system may guarantee a high monomer conversion and consequently higher physical and mechanical properties of the composites. Therefore, the intense yellow hue of CQ places practical limits on the concentration of photoinitiators that can be used, because of the esthetic properties, but this may not limit the degree of polymerization and depth of cure that can be attained (9).
Concentration and ratio of photoinitiator system
behavior and consequently better chemical-mechanical properties without increasing the yellowing of the composite restorations.
The purpose in this study was to determine the optimal concentration and ratio of camphorquinone (CQ) and tertiary amine (DABE) in relation to the degree of conversion (DC), color stability (CS), elastic modulus (EM), flexural strength (FS), water sorption (SP) and solubility (SL) of microhybrid experimental composites. The tested hypotheses were: 1) The higher the content of CQ, the higher are the physical-mechanical properties, but also the yellowing effect of the experimental composites; 2) The higher the DABE ratio, the higher are the properties, but also the yellowing effect.
Materials and Methods
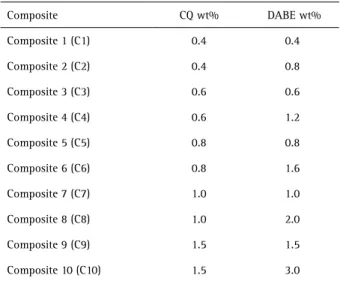
Resin PreparationTen experimental resin formulations were tested in this study. The resin matrix for all formulations consisted of a combination of bisphenol glycidyl methacrylate – 29.0 wt% (BisGMA – Sigma-Aldrich Inc, St Louis, MO, USA); urethane dimethacrylate – 32.5 wt% (UDMA - Sigma-Aldrich Inc); bisphenol ethoxylate dimethacrylate – 32.5 wt% (BisEMA - Sigma-Aldrich Inc); and triethyleneglycol dimethacrylate – 6.0 wt% (TEGDMA - Sigma-Aldrich Inc). Composites were loaded at 75% by volume with silanized filler (20 wt% of 0.04 μm colloidal silica and 80 wt% of 0.7 µm Ba-Al-silicate glass with 0.7 µm – FGM, Joinville, SC, Brazil). The inhibitor, BHT (butylated hydroxytoluene; Sigma-Aldrich Inc), was added to the organic matrix in a concentration of 0.1 wt% to avoid spontaneous polymerization of the monomers. From this base-composition, ten experimental composites were produced, varying the concentration and ratio of the photo-initiator system (CQ - camphorquinone and DABE - N,N-dimethyl-p-aminobenzoic acid ethylester; Sigma-Aldrich Inc). The experimental groups are shown in Table 1.
Degree of Conversion
For the degree of conversion (DC) analysis, bar-shaped specimens (7 mm length x 2 mm width x 1 mm thickness) (n=10) were made in molds of silicon and photo-activated by a LED curing unit (Radii Cal, SDI, Victoria, Australia - 900 mW/cm2), for 20 s. The energy density was standardized at 16 J/cm2. After polymerization, the specimens were removed from the molds and dry stored in light-proof containers at 37 °C for 24 h. DC was measured on the top surface of each specimen using Fourier Transformed Infrared spectroscopy with attenuated total reflectance (FTIR/ATR - Spectrum 100; PerkinElmer, Shelton, CA, USA).
The absorption spectra of non-polymerized and polymerized composites were obtained from the region between 4000 and 650 cm−1 with 32 scans at 4 cm−1. The
aliphatic carbon-carbon double-bond absorbance peak intensity (located at 1638 cm−1) and that of the aromatic (C…C) (located at 1608 cm−1; reference peak) were collected. The DC (%) was calculated using the following equation: DC (%)=100×[1−(R polymerized/R non-polymerized)], where R represents the ratio between the absorbance peak at 1638 cm−1 and 1608 cm−1.
Flexural Strength and Elastic Modulus
Immediately after the DC analysis, the same bar-shaped specimens (n=10) were used for the three-point bending flexural test. The flexural test was performed according to ISO 4049:2009, except for the specimen’s dimensions (7 mm length x 2 mm width x 1 mm thickness). The specimens were photo-activated by a LED curing unit (Radii-Cal, 900 mW/ cm2) for 20 s and dry stored in light-proof containers for 24 h at 37 °C. The three-point bending test was performed in a universal testing machine (Instron, Canton, USA. span between supports=5 mm) at a cross-head speed of 0.5 mm/ min. The maximum load for the specimens at fracture was recorded and the flexural strength (FS) calculated using the following equation: FS=3FL/(2bh2), where F is the maximum load (N) exerted on the specimens; L the distance (mm) between the supports; b is the width (mm) of the specimens measured immediately prior testing; h is the height (mm) of the specimens measured immediately prior testing.
The elastic modulus was measured as the slope of the strain x strain curve in the linear portion, using the following equation: E=L1D310-3/4bh3d, where L1 is load (N), d: distance (mm) between the supports, b: width (mm), h: height (mm) and D: displacement (mm).
Yellowing Effect
The experimental resin composites were inserted in
Table 1. Concentration and ratio of the photo-initiator system of the experimental composites
C
.V
.S. Grohmann et al.
circular Teflon molds (6 mm diameter x 0.5 mm thickness) with placement of a Mylar strip on the top and bottom surfaces (n=10). Then, the composites were photoactivated for 20 using a LED curing unit (SDI, 900 mW/cm2; Radii Cal) and were dry stored in light-proof containers for 24 h at 37 °C. For the yellowing effect analysis, a spectrophotometer CM-700d (Minolta, Corp., Ramsey, NJ, USA) was utilized to measure the b-axis parameter of the CIELab system. This parameter measures the yellow color of a material, with higher b-values relating to a greater yellowing effect.
Water Sorption and Solubility
This study was performed in compliance with ISO 4049:2009 standard specifications (except for the specimen dimensions and curing protocol) as follows. To verify the sorption (WS) and solubility (WBS), circular samples (0.5 mm thickness x 6 mm diameter) (n=5) were photo-activated by a LED curing unit (SDI, 900 mW/cm2; Radii Cal) for 20 s. The specimens were stored in desiccators containing silica gel at 37 °C and weighed daily on an analytical balance (Tel Marke; Bel Quimis, Sao Paulo, SP, Brazil) accurate to 0.0001 g, until a constant mass (m1) was obtained (i.e. three days of no weight change). Thickness (four measurements at four equidistant points on the circumference) and diameter of each specimen were measured using a digital electronic caliper (Mitutoyo Corporation, Tokyo, Japan). Mean values were used to calculate the volume (V) of each specimen (in mm³). Thereafter, the samples were stored in plastic containers with 6 mL of distilled water at 37 °C for 7 days and weighed daily after carefully wiping with absorbent paper. When constant weight was obtained (two days of
no weight change) this value was recorded as m2 and the samples were returned into the desiccators. The entire mass reconditioning cycle was repeated and the constant mass (two days of no weight change) was recorded as m3. The values for water sorption (WS) and solubility (WSB), in micrograms per cubic millimeters, were calculated using the following equations:
WS=(m2–m3)/V WSB=(m1–m3)/V
Statistical Analyses
Data were analyzed by one-way ANOVA and Tukey’s post-hoc test. Statistical significance was established at
α=0.05 for all tests.
Results
FS, EM, DC and yellowing effect means are shown in Table 2. The composites C6, C7, C8, C9 and C10 showed higher DC when compared to the other composites (p=0.00001). For the flexural strength (FS), all composites showed similar values (p=0.41797). In relation to the elastic modulus (EM), the composites containing CQ/DABE in the 1.5/1.5 wt% (C9) and 1.5/3.0 wt% (C10) showed higher values (p=0.00001). As expected, the yellowing effect (YL) was higher for the composites having higher ratio of phothoinitiators (C9 and C10, p=0.00001). As normal distribution was not possible, the data for water sorption (WS) and water solubility (WSB) were log transformed (log x+0). After, the normalized data were submitted to one-way ANOVA and Tukey’s test (α=0.05). The means are shown in the Table 3. All groups showed similar WS means, after 7
Table 2. Means (standard-deviation) of elastic modulus (EM), flexural strength (FS), yellowing (YL) and degree of conversion (DC) for the tested experimental composites
Composite EM (GPa) FS (MPa) YL (b*) DC (%) C1 2.4 (0.5)CD 104.8 (27.5)A 13.5 (1.1)EF 56.9 (1.2)C
C2 2.1 (0.4)D 107.0 (19.8)A 12.6 (2.8)F 54.9 (3.4)C
C3 2.6 (0.3)CD 117.1 (23.1)A 16.3 (1.2)CDE 57.7 (3.1)C
C4 2.8 (0.5)BC 110.2 (32.0)A 15.7 (1.6)ED 56.9 (3.0)C
C5 2.7 (0.5)CD 121.2 (22.1)A 17.9 (0.8)BCD 61.0 (2.2)B
C6 2.6 (0.2)CD 127.4 (10.7)A 16.2 (0.3)CDE 65.2 (2.2)A
C7 2.6 (0.1)CD 122.9 (13.6)A 19.8 (0.6)B 67.7 (1.2)A
C8 2.7 (0.2)BC 122.1 (19.9)A 19.0 (1.5)BC 66.8 (1.5)A
C9 3.3 (0.4)AB 119.3 (19.3)A 24.4 (1.9)A 66.1 (1.1)A
C10 3.9 (0.2)A 125.5 (21.0)A 24.2 (0.7)A 66.7 (2.5)A
Means followed by same capital letter in the same column are not statistically different at 5%, by Tukey’s test
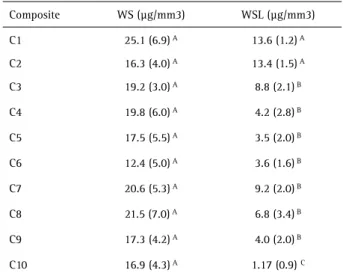
Table 3. Means (standard-deviation) of water sorption (WS) and water solubility (WSL) for the tested experimental composites
Composite WS (µg/mm3) WSL (µg/mm3) C1 25.1 (6.9) A 13.6 (1.2) A
C2 16.3 (4.0) A 13.4 (1.5) A
C3 19.2 (3.0) A 8.8 (2.1) B
C4 19.8 (6.0) A 4.2 (2.8) B
C5 17.5 (5.5) A 3.5 (2.0) B
C6 12.4 (5.0) A 3.6 (1.6) B
C7 20.6 (5.3) A 9.2 (2.0) B
C8 21.5 (7.0) A 6.8 (3.4) B
C9 17.3 (4.2) A 4.0 (2.0) B
C10 16.9 (4.3) A 1.17 (0.9) C
Concentration and ratio of photoinitiator system
days of immersion in distilled water (p=0.15213). However, for the WSB, the composites containing the lower amount of the photoinitiator system presented higher WSB values after 7 days of immersion in distilled water (p=0.00001).
Discussion
The type and concentration of the photoinitiator system are fundamental parameters that determine the polymerization characteristics of a resin composite (1). Commercial resin composites are supplied with a wide range of concentration of these molecules and their effects on the polymerization behavior and physical-mechanical properties have not been completely elucidated. Some studies have evaluated CQ concentrations ranging from 0.05-3 wt% (4,5,13,14). In this study, the concentration of CQ ranged from 0.4 to 1.5 wt% because they are the concentrations most commonly observed in the formulation of the current composite resins. The outcomes was shown that this range affected the tested mechanical properties and the yellowing effect. Thus, the first hypothesis tested was accepted.
For the DC analysis, Alonso et al. (15), using similar composite formulations as those in this study, found a significant reduction of monomer conversion when a experimental composite containing 0.5 wt% of CQ was compared to the one containing 1.5 wt%, i.e., the higher the initiator concentration, the higher the DC. This is consistent with the present study in which higher CQ concentrations resulted in higher DC. On the other hand, Musanje et al. (4) found that composites with 1.44 wt% of CQ, the polymer matrix would interfere badly and decline the physical properties of the resin material.
The higher DC for composites with higher concentration of CQ/DABE may be explained by the fact that they allow the generation of more free radicals during light application, promoting increased monomer conversion (16-18). In this study, the threshold level of photoinitiator concentration was 0.8% of CQ and 1.6% of the co-initiator (C6), since this composite reached the maximum DC with good physical properties and a low yellowing effect. However, for the EM, the higher the CQ concentration, the higher the EM values for the tested composites. This finding it is also supported by the higher DC found in these composites. The higher DC should have improved the cohesive forces of the polymer network of these composites, which became more rigid to deformation and can ensure good clinical performance of these composites (19).
The photoinitiator content of a composite must be sufficient to allow an adequate polymerization (18,20). An inadequate polymerization affects biocompatibility due to the release of monomers that may damage cells in oral tissues (21). This would argue for higher CQ/amine
concentrations to maximize cure. However, the yellowing effect causing by the presence of CQ may cause difficulty in matching dental restorations, as well as result in a tendency for internal discoloration due to the amine (1, 22). Therefore, the CQ/amine concentration should be as low as possible to produce a satisfactory DC but without causing esthetic problems; this is why the formulation of C6 may be the optimal concentration of CQ/DABE in the present study, since it presents high DC with low yellowing effect. While water sorption was similar among the composites, the composites with higher photoinitiator concentration resulted in less solubility. This result is consistent with the DC outcomes. The WS may be more dependent upon the chemical composition of the monomers, which was equivalent in the ten composites, and thus they did not show a difference in water uptake. The solubility may be more related to formulation (monomers type/concentration) and polymer network formation (monomer conversion). Composites presenting higher DC have fewer residual monomers to be leached (23). Also, these composites would be less degraded through hydrolytic degradation by the water than would composites with poorer conversion (5, 24).
In general, the DABE ratio did not influence the polymerization performance of the experimental composites, except for the composites C5 and C6 in DC. Based on this, the second hypothesis was rejected, since for the majority of the composites the DABE concentration did not influence the selected properties. This result indicates that the amount of CQ has a greater influence on the curing efficiency for this resin system than the amine content and that hydrogen abstraction with the higher amine content does not help or interfere in forming the polymer network (16). It might be suggested that the production of free radicals is not limited by the concentration of the co-initiator, but duration of curing light exposure. In this study was used a high energy density (16 J/cm2) for photoactivate the specimens, which may have contributed to compensate the effect of amine content. This is in accordance with previous investigations (24,25) where DC and rate of polymerization were independent of co-initiator concentration. Moreover, it has been suggested that hydrogen abstraction necessary for polymerization may take place without a co-initiator, possibly by direct interaction between the initiator and resin monomer, which contains active hydrogen ions (25).
C.V
.S. Grohmann et al.
Resumo
O objetivo foi avaliar a influência da concentração e proporção de canforoquinona (CQ)/amina terciária (DABE) na resistência à flexão (RF), módulo flexural (MF), grau de conversão (GC), amarelamento (AM), sorpção (SA) e solubilidade em água (SL) de compósitos experimentais. Blendas acrilatas foram preparadas com diferentes concentrações e proporções de CQ/DABE em peso, como segue: (CQ/DABE%): 0,4/0,4% (C1); 0,4/0,8% (C2); 0,6/0,6% (C3); 0,6/1,2% (C4); 0,8/0,8% (C5); 0,8/1,6% (C6); 1,0/1,0% (C7); 1,0/2,0% (C8); 1,5/1,5% (C9); 1,5/3,0% (C10). Para RF e MF, espécimes retangulares (7x2x1 mm, n=10) foram fotoativados com LED de pico único (Radii Cal) por 20 s e testados em máquina Instron (0,5 mm/min). Após, o GC dos mesmos espécimes (fragmentos) foi mensurado por FTIR. Para AM, discos de compósito (5x2 mm, n=10) foram preparados, fotoativados por 20 s e imediatamente avaliados em espectrofotômetro, considerando o aspecto b do sistema CIEL*a*b*. Para SA e SL, discos de compósito (5x0,5 mm, n=5) foram preparados e seus volumes calculados (mm³). Após desidratação, as amostras foram pesadas e armazenadas em água destilada por 7 dias, pesadas e novamente desidratadas e pesadas, para se calcular o SA e SL. Os dados foram submetidos a one-way ANOVA e teste de Tukey (5%). Os grupos C8, C9 e C10 mostraram maior GC, MF e AM, comparado aos outros grupos. No entanto, RF e SA foram similares entre todos os grupos. Ainda, C1, C2 e C3 apresentaram maior SL em 7 dias comparado aos outros grupos. Em geral, maiores concentrações de CQ promoveram melhores propriedades físico-mecânicas; no entanto, levaram ao maior amarelamento dos compósitos.
References
1. Park YJ, Chae KH, Rawls HR. Development of a new photoinitiation system for dental light-cure composite resins. Dent Mater 1999;15:120-127.
2. Pereira SG, Telo JP, Nunes TG. Towards a controlled photopolymerization of dental dimethacrylate monomers: EPR studies on effects of dilution, filler loading, storage and aging. J Mater Sci Mater Med 2008;19:3135-3144.
3. Segreto DR, Naufel FS, Brandt WC, Guiraldo RD, Correr-Sobrinho L, Sinhoreti MA. Influence of photoinitiator and light-curing source on bond strength of experimental resin cements to dentin. Braz Dent J 2016;27:83-89.
4. Musanje L, Ferracane JL, Sakagushi RL. Determination of the optimal photoinitiator concentration in dental composites based on essential material properties. Dent Mater 2009;25:994-1000.
5. Schneider LFJ, Cavalcante LM, Consani S, Ferracane JL. Effect of co-initiator ratio on the polymer properties of experimental resin composites formulated woth camphorquinone and phenyl-propanedione. Dent Mater 2009;25:369-375.
6. Furuse AY, Mondelli J, Watts DC. Network structures of Bis-GMA/ TEGDMA resins differ in DC, shrinkage-strain, hardness and optical properties as a function of reducing agent. Dent Mater 2011;27:497-506.
7. Alvim HH, Alecio AC, Vasconcellos WA, Furlan M, Oliveira JE, Saad JRC. Analysis of camphorquinone in composite resins as a function of shade. Dent Mater 2007;23:1245-1249.
8. Oliveira DC, Silva CB, Muniz BV, Volpato MC, Costa AR, Sinhoreti MA. Effect of 4-(N,N-dimethylamino)phenethyl alcohol on degree of conversion and cytotoxicity of photo-polymerized CQ-based resin composites. Braz Dent J 2014;25:538-542.
9. Salgado VE, Borba MM, Cavalcante LM, Moraes RR, Schneider LF. Effect of photoinitiator combinations on hardness, depth of cure, and color of model resin composites. J Esthet Restor Dent 2015;27:S41-S48. 10. Oliveira DC, Rocha MG, Gatti A, Correr AB, Ferracane JL, Sinhoreti
MA. Effect of different photoinitiators and reducing agents on cure efficiency and color stability of resin-based composites using different LED wavelengths. J Dent 2015;43:1565-1572.
11. Nomura Y, Teshima W, Kawahara T, Tanaka N, Ishibashi H, Okazaki M, et al.. Genotoxicity of dental resin polymerization initiators in vitro. J Mater Sci Mater Med 2006;17:29-32.
12. Oliveira DC, Rocha MG, Correa IC, Correr AB, Ferracane JL, Sinhoreti MA.The effect of combining photoinitiator systems on the color and curing profile of resin-based composites. Dent Mater 2016;32:1209-1217.
13. Shin D-H, Rawls HR. Degree of conversion and color stability of the light curing resin with new photoinitiators systems. Dent Mater 2009;25:1030-1038.
14. Schroeder WF, Vallo CI. Effect of different photoinitiator systems on conversion profiles of a model unfilled light-cured resin. Dent Mater 2007;23:1313-1321.
15. Alonso RC, Souza-Júnior EJ, Dressano D, Araújo GA, Rodriguez JM, Hipólito VD, et al.. Effect of photoinitiator concentration on marginal and internal adaptation of experimental composite blends photocured by modulated methods. Eur J Dent 2013;7:S1-S8.
16. Ogunyinka A, Palin WM, Shortall AC, Marquis PM. Photoinitiation chemistry affects light transmission and degree of conversion of curing experimental dental resin composites. Dent Mater 2007;23:807-813. 17. Chen Y-C, Ferracane JL, Prahl SA. Quantum yield of conversion of the
photoinitator camphorquinone. Dent Mater 2007;23:655-664. 18. Schneider LFJ, Pfeifer CSC, Consani S, Prahl SA, Ferracane JL. Influence
of photoinitiator type on the rate of polymerization, degree of conversion, hardness and yellowing of dental resin composites. Dent Mater 2008;24:1169-1177.
19. Gonçalves F, Pfeifer CCS, Stanbury JW, Newman SM, Braga RR. Influence of matrix composition on polymerization stress development of experimental composites. Dent Mater 2010;26:697-703.
20. Brandt WC, Tomaselli LO, Correr-Sobrinho L, Sinhoreti MAC. Can phenyl-propanedione influence Knoop hardness, rate of polymerization and bond strength of resin composite restorations? J Dent 2011;39:438-447.
21. Geurtsen W, Spahl W, Leyhausen G. Residual monomer/additive release and variability in cytotoxicity of light-curing glass-ionomer cements and compomers. J Dent Res 1998;77:2012-2019.
22. Moin Jan C, Nomura Y, Urabe H, Okazaki M, Shintani H. The relationship between leachability of polymerization initiator and degree of conversion of visible light-cured resin. J Biomed Mater Res 2001;58:42-46.
23. Schneider LF, Moraes RR, Cavalcante LM, Sinhoreti MA, Correr-Sobrinho L, Consani S. Cross-link density evaluation through softening tests: effect of ethanol concentration. Dent Mater 2008;24:199-203. 24. Asmussen E, Peutzfeldt A. Influence of composition on rate of
polymerization contraction of light-curing resin composites. Acta Odontol Scand 2002;60:146–150.
25. Yoshida K, Greener EH. Effect of photoinitiator on degree of conversion of unfilled light cured resin. J Dent 1994;22:296–299.