Int. J. Electrochem. Sci., 9 (2014) 593 - 609
International Journal of
ELECTROCHEMICAL
SCIENCE
www.electrochemsci.orgGalvanic Corrosion of Two Non Noble Dental Alloys
S Capelo1,2,*, L Proença1,3.*, JCS Fernandes4,*, ITE Fonseca1,*
1 Centro de Ciências Moleculares e Materiais (CCMM), Departamento de Química e Bioquímica, Faculdade de Ciências, Universidade de Lisboa, Campo Grande, Ed. C8, 1749-016 Lisboa, Portugal. 2DPAO, Escola de Ciências e Tecnologia, Universidade de Évora, Colégio Luís António Verney, Rua
Romão Ramalho, 59,7000-671 Évora, Portugal.
3Centro de Investigação Interdisciplinar Egas Moniz (CiiEM), Instituto Superior de Ciências da Saúde
Egas Moniz, Campus Universitário, Monte de Caparica, 2829-511 Caparica, Portugal. 4DEQ/ICEMS, Instituto Superior Técnico, Universidade Técnica de Lisboa, Lisboa, Portugal *
E-mail: [email protected]; [email protected]; [email protected]; [email protected]
Received: 31 July 2013 / Accepted: 2 October 2013 / Published: 8 December 2013
This study aims to evaluate the corrosion resistance of two nonnoble dental alloys, namely, the Wiron®88 (Ni–Cr–Mo) and the Remanium 2000+ (Co–Cr–Mo–W). A noble alloy, the V-Gnathos® Plus (AuPt) previously studied was also considered for the purpose of comparison. The study was conducted in artificial saliva, pH 7.1, at 37 °C, by cyclic and linear sweep voltammetry, electrochemical impedance spectroscopy and chronoamperometry. The Rp value of the alloy of high contents of Ni, the Wiron®88, was 26.2±0.2 kΩ cm2 and of the one with high contents of Co, the Remanium 2000+, was 22.5±0.6 kΩ cm2. Data from linear polarization resistance and electrochemical impedance spectroscopy lead to the same order for the resistance against corrosion. The order from the less to the more reactive alloy is: Wiron®88 → Remanium 2000+. The galvanic cell obtained by coupling the two nonnoble alloys presents very low cell potential (a few mV, -18 mV), while the galvanic cell between one noble alloy (the V-Gnathos® Plus) and the Wiron®88 showed a higher cell potential (-104 mV). Both galvanic couples, under short circuit, have lead to the release of cations, namely, Co2+, in the case of the Wiron®88|Remanium 2000+ and Ni2+ for the Wiron®88|V-Gnathos® Plus, galvanic couples, respectively, with the ionic concentrations reaching values of 12.15 and 7.30
g L-1
(7.30 ppb), respectively. SEM micrographs obtained after 25 days immersion in artificial saliva, at 37 °C, showed the formation of well-defined pits on the surface of the two non-noble alloys.
Keywords: dental alloys – Wiron®88 –Remanium 2000+ – ions release – galvanic couples 1. INTRODUCTION
dentistry and in implants. Since chromium is able to form a protective oxide film on the surface then it can be added to Co to improve the corrosion resistance of the Cobased alloys. According to the literature [1] contents of Cr from 16 to 27% provide good corrosion resistance to the Co-based alloys and the addition of Mo will also further enhance corrosion resistance. The Co–Cr–Mo implant alloys exhibit attractive properties such as mechanical strength and biocompatibility, corrosion resistance, safety, ductility and wear resistance [1-4].
Dental alloys used in oral rehabilitation are to be kept in contact with the patient saliva for several years, thus they need to be resistant to corrosion in the presence of the oral cavity fluid. During the corrosion process ions that may have adverse effects for the human health may be released. The biological fluid in the oral cavity may suffer several changes such as temperature, pH, composition, etc., factors that certainly play a role in the stability of the alloys. On the basis of the literature, there is little doubt that elements are released from all dental casting alloys into the oral cavity [5]. The organisms may suffer the consequences due to the toxicity and sensitization risk (see the review by Wataha [5]).
Manaranche et al. [6] have found that the rate of ions release is a function of the corrosion rate of the respective alloy and of the solubility of the corrosion products first formed.
Many electrochemical studies have been performed for the evaluation of the corrosion resistance of Co-based alloys [7-12].
Hsu et al. [9] have studied the electrochemical corrosion behavior of Co-Cr-Mo implant alloys in different biological solutions including urine, serum and joint fluid.
They have found corrosion current densities (jcorr) of Co-Cr-Mo implant alloys in the three biological solutions, with values in the range of 1.65 to 2.59 A cm−2
.
The corrosion behavior of Ni-Cr and Co-Cr based alloys, as well as the Ni-Cr-Mo alloys, has also been studied by several authors [13-20]. The formation of galvanic cells, when two different alloys are immersed in the same electrolyte, such as the oral cavity biological fluid, is a problem that has to be considered. Arlsan et al. [20] have studied the corrosion behavior of Ti-based dental materials, coupled with gold, chromium–nickel and cobalt–chromium alloys, in Ringer solution, at 37 °C. The analysis of the galvanic potentials and currents revealed that the Ti6A14V|Au couple was the most suitable one against galvanic corrosion. The other two couples: Ti6A14V|CoCr and Ti6A14V|CrNi were found to be similar. Ciszewski et al. [21] have studied the galvanic corrosion behavior of a chromium–cobalt alloy (Remanium 380) and a chromium-nickel alloy (Remanium CS), when coupled with a silver-based amalgam (Amalcap plus). They have concluded that the couples between Remanium CS and the Remanium GM 380 are not a potential source of galvanic currents in the oral cavity. However, when one of the alloys is coupled with the amalgam alloy, such as the Amalcap plus, it is possible to expect some metal ions release, as a consequence of the galvanic currents. It was found, by adsorptive stripping voltammetric analysis, that nickel or cobalt, depending on the alloy, appeared in the saliva solution and increased in concentration over time.
37 °C, during one, three and seven days. The greatest amount of element release obtained after seven days was 134.9 ppb.
In a recent publication on the galvanic corrosion behavior of Ti and Ti6Al14V coupled to noble dental alloys [28] the authors of the present paper have published data on the galvanic corrosion behaviour of Ti and Ti6Al4V alloy coupled to noble dental alloys. Values of the jcouple varying between 0.2 and 0.7 A cm-2 were obtained for the four noble alloys when coupled to pure titanium or to the titanium alloy.
The main goal of the present study is the evaluation of the corrosion resistance of two nonnoble alloys: the Wiron®88, a Ni-Cr-Mo and the Remanium 2000+, a Co-Cr-Mo alloy, both immersed in artificial saliva of neutral pH, at 37 °C. The galvanic currents and the cell potentials of the galvanic couples between the two non–noble alloys and the Ni–based and the V-Gnathos® Plus, were measured, as well as the amount of ions released, during 25 days immersion in artificial saliva, at short circuit and 37 °C. The surface of the electrodes, after the 25 days immersion, has been observed by scanning electron microscopy (SEM) and electron diffraction spectroscopy (EDS) analysis has been performed.
2. MATERIALS AND METODS 2.1. Specimens
2.1.1 Composition of alloys
The composition of the three alloys is listed in Table 1
Table 1. Composition of the alloys
[normalized wt.% ]
Dental alloy Symbol Ni Co Cr Mo W Si Au Pt Remanium 2000+ R --- 58.9 22.6 9.1 5.1 1.3 --- --- Wiron®88 W 62.3 --- 27.9 7.9 --- 1.9 --- --- V-Gnathos® Plus VG --- --- --- --- --- --- 85.9 11.7
2.1.2 Preparation of specimens
2.2 Test solution
The test solution used was the artificial saliva with the composition given in Table 2, according to Duffó and Castillo [29].All chemical compounds were supplied by Sigma. The test solution was prepared by dissolving the compounds in one liter of ultrapure water (Milli-Q from Millipore). A pH of 7.1 was measured with a pH meter from Metrohm, model 620. All the experiments were conducted with the electrochemical cell in a thermostatic bath at 37 °C. Solutions were not-deoxygenated.
Table 2. Composition of the artificial saliva [29]
Compounds NaCl KCl CaCl2. 2H2O KH2PO4 Na2HPO4 .12H2O
KCN citric acid
(g L-1) 0.600 0.720 0.220 0.680 0.856 0.060 0.030
2.3 Electrochemical tests
Cyclic voltammetry (CV), linear sweep voltammetry (LSV) and electrochemical impedance spectroscopy (EIS) were performed via a potentiostat/galvanostat Autolab PGSTAT12 equipped with a Frequency Response Analyzer (FRA2) from Metrohm Autolab B.V.
Polarization curves were recorded over a wide potential range, at a scan rate of 1 mV s-1, and then in a narrow potential range, around EOCP, at a scan rate of 0.5 mV s-1. These curves were used to obtain the E(i=0) and Rp values.
Impedance electrochemical studies were performed by applying a sinusoidal potential wave, around the open circuit potential, after keeping the electrode in the solution, at 37 °C, during a period of 10 minutes, at OCP. Frequencies ranging from 0.1 to 104 Hz were used, with an amplitude of 10 mV rms.
The galvanic cell voltage, Ecell and the galvanic cell current densities of the alloy pairs were measured in a two-electrode cell, at open and short circuit, respectively. The potential difference (galvanic cell voltage) was measured over a period of 10 minutes, while the current time transients were recorded during a period of 24 h. For both pairs the W (Ni-Cr-Mo) alloy was the electrode connected to the HI connector (+) of the digital HP 34410A/Agilent multimeter.
All the experiments were conducted in a not-deoxygenated aqueous solution of artificial saliva (simulating the oral cavity conditions), at 37 °C.
The scanning electron microscope observations were performed via an Hitachi microscope, model S-2400, coupled to a Silicon Drift Detector from Bruker equipped with Quantax Esprit 1.9 software.
3. RESULTS AND DISCUSSION 3.1Cyclic voltammetric studies
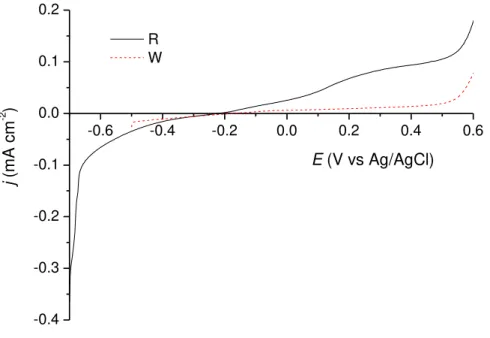
Figure 1 presents the cyclic voltammograms (CVs) of the Remanium 2000+ (Co-Cr-Mo-W) and the Wiron®88 (Ni-Cr-Mo) alloys immersed in artificial saliva, at 37 ºC, recorded at 100 mV s-1, for polarizations between the potential of the H2 evolution and the positive limits of +0.65 and +0.80 V vs. Ag/AgCl.
a
-1.0 -0.8 -0.6 -0.4 -0.2 0.0 0.2 0.4 0.6 0.8
-0.6 -0.4 -0.2 0.0 0.2 0.4 0.6
E (V vs Ag/AgCl)
j
(m
A
cm
-2 )
R W
b
-1.0 -0.8 -0.6 -0.4 -0.2 0.0 0.2 0.4 0.6 0.8
-0.5 0.0 0.5 1.0 1.5 2.0
E (V vs Ag/AgCl)
j
(
m
A
cm
-2 )
R W
Fig. 1a shows, on the CV from Wiron®88, anodic currents starting at a more negative potential, followed by a broad anodic peak, around -0.40 V. In this sense this alloy shows more reactivity. However when the potential is extended to more anodic values (e.g. +0.80 V) the CVs of the Wiron®88 and Remanium 2000+ (Fig.1b) are almost superimposed. The breakdown of the passivity, Eb, is observed at +0.483 and +0.526 V vs. Ag/AgCl, for Wiron®88 and Remanium 2000+, respectively. A crossover of the two anodic curves, which, accordingly to the literature [30-32] is, in principle, indicative of the occurrence of pitting is observed for both alloys. On their study on the corrosion of Ni-Cr-Mo alloys in aqueous solutions 0.05 % in NaCl, from cyclic voltammograms, recorded at 10 mV s-1, Sampaio et al. [15] have reported values for the rupture of passivity, Eb ranging between +0.6 and +0.8 V vs. SCE, depending on the Ni and Cr contents.
3.2 Linear Polarization Curves
Figure 2 presents the linear polarization curves of the two non- noble alloys, recorded at 1 mV s-1, for polarization between the H2 evolution potential and the breakdown potential, Eb.
-0.6 -0.4 -0.2 0.0 0.2 0.4 0.6
-0.4 -0.3 -0.2 -0.1 0.0 0.1 0.2
E (V vs Ag/AgCl)
j
(
m
A
cm
-2 )
R W
Figure 2. Linear polarization curves of the following electrodes: Wiron®88 (W) and Remanium 2000+ (R) electrodes immersed in a not-deoxygenated aqueous solution of artificial saliva, 37 ºC. pH = 7.1. = 1 mV s-1
, 1st cycle.
Table 3. Electrochemical parameters obtained from the polarization curves of Figure 2 recorded at 1 mV s-1.
Alloys E(i=0) Eb j
at +0.5 V V vs. Ag|AgCl (µA cm-2) Wiron®88
(Ni-Cr-Mo)
-0.173 +0.554 19.0
Remanium 2000+ (Co-Cr-Mo-W)
-0.223 +0.564 106.0
Considering the anodic current densities, at the same polarization potential, the resistance against corrosion of the two alloys, from the more to the less resistant is as follows: Wiron®88 → Remanium 2000+, with the Remaniun 2000+ presenting at +0.5 V quite high anodic currents.
3.3 Linear polarization curves at 0.5 mV s-1
Linear polarization curves, recorded at 0.5 mV s-1, for the two alloys immersed in the artificial saliva, pH 7.1, at 37 °C, are given in Fig. 3.
-0.3 -0.2 -0.1 0.0 0.1
-5.0 -2.5 0.0 2.5 5.0
E (V vs Ag/AgCl)
j
(
A
cm
-2 )
R W
Figure 3. Polarization curves of the two nonnoble alloys, in artificial saliva, after 5 minutes immersion. = 0.5 mV s-1. T=37 ºC.
Table 4. Electrochemical corrosion parameters from data of Fig. 3
Alloys Wiron®88 Remanium 2000+
E(j=0) V vs. Ag/AgCl 0.148±0.003 0.198±0.020
Rp (kΏ cm2) 26.2±0.2 22.5±0.6
Considering the Rp and E(j=0) values the corrosion resistance of the alloys from the more to the less resistant is the following: Wiron®88 >Remanium 2000+. When compared with a noble alloy, such as the V-Gnathos® Plus [28] the resistance, Rp, is about 3 times lower, however these materials may
still be considered as highly corrosion resistant. Concerning to the Ni-Cr and Co-Cr based alloys, the
last one is slightly less resistant, but the differences between the two nonnoble alloys, are not of much significance (22 versus 26 kΏ cm2). All the parameters obtained and presented in Table 5 are in agreement leading to the same conclusion.
3.4. Electrochemical Impedance Spectroscopy (EIS)
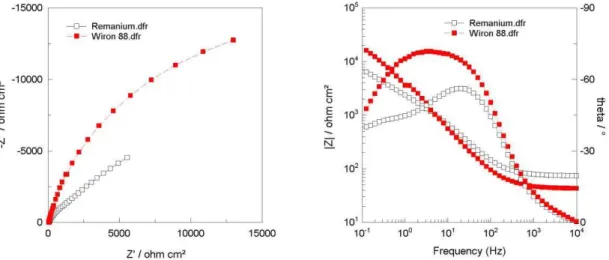
Nyquist plots, obtained from the EIS data, for the alloys in not–deoxygenated solution of artificial saliva, at 37 ºC, are given Fig. 4. The electrochemical impedance data was fitted to the equivalent circuit of Fig. 4b by the use of ZView software. This equivalent circuit accounts for the presence of duplex oxide layer, with an inner barrier film represented by film resistance R2 and film capacitance expressed here by the constant phase element CPE2, whereas the porous outer layer accounts for the presence of a wall capacitance (represented by the constant phase element CPE1) and an additional solution resistance inside the pores, R1. The overall solution resistance is represented by Rs. The fitted values for the different electrical components of equivalent circuit are shown in Table 5.
Rs CPE1
R1 CPE2
R2
Figure 4b Equivalent circuit used in the fitting procedure for both: Wiron®88 and -Remanium 2000+.
Table 5. Fitted parameters for Wiron®88 and Remanium 2000+, using the equivalent circuit of Figure 4b
Rs R1 CPE1 R2 CPE2 χ2 Rp*
Yo n Yo n
(Ω cm2
) (kΩ cm2) (Ω-1 cm-2sn) (kΩ cm2) (Ω-1 cm-2sn) (kΩ cm2)
Wiron®88 43.59 15.611 4.89E-05 0.86 20.274 3.20E-05 0.78 4E-03 35.9
Remanium 2000+
73.8 1.599 3.84E-05 0.85 25.454 15.2E-05 0.57 6E-05 27.1
Assuming that the Rp value corresponds to the real component of the impedance at very low frequencies (Rp*=Rs+R1+R2), then the behavior of the two nonnoble alloys according to the analysis of the EIS data is in agreement with the order given by the analysis of the polarization curves (from the more to the less resistant): Wiron®88 Remanium 2000+. The Rp value obtained for the noble alloy, V-Gnathos®Plus, in our previous study [28] was, as expected, higher (53.62 kΩ cm2). According to Huang [17] the corrosion resistance of the Ni-Cr-Mo alloys is due to the formation of a surface film containing Ni(OH)2, NiO, Cr2O3 and MoO3.
3.4 Galvanic couples
-0.4 -0.3 -0.2 -0.1 0.0 0.1 0.2
-2.5 -2.0 -1.5 -1.0 -0.5 0.0 0.5 1.0 1.5 2.0
W|R
W|VG
log |
j
/
Acm
-2
|
E
/V vs Ag/AgCl
W R VG
Figure 5. log |j/ µA cm-2| vs. E plots for the galvanic couples: Wiron®88| Remanium 2000+ and Wiron®88|V-Gnathos® Plus
Ecouple and jcouple values were determined from the intersection of the anodic section of the material with the lower corrosion potential with the cathodic section of the material with higher corrosion potential, using the mixed potential theory (MPT) (see data in Table 6).
3.4.1. Galvanic cell voltage
Under certain circumstances, the oral cavity can simulate an electrochemical cell with the less noble metal alloy acting as anode and the more noble metal as cathode. Therefore a potential difference of a few or various mV may be established, as well as galvanic currents flowing through the saliva and the metallic contacts.
0 100 200 300 400 500 600
-0.20 -0.15 -0.10 -0.05 0.00
E ce
ll
(V)
t (s)
W|R W|VG
Figure 6. Cell potential, Ecell, vs. time for the galvanic couples: Wiron®88| Remanium 2000+ (W|R) and Wiron®88|V-Gnathos® Plus (W|VG).
The cell potential of the couple Wiron®88|V-Gnathos® Plus, including a noble alloy, varies much more over the 10 minutes period (-200 to -100 mV) when compared with the two nonnoble alloys couple, the Wiron®88| Remanium 2000+ couple, which keeps an almost constant null value (Table 6).
Table 6. Data for the galvanic couples obtained from the analysis of Figs. 5 and 6.
Cell voltage, E (mV)
Ecouple
(V vs. Ag|AgCl)
jcouple
(µA cm-2)
Couples 0 min 10 min MPT
W (+) | VG (-) -206 -104 -0.121 1.13
W (+) | R (-) -17 -18 -0.177 1.03
* in both cases W was connected to the HI connector (+) of the multimeter.
Considering the values of Ecouple, given by the mixed potential theory (MPT), the couple between the two non– noble alloys is more reactive, in spite of its low cell potential.
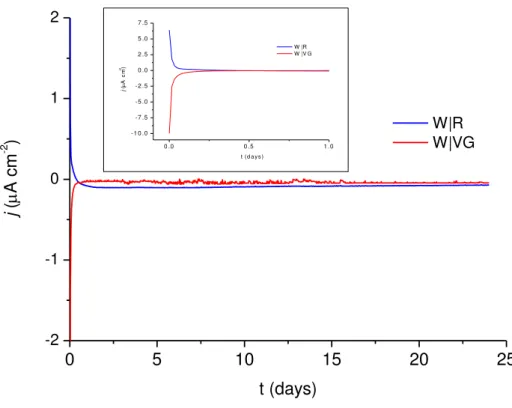
3.4.2 Galvanic current vs. time
0 5 10 15 20 25
-2 -1 0 1 2
0 .0 0 .5 1 .0
-1 0 .0 -7 .5 -5 .0 -2 .5 0 .0 2 .5 5 .0 7 .5
j
(
A
c
m
-2)
t (d a y s ) W |R W |V G
j
(
A
cm
-2 )
t (days)
W|R W|VG
Figure 7. Current vs. time curves, over an immersion period of 24 h, for the Wiron® 88| Remanium 2000+ and Wiron®88|V-Gnathos® Plus galvanic couples
Fig. 7 shows an opposite behavior of the two couples, while the Wiron®88| Remanium 2000+ couple shows an anodic transient, the couple Wiron®88| V-Gnathos® shows a cathodic one, starting with negative currents of the order of 2 A cm-2
and then decaying exponentially, reaching a null value after about 1 hour. It is also to be noticed that the anodic transient, of the couple Wiron®88|Remanium 2000+, decays exponentially to a steady but negative current, during the 24 hours following the first hour of immersion.
3.4. Ions release from the Wiron®88 and Remanium 2000+ alloys
Despite the fact that carcinogenic effects from dental casting alloys have not been demonstrated, the biologic risks shall be considered by prudent dentists selecting alloys that may have the lowest release of toxic elements (lowest corrosion rates).
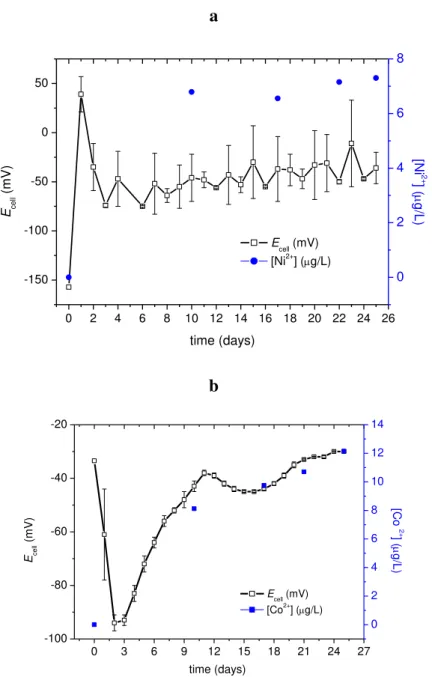
Figure 8 gives the plots of the Ecell as a function of time, during a period of 25 days, for the Wiron®88|Remanium 2000+ and Wiron®88 |V-Gnathos® Plus couples, at 37 °C, in a not-deoxygenated aqueous solution of artificial saliva.
a
0 2 4 6 8 10 12 14 16 18 20 22 24 26 -150 -100 -50 0 50 E
cell (mV)
[Ni2+] (g/L)
time (days) Ecel l ( m V ) 0 2 4 6 8 [N i 2+ ] ( g /L) b
0 3 6 9 12 15 18 21 24 27
-100 -80 -60 -40 -20 E
cell (mV)
[Co2+
] (g/L)
time (days) Ecel l ( m V ) 0 2 4 6 8 10 12 14 [C o 2+ ] ( g /L)
Figure 8. Potential difference between the two electrodes, Ecell and released ions concentration as a function of immersion time: (a) Wiron®88|V-Gnathos® Plus; (b) Wiron®88|Remanium 2000+
g L-1
, after the whole exposure period. Similarly the amount of release of Co2+ ions from the Wiron®88|Remanium 2000+couple, increases all over the immersion time from 6 after 10 days reaching a value of 12.5 g L-1
after 25 days. The measured levels of released Ni2+ is very much lower than the values reported by Reclaru et al.[16] for the Ni-Cr-Mo alloy immersed in 0.1 M lactic acid, which were 414.711±91,000 g L-1. Probably, the acidity of the medium used by Leclaru justifies
the higher levels of released Ni2+. In the present study the amount of nickel released is much
lower than the limits imposed in the EU concerning contact with the skin [33].
The cell potential of both couples varies in a different direction: the one corresponding to Wiron®88|V-Gnathos® Plus shifts from -150 to +40 mV, during the first 12 h, and then decays abruptly. On the other hand, on the couple Wiron®88|Remanium 2000+, the cell potential is displaced in the negative direction reaching a minimum of -95 mV, after 2 days of immersion and then during the next 10 days increases reaching the initial value of -30 mV.
Ciszewski et al. [21], on a study on the corrosion by galvanic coupling between an amalgam (Am) and different chromium-based alloys, namely Remanium GM 380 (64%Co+ 29% Cr+ 4.5% Mo+ Mn, Si and C) and Remanium GS (61% Ni+ 26% Cr+ 5% Mo+, Si and C) have obtained, after 30 days of immersion, 0.75 g g-1 of Co2+ for the GM-380|Am and 0.60 g g-1 Ni2+, for the GS|Am couple. These authors report the metal release processes occurring in the first days of the test (45 days) and then a stabilization. A similar behavior has been observed with the present systems and since pitting has been visualized on the surface of both alloys (see next section) the interpretation of the observed phenomena is in accordance with the generally accepted theory relating the corrosion processes with the formation of galvanic macro-cells [34].
SEM/EDS Studies
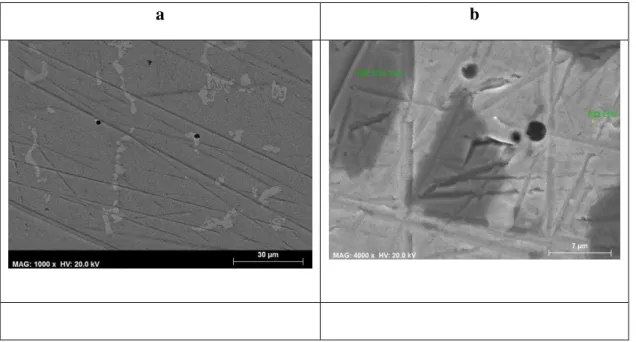
Figure 9 shows a few SEM micrographs of Remanium 2000+ (R) and Wiron®88 (W) alloys surfaces after 25 days of immersion in the artificial saliva solution, at 37 ºC, at short circuit.
c d
Figure 9. SEM images of the following electrode surfaces, after 25 days of immersion in a solution of artificial saliva (a) and (b) Remanium 2000+; (c) and (d) Wiron®88. Magnifcations: 1000x and 4000x.
Pits are very well defined as circular holes with diameters ranging between 2-3 m, on both materials. Cracks, but of different types, are also observed all over both surfaces. Some of them may be related with polishing process (9a and 9b), but others are probably more related with the initial structure or with the characteristics of the oxide films that have been formed after 25 days of immersion.
The EDS of the Remanium 2000+ surface (image 9b) has revealed for the whiter zones the following elemental composition, expressed in normalized weight %: 73.18% Co + 20.12% Cr + 3.32% Mo + 3.38 % W and for the zone of the hole: 50.53%Co + 14.53% Cr + 20.43% Mo + 5.94% Si + 8.50% W. Considering the composition of the original sample, it can be concluded that the depletion in the hole is mainly on cobalt and chromium, thus the corrosion is certainly related with the corrosion of the Remanium alloy. This is confirmed by the amount of Co2+ ions that has been quantified in the immersion solution. Concerning the surface of the Wiron®88 the analysis of the EDS spectrum (Fig. 9d) gives for whiter zone: 62.28% Ni + 27.86% Cr + 7.86% Mo + 1.99% Si and for the zone of the hole: 47.34% Ni+ 17.69 % Cr + 28.93% Mo + 6% Si, which could mean localized depletion of Ni and Cr. However, under the detection limits of the technique used to quantify the cations in the solution, only Ni2+ ions have been identified and quantified, thus the corrosion process, associated to the Wiron®88 alloy, is, most probably, related with the dissolution of Ni and /or nickel oxides previously formed.
4. CONCLUSIONS
Remanium 2000+, respectively. However, the differences are well visible on the linear polarization curves showing much higher anodic charges for Remanium 2000+.
The electrochemical impedance spectra are typical of passive materials with a duplex oxide, consisting of a barrier layer and a porous layer. The results of fitting to an appropriate equivalent circuit are consistent with those obtained from other techniques, indicating that Wiron®88 shows slightly higher corrosion resistance than Remanium 2000+.
SEM images of both alloys, after 25 days immersion in not-deoxygenated artificial saliva solution, at 37 °C, showed pitting and crevice corrosion.
The galvanic cell consisting of two non-noble alloys, such as, Wiron®88|Remanium 2000+ presents very low cell potential (a few mV), while the galvanic cell, between the Wiron®88 and the noble alloy V-Gnathos® Plus, showed a greater cell potential. After 10 minutes the values were -18 and -104 mV, respectively. In both cases the release of cations was detected: Co2+ and Ni2+ for the Wiron®88|Remanium 2000+ and Wiron®88|V-Gnathos® Plus galvanic couples, respectively, with the ionic concentrations, increasing almost exponentially during the 1st week, reaching values of 12.15 for the Co2+ and 7.30 g L-1, for the Ni2+, after the 25 days period of immersion, in the artificial saliva solution, at 37 °C. However, it shall be emphasized, that the concentration of ions delivered into the solution is quite low (levels of ppb).
ACKNOWLEDGMENTS
Fundação para a Ciência e Tecnologia (FCT) is acknowledged for the finantial support to “Centro de Ciências Moleculares e Materiais” (CCMM) (project PEst-OE/QUI/UI0536/2013). S. Capelo acknowledges the University of Évora for her sabbatical leave.
References
1. L. Shi, D.O. Norhwood and Z Cao, J. Mater. Sci. 28 (1993) 1312
2. K. Yoda, Suyalatu, A. Takaichi, N. Nomura, Y. Tsutsumi, H. Doi, S. Kurosu, A. Chiba, Y. Igarashi and T. Hanawa, Acta Biomater. 8 (2012) 2856
3. M. Metikos-Huković, Z. Pilić, R. Babić, D. Omanović, Acta Biomater. 2 (2006) 693 4. M. A. Ameer, E. Khamis, M. Al-Motlaq, Electrochim. Acta 50 (2004)141
5. J. C. Wataha, J Prosthet. Dent. 83 (2000) 223
6. C. Manaranche, H. Hornberger, Dent. Mater. 23 (2007) 1428
7. M. L. Nascimento, W.D. Mueller, A.C. Carvalho, H. Tomás, Dent Mater. 23 (2007) 369 8. M. Metikos-Hukovićand and R. Babić, Corros. Sci. 49 (2007) 3570
9. R. Hsu., Wen-W. Yang, Ching-An Huang, C. Yi-Sui, Mater. Chem. and Ph. 93 (2005) 531 10.E. Khramis and M. Seddik, Int. Dent. J. 45 (1995) 209
11.M.A. Ameer, E. Khamis and M. Al-Motlaq, Corros. Sci. 46 (2004) 2825
12.S. Saji Viswanahan, H–C. Choe, Trans. Nonferrous Met. Soc. China 19 (2009) 785
13.N. A.S. Sampaio, J.W.J. Silva, H.A.A. Acciari, R. Z. Nakazato, E N. Codaro, Mater. Sci. Appl. 1 (2010) 369
14.S. B. Jones, RL. Taylor, J.S. Colligon, J.D. Johnson, Dental Mater. 26 (2010) 249
15.N.A. Sampaio, J.W.J. Silva, H.A. Acciari, E.N. Codaro, Int. J. Eng. and Innov. Tech. 2 (2013) 152 16.L. Reclaru, R.E. Unger, C.J. Kirkpatrick, C. Susz, P.-Y. Eschler, M.-H. Zuercher, I. Antoniac, H.
18.D. Mareci, A. Cailean, G. Ciurescu and D. Sutiman, The Open Corrosion J. 3 (2010) 4 19.H. H. Huang, J. Biomed. Mater. Res. 60 (2002) 458
20.H. Arlsan, H. Çelikkan, N. Örnek, O. Ozan, A. E. Ersoy, M. L. Aksu, J. Appl. Eletrochem. 38 (2008) 853
21.A. Ciszewski, M. Baraniak, M. Urbanek- Brychczynska, Dent Mater. 23 (2007) 1256
22.S. Murat, H. Celikkan, F. Gökmese, S.A. Şimşek, N. S. Altun, M. L. Aksu, J. Appl Electrochem. 39 (2009) 1259
23.S. P. Kedici, M. A. Kíliçarslan G. Bayramoglu and K. Gokdemir, J. Oral Rehabil. 25 (1998) 800 24.S. Virtanen, I. Milosev, E. Gomez-Barrena, R. Trebse, T. Salo and Y. T. Konttinen, Acta Biomater.
4 (2008) 468
25.N. M. Taher, A. S. Jabab, Dent. Mater. 19 (2003) 54
26.F. Nejatidanesh, O. Savabi, A. Yazdanparast, Dental Mater. 2 (2005) 168
27.J. F. López-Alías, J. Martinez-Gomis, J. M. Anglada and M. Peraire, Dental Mater. 22 (2006) 832 28.C. Solá, A. Amorim, Á.Espías, S. Capelo, J. Fernandes,L. Proença, L. Sanchez andI.T.E.
Fonseca, Int. J. Electrochem. Sci. 8 (2013) 406 29.G. Duffó and E. Q. Castillo, Corrosion 60 (2004) 594
30.Macdonald D. Transient techniques in electrochemistry, Plenum Press, New York, 1977 31.I.T.E Fonseca, J.A. Rodrigues, I. Pereira, J.C.S. Salvador, M.G.S Ferreira, Electrochemistry
Communications 4 (2002) 353
32.F. Mansfel, J Solid State Electrochem. 13 (2009) 515 33.J. Eur. Communities L188 (1994) 1
34.M.G. Fontana and N.D. Green. Corrosion Engineering, Mc Graw-Hill, New York, 1967