d
Phyllis Q. Edwards, M.D., M.P.H.2
Places with little tuberculosis face fundamentally different control problems than high-prevalence regions. Therefore, it is vital that control program strategies be geared to the particular epidemiologic situation involved. This point is illustrated with examples drawn from the United States’ campaign against tuberculosis in both epidemic and low-prevalence areas.
Introduction
The goal of tuberculosis control is to free the population from disease and death caused by Mycobacterium tuberculosis. The number of cases and deaths occurring in the community, the number of persons becoming newly in- fected, and the concern of the people or health authorities about the problem’s seriousness may each serve as a starting point in assessing the need for a control program. In any situation, however, control measures are most likely to have the desired effect when they are directed at the basic cause or causes of the problem.
Among the different peoples of the Hemi- sphere there is probably little variation with respect to the etiologic agent of tuberculosis, the reservoir of infection, the mode of transmis- sion, the natural course of infection, or the immunologic response. The epidemiologic details of the picture, on the other hand, may differ widely from one community to another, both in extent and degree. It is these details which define the disease conditions in a particu- lar area at a particular point in time. Viewed broadly, the present situation in each country is characteristic of a stage of tuberculosis control in which the disease is widely epidemic, endemic, focal, or nonexistent. Of course, different epidemiologic situations may be ex-
‘Paper presented at the II PAHO/WHO Regional Seminar on Tuberculosis. Also appearing in Spanish in Boletin de la Oficina Sanitaria Panamericana.
aChief of the Tuberculosis Branch of the Center for Disease Control, United States Public Health Service, Atlanta, Georgia, U.S.A.
petted to exist concurrently within the same country, resembling in this respect the patho- genesis of the disease process in the lungs, where healing and progression may go on simultaneously in the same lesion.
Tuberculosis Dynamics
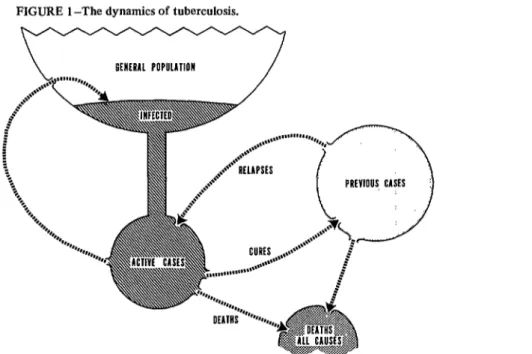
The dynamics of the epidemiologic process are represented schematically in Figure 1. This model is adapted from one developed by Horwitz in Denmark to describe, as he put it, “the life of the disease in the population.“3 Starting with the general population in the upper left part of the diagram, we see that some people have become infected and some have not. This infection with tubercle bacilli is the fist step in the pathogenesis of the disease. Some of the infected people-they are now properly called the reservoir of infection- develop active cases of disease and move into the pool of active cases. These active cases, in turn, spread infection back into the general population and thereby replenish the reservoir of infection. Patients may leave the pool of active disease in one of two ways: they die, or they get well. And, finally, previous cases may relapse and return to the pool of active cases, or they may die. These are, I believe, the essential elements in the life of the disease in a popula- tion.
3Statement by Dr. Ole Horwitz, Director of the Danish Tuberculosis Index, at the Annual Meeting of the American Public Health Association held at Atlantic City, New Jersey (November 1972).
19
20 ENGLISH EDITION-BOLETIN DE LA OSP . Vol. vu, No. 2, x9 73
FIGURE 1 -The dynamics of tuberculosis.
RfHfRAL POPULlTlOn
c
Source: Tuberculosis Branch, Center for Disease Control, 1972.
The situation for any particular place or time can be defined quite well by three time-honored, classic measurements: death rate, case rate, and rate of infection.
Mortality
In the early epidemic stage, when the disease is spreading wildly about the community, deaths may provide the most useful index- perhaps the only index that can be obtained. In such a situation it would probably beimpos- sible to count cases, and the infection rate would be meaningless because virtually every- body except newborns would be infected. An early sign of improvement in such a situation is a falling death rate, as indicated by a decline in adults dying of cavitary pulmonary disease and in children dying of tuberculous meningitis. Mortality from childhood tuberculous menin- gitis is recognized as a sensitive index of the extent of active disease in the adult population, since it is the adult cases which transmit tubercle bacilli to the infants and young chil- dren around them.
Morbidity
Case rates become increasingly meaningful as mortality begins to decline. The prevalence of disease and the incidence of disease describe two aspects of the picture, both becoming more informative as death rates continue to fall. Prevalence refers to the proportion of people
with active disease at any one point in time, 4 and incidence measures the inflow of new cases during the year. Refinements of both these measurements are needed to pinpoint the , sources of new cases. Such refinements include
determining the percentage of “fist-timers”
emerging from the infected pool in the general ‘; population, and the percentage of “repeaters”
or relapses from the pool of previous cases. Finding the demographic characteristics of the cases in these two groups of active cases can also help determine where to look for new cases.
Infection
sensitive index of the declining number of active cases in a population; it also helps locate such cases, since each new infection signals the transmission of tubercle bacilli from somebody with diagnosed or undiagnosed active, sputum- , positive disease. The tuberculin converter-the
person whose tuberculin skin test reaction changes from negative to positive-thus be- * comes a sentinel who points to the focus of
infection in his immediate environment. Briefly, then, tuberculosis dynamics in a d population can be depicted by measuring three classic factors: mortality, morbidity, and rate of infection, each of which best reveals the 7 epidemiologic situation at a different stage of its evolution. Mortality is most useful when the disease is epidemic to the point of being I pandemic, implying total saturation of the population. In this situation the death rate from tuberculous meningitis among infants and r young children is an impressive indicator of the transmission level of tubercle bacilli. Morbidity data, including both incidence and prevalence rates, become increasingly useful as mortality rates decline and begin to recede into the older age groups. Classifying cases by simple demo- graphic characteristics such as age, sex, and race c gives information on the endemic sources of
cases in the population and provides baseline data for surveillance of the speed and magni- tude of changes in disease incidence. Finally, as tuberculosis reaches still lower levels and persists largely in isolated foci among some * segments of the population, each new infection
is an unmistakable signal that tubercle bacilli have passed from an active sputum-positive case in the infected person’s immediate milieu. So :’ long as such transmission continues, it means
tuberculosis still survives.
Trends in Death and Case Rates
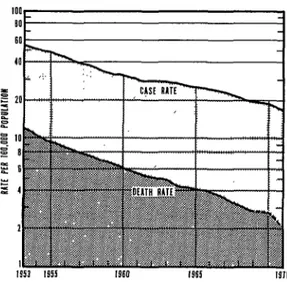
The natural trend in tuberculosis, after 1 reaching epidemic proportions, is one of decline; this stage of declining rates has been reached in most countries of the Americas as well as in most other parts of the world. Figure 2 illustrates the continued downward trends in
FIGURE 2-The tuberculosis case rate and death rate in the United States, 1953-1971.
Source:Tuberculosis Branch, Center for Disease Control, 1972.
the United States during the last 20 years. Note that death rates have been falling more rapidly than cases, as indicated by the divergence of the two curves. Corresponding data for Canada shows a similar divergence, with mortality declining more rapidly than morbidity. In both countries, tuberculosis deaths cluster increas- ingly within older age groups, with fewer deaths occurring each year among infants and children.
Like deaths, tuberculosis cases are also shift- ing into the older age groups as rates continue to fall: more than half the cases in the United States and nearly half of those in Canada are in people over 45 years of age. Another significant change is that adult male cases now outnumber adult female cases by more than two-to-one in both countries.
Pulmonary disease continues to account for about 90 per cent of all new cases, and
22 ENGLISH EDITION-BOLETIN DE LA OSP . Vol. VII, No. 2, I973
Reactivation of previous cases accounts for some 20 per cent of all cases each year, while primary disease now accounts for less than 10 per cent of the total. In this connection it is noteworthy that tuberculous meningitis occurs only rarely now, and that the few cases reported each year develop in adults, largely in elderly patients.
As would be expected, disease prevalence is decreasing along with incidence. Modern medical treatment prevents the accumulation of
“good chronics” we used to see-patients who seemed to have stabilized disease, but whose sputum was still positive and would remain so indefinitely. Most of the surviving patients with chronic disease have now been treated success- fully with multiple drug regimens and can be expected to remain well. Another factor in reducing the prevalence rate is the trend toward shorter courses of treatment and shorter overall follow-up periods after completion of treat- ment, as carefully controlled clinical trials throughout the world lead to improved know- ledge.
Trends in Rates of Infection
As case rates decline, and especially as the sputum-positive cases become fewer, there is a reduction in new infections. A dramatic illustra-
tion of such a decline in infection is shown in Figure 3. This indicates the prevalence of infection-the percentage of tuberculin (Mantoux 5TU) positives-among the five- and six-year-old children of native Alaskan families (mostly Eskimoes) living in the region of Alaska’s Yukon and Kuskokwim rivers.
As of 1949-195 1, practically all children were infected during the first few years of life. The death rate in Alaskan natives was around 6.50 per 100,000 at the time, and the case rate was close to 2,000. The rate of infection must have been about 25 per cent per year. By 1960, the percentage of reactors five to six years of age had dropped to 33, and there were no reactors less than one year of age. In the most recent survey, that of 1969-1970, only 2 per cent of the five- to six-year-old children were tuberculin-positive, and no reactors were less than five years of age. The infection rate has apparently fallen to zero. Among all Alaskan natives throughout the state, there were no deaths from tuberculosis in 1970; just 78 cases (141 per 100,000) were reported, most of them showing evidence of previous disease.
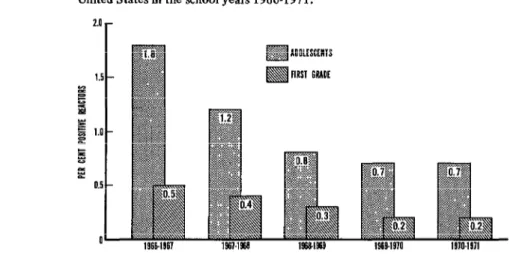
For the United States as a whole, Figure 4 gives data resulting from tuberculin testing of schoolchildren over the last five years. Results are shown for two age groups: five- to six-year- old children starting school, and 13- to 14-
FIGURE 3-Prevalence of tuberculin sensitivity among 5- and &year-old Eskimo children in Alaska.
FIGURE 4-Results of tuberculin testing first and eighth grade children in the United States in the school years 1966-1971.
Source: Tuberculosis Branch, Center for Disease Control, 1972.
year-old adolescents in their eighth school year. (Note the difference between the vertical per- centage scale used in this figure and that in Figure 3.) The higher frequency of tuberculin reactors in adolescents reflects the higher rates of infection prevailing when they started school eight years ago. Among present-day school entrants, the prevalence of infection is now down to 0.2 per cent. This means that the average annual infection rate has now fallen to below 0.03 per cent-that is, less than 3 in 10,000 per year. If this rate applies at all ages, and we believe it does, we can well expect a greater share of new cases to arise among persons already infected sometime in the past. The apparent plateau reached at this low level of infection in young children suggests that an irreducible minimum of positive reactions is resulting from atypical mycobacterial infections and the inherent variability of tuberculin test- ing procedures.
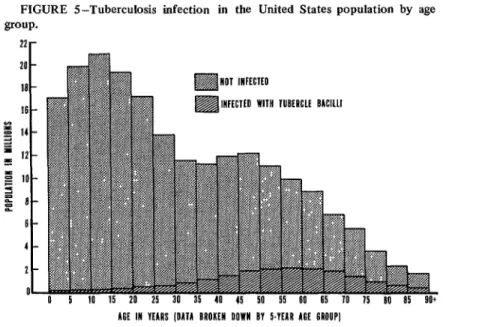
The reservoir of infection in the United States population, and by this is meant the people who today comprise the tuberculin- positive reactors, is estimated at 16 million (8 per cent of the population), distributed by age as shown in Figure 5. Note the increasing proportion of reactors in each sucessive five- year age group. The nearly complete absence of reactors in the first years of life reflects the
very low level to which the infection rate has fallen. The largest absolute number of reactors today is in the 55-59 age group; 70 per cent of all reactors are between 35 and 70 years old; and about 5 per cent are less than 25 years old. The epidemiologic picture of tuberculosis today, in low-prevalence countries of this Hemi- sphere and in other regions as well, is moving from the endemic to the focal stage. The death rate largely reflects deaths with tuberculosis, not from tuberculosis, in older age groups. Nevertheless, deaths from active disease are still being diagnosed postmortem for the first time, attesting to preventable failures in the current control program. The incidence of disease, for both new and relapse cases, continues to decline at about 10 per cent per year in Canada and by 5 per cent in the United States. A
24 ENGLISH EDITION-BOLETIN DE LA OSP . Vol. VII, No. 2, 1973
FIGURE 5--Tuberculosis infection in the United States population by age group.
22r 20 -
ia -
16 -
g 14- Z l Ii?-
g IO- 9 = :: a-
b-
4-
7.-
!I-
AH IN YEARS (DA11 BROKEN DOWN BV 5.VIAR MI GROUP] Source:Tuberculosis Branch, Center for Disease Control, 1972.
Rationale for a National Control Program
The basis for a national control program is
provided by the changing epidemiologic picture of tuberculosis, while the current situation yields the detailed information needed for setting immediate and long-range goals. Right now the tuberculosis problems in Canada and the United States are so similar in most respects that the countries’ control programs are nearly identical. Furthermore, the programs in these two most northern countries of the Hemisphere are not very different from control programs in other northern countries-such as Iceland, the Netherlands, and Denmark-where the tubercu- losis rates are as low or even lower.
Few choices are available in starting a control program during the epidemic stage. Death rates are high, case rates are high, and infection is so widespread that nearly everyone is infected within the first few years of life. Top priority must go to reducing human suffering and death by treating symptomatic cases of active disease and by vaccinating the newborn with BCG to reduce the frequency of hazardous complications of primary tuberculosis, i.e., miliary disease, meningitis, and destructive extrapulmonary lesions.
An Example: The Epidemic in Alaska
The Alaskan story illustrates transformation of the epidemiologic situation from devastating epidemic-perhaps one of the worst tubercu- losis epidemics ever seen-to zero mortality and no new infections. The epidemic had probably reached its peak in Alaska shortly before 1949, when the extent of the problem was docu- mented for the first time.
.
In 1949 a mass BCG vaccination campaign was started in the region of the Yukon and Kuskokwim rivers, and an emergency treatment program began in the early 1950’s when specific chemotherapy first became widely available for treatment of active cases. The BCG vaccination program was then limited and finally stopped in 1954, and the control pro- gram was directed toward intensive case-finding and hospitalization, so as to isolate infectious cases by taking them out of the community.
during that year but also over the next five years. In the first treatment year there were 46 cases among the untreated group compared with 16 among those treated; for the entire six-year period the respective results were 139 versus 58 cases. The study was discontinued in 1964 so that INH could be given to everyone included in the original control group.
Preventive treatment has been a basic part of the continuing control program since that time. In just over 20 years the epidemiologic situa- tion of the Alaskan native population in the Yukon-Kuskokwim rivers area has been trans- formed from an epidemic condition to one of relative control with no evidence of continued transmission of tubercle bacilli. The key to this achievement was efficient case-fmding, effective treatment of active cases, and preventive treat- ment of the population at risk of becoming cases. Thus the program goal can now be to assure that transmission is not allowed to recur in coming years.
Program Objectives
As indicated earlier, changes have come about more slowly in the country as a whole. Nevertheless, low-prevalence countries have reached a stage where continued transmission of tubercle bacilli is becoming more and more limited to small numbers of persons in close and prolonged contact with active cases that are sputum-positive on microscopic examination. The aim of the control program is thus to stop transmission of tube&e bacilli. The two deci- sive elements in the program are:
1) Treatment of patients with active tuber- culosis: they must be found and given prompt, modern, and effective multiple-drug chemo- therapy.
2) Treatment of infected persons: they must be identified and given effective single-drug (INH) preventive treatment to reduce the chance that their dormant infections will ever become active.
This, in effect, means that the program is aimed at the reservoir of infection-people with
active disease who are now transmitters, and the much larger numbers of tuberculin-positive people who are at risk of developing active disease and thus becoming transmitters. Tradi- tional case-finding by mass chest X-ray surveys of the general population and mass tuberculin skin-testing of schoolchildren are no longer productive when 10,000 adults have to be screened to find one or two active cases; or when 10,000 children must be tuberculin-tested to find a few reactors.
Sources of Cases
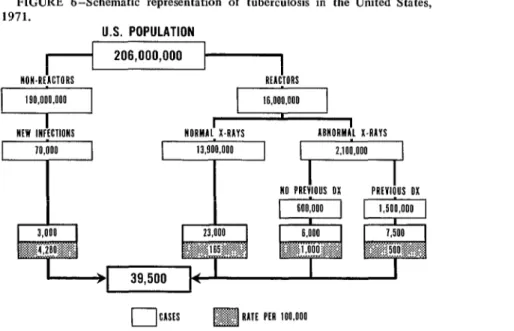
A schematic representation of the present epidemiologic picture in the United States is given in Figure 6. Note that of the total population of 206 million persons, 39,500 active tuberculosis cases developed during 1971. This number includes 32,000 cases not previously reported (new active cases or “first- timers”) plus an estimated 7,500 re-activated cases or “repeaters.”
At the left side of the diagram are the handful of new infections, an estimated 70,000, which occurred during the year among the 190 million previously uninfected persons. These new reactors (known as “converters”) were infected by bacilli transmitted from patients with sputum-positive pulmonary tuberculosis; within the first year of infection they could be expected to produce about 3,000 cases of active disease. However, prompt examination and preventive treatment of contacts likely to be infected could prevent most of these cases. Even though such cases constitute only 8 per cent of the total caseload, contacts are an important target group because they run a high risk of disease, are few in number, and are easily identified and readily available for pre- ventive treatment while the source case is being treated for active disease.
26 ENGLISH EDITION-BOLETIN DE LA OSP . Vol. VU. No. 2, I973
FIGURE 6-Schematic representation of tuberculosis in the United States, FIGURE 6-Schematic representation of tuberculosis in the United States, 1971.
1971.
U.S. POPULATION U.S. POPULATION
I I I I
NON.RtACTORS
NON.RtACTORS RfACTORS REACTORS
16,000.000 16,000.000
I
I
I
NfW INFICTIONS NORMAL X4AYS ABNORMAL X4AYS
I
NO PRIVIOUS OX NO PRIVIOUS OXI
PREVIOUS PRtvlOUS oxI
OX(CASH m RATE pfn ioo.000
Source: Tuberculosis Branch, Center for Disease Control, 1972.
Whether those in the group with abnormal findings had a previous diagnosis of tuberculosis or not, they contributed 34 per cent of all cases. Thus tuberculin-positive people with ab- normal X-rays are priority candidates for either treatment of active disease or preventive treat- ment, whichever is indicated. In fact, as a group they constitute an excellent target for aggres- sive action: a relatively small number of people at high risk who produce a substantial share of all cases. Furthermore, many or even most of these can be identified readily from existing medical records in hospitals, clinics, case regis- ters, health departments, and doctors’ offices throughout the country. The high risk of active disease in people with roentgenographic abnor- malities considered to be “inactive” tubercu- losis, “pulmonary fibrosis,” and so on, is well documented by studies in Canada, the United States, Denmark, and many other countries.
Of the 16 million reactors in the United States, nearly 14 million have normal X-rays; these persons contribute 23,000 new active cases, which amounts to a major part of the total. This group presents the greatest challenge for current control programs because it is so large. There is good reason to believe that the
bulk of those 14 million persons are running a very low or even negligible risk of developing active disease. But they dilute the several small subgroups we think must be hidden among them who are at very high risk of disease; in fact, it is likely that most of the 23,000 cases arising last year among tuberculin-positive persons with a record of normal findings on their last chest X-ray occurred in small, easily identified target groups.
Who are these people? How do they differ from others? Are they “marked” in some way so that they can be easily identified?
Traditional demographic data for reported cases of tuberculosis in the United States depict the “typical” case today as a white male over 45 years of age. To that can be added another simple demographic characteristic that applies in Canada, Denmark, and probably also the United States: that of people who Horwitz has called “the lonely males,” for the divorced, single, or widowed man stands a significantly higher chance of developing active disease than the married man.
Other special segments of the Canadian and U. S. populations are also contributing increas- ing proportions of the active cases. These
- ?
include new immigrants from abroad; native Indian and Eskimo groups; persons seeking medical care for a variety of reasons not related to tuberculosis; and people in other so-called ‘disadvantaged” groups living in poverty, par- ticularly in urban communities. Additional con- ditions reported as being frequently associated with tuberculosis include diabetes, immune deficiency diseases and immunosuppressive heavy drinking, to name a few. There may be many other conditions, and perhaps more frequent ones, which alone or in combination might serve as markers for persons who are very likely to become cases.
A search is therefore now being made for “markers” that can be used to pick out small groups of very high-risk people from among the mass of reactors with normal chest X-rays. For example, among the “lonely” white males over 45 years of age with normal chest films, which ones have some conspicuous medical, social, or other characteristic associated with a high likelihood of developing disease? One of our approaches is to test some signs of conditions mentioned earlier, which are frequently asso- ciated with tuberculosis. Another approach that has also been adopted depends largely on statistical techniques related to epidemiologic models.
Evaluating the Program
Program evaluation has long been neglected, perhaps because the task of treating patients who presented themselves for treatment was the one essential element in the program for so many years. Patients are still self-referred to a large extent, even in low-incidence countries, because they have persistent symptoms of respiratory disease. Close to 80 per cent of the newly diagnosed tuberculosis patients in the United States are symptomatics who come to the physician or other health worker for treat- ment. The majority of these persons have advanced sputum-positive disease, and for some weeks they have been actively transmitting tubercle bacilli to family members and other close associates.
Treatment of Active Cases
Multiple-drug chemotherapy is sure to pro- duce rapid bacteriologic response in most initial treatment patients within a relatively short period of time. Hospitalization is not required; in fact, unless the patient is sick enough to need constant nursing care or has other acute or complex medical problems, he may be treated at home until no longer infectious and then continue his care in an ambulatory treatment center.
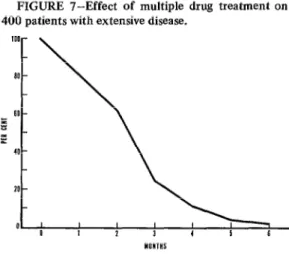
The results of U.S. Public Health Service cooperative clinical trials shown in Figure 7 have amply demonstrated the effectiveness of treatment. At least 75 per cent of initial treatment patients with positive sputum should show an immediate clinical response and be- come sputum-negative within three months; 95 per cent should be sputum-negative within six months. The prescribed course of treatment usually lasts 18-24 months without interrup- tion. After that time, the result of an effective regimen is that the sputum remains negative, the chest X-ray shows stability, and the patient may be considered cured. Relapse is rare in patients who respond to treatment in the expected pattern. Annual check-ups are there- fore not needed; in fact, the cured patient can be dismissed and advised to return only if he
FIGURE 7-Effect of multiple drug treatment on 400 patients with extensive disease.
Source: Tuberculosis Branch, Center for Disease Control, 1972.
28 ENGLISH EDITION-BOLETIN DE LA OSP . Vol. VII. No. 2, I973
should ever again develop symptoms of respira- tory disease.
Evaluation of the treatment program is based on knowledge of the effectiveness of present-day chemotherapy, and of the guide- posts that measure effectiveness at intervals during the course of treatment. How many sputum-positive patients who started treatment in the month of January, for example, have become sputum-negative within three months? If less than 75 per cent have done so, what is the problem? The most likely cause should be searched out and attacked, for clearly there is something wrong with the treatment program if patients are not responding as expected.
How many of the new cohort starting treatment next month become sputum-negative within three months? The expected improve- ment can be checked immediately, not months or years later, and the program can be con- tinually changed or modified until the expected results are achieved and maintained. Similarly, have 95 per cent of the initially sputum-positive patients become negative, as expected, by the end of the sixth month? If not, why not? How many of the January cohort are still coming in for treatment at the end of the year? How many complete the full course of prescribed treatment without interruption?
Relapses, development of bacterial resistance to one or more drugs, the appearance of positive sputum after a period of negativity- these are all treatment failures. They are all preventable. Prompt remedial action should be taken at the first sign of trouble. Concurrent evaluation, as described, has thus become a vital part of the treatment program. Our task is to know when difficulties occur, fiid out what went wrong, and find a way to correct the situation. This is not always simple or easy, because there are many complex causes to deal with, but it is nevertheless an important part of our job.
We need conveniently located treatment facilities, at minimum cost to the taxpayer, where services can be tailored to fit the patient’s needs. More and more we are coming to recognize the need for flexibility in atti-
tudes, in traditional values, in provision of health services. Tuberculosis is rio exception. If we expect people to take medicine for an acute communicable disease that responds rapidly to treatment but heals slowly, our health care delivery system must adapt to modern socio- logic facts of life. We must learn to do things with people, not for them.
Preventive Treatment of People at Risk
Cooperative studies by our Public Health Service research group have also laid the groundwork for effective preventive treatment with a series of double-blind controlled trials which began in 1955. Isoniazid (INH) is very effective in reducing the chances of disease in the newly infected as well as those infected long ago, in children as well as adults; in men and women; in white and black; and in Eskimo, Chicano, and Puerto Rican. For every group studied, whether at high risk or low, isoniazid has reduced the chances of disease during the medication year and for the duration of the follow-up, which now extends through the tenth year.
An example, shown in Figure 8, has been drawn from a trial using the household contacts of new active cases reported to health depart-
o I ; I 2 ” 3 4 ” 5 6 ” I 8 1” 9 IO’ OBSERYAllOH KAR
Source: Tuberculosis Branch, Center for Disease
ments. Altogether some 28,000 persons were Further, INH may be even more effective admitted to the trial between 1956 and 1959. than it appears; results approaching 90 per cent
Each person was assigned at random to take effectiveness have been found among those who either INH (300 mgm) or a placebo once daily took at least 40 per cent of the isoniazid for a year. Cases of tuberculosis among the recommended for one year. Studies are now study population that were diagnosed during underway to evaluate treatment for periods and after the treatment year are compared for shorter than the standard duration of one year. the two groups in Figure 8. The results clearly We have no results as yet. But we are com- show that the INH treatment had a significant mitted to doing the best we can with what we effect for the duration of the observation know today-and to changing our techniques as
period. better ones are developed and tested.
SUMMARY A special sort of tuberculosis epidemiology exists ir, low-prevalence countries, where the disease incidence is low and falling and the infection rate is correspondingly low. As a consequence of these circumstances, most new cases arise among the reservoir of already infected people which, in the United States for
example, constitutes about 8 per cent of the total population. Within that group, small target groups can be identified which contrib- ute about 40 per cent of the total caseload. The remaining 60 per cent of the cases come from
vast numbers of persons with relatively low risk of disease.
Confronted with this situation, traditional
case-finding methods using mass chest X-ray
surveys and tuberculin skin-testing programs are generally unproductive. Thus, as tuberculosis
becomes increasingly clustered in identifiable
segments of the population and in scattered sporadic foci, the control program, like that for any other communicable disease, must become geared to stopping the transmission of infec- tion. To do this means (1) locating all cases of disease for prompt, effective treatment aimed at preventing infectiousness and achieving long-
range cure, and (2) blocking the development of new cases of disease by preventive treatment of all persons at risk.
BIBLIOGRAPHY
(I) Comstock, G. W., S.H. Ferebee, and L. M. Hammes. “A Controlled Trial of Community- Wide Isoniazid Prophylaxis in Alaska.” Am Rev Resp Dis 95: 935-943, 1961.
(2) Comstock, G. W., and R. N. Philip. “Decline of the Tuberculosis Epidemic in Alaska.” Public Health Reu 76: 19-24. 1961.
(3) Ferebee, S. ‘H. “Con&led Chemoprophylaxis Trials in Tuberculosis:A General Review.“Bibl Tuberc 26: 2%106,197O.
(4) Grzybowski, S., H. Fishaut, J. Rowe, and A. Brown. “Tuberculosis among Patients with Various Radiologic Abnormalities, Followed by the Chest Clinic Service. Am Rev Resp Dis 104: 605-608,197l.
(3) Horwitz, 0. “Tuberculosis Risk and Marital Status.” Am Rev Resp Dis 104: 22-31, 1971. (6) Horwitz, O., P. Edwards, and H. Lowell.
“National Tuberculosis Control Programs in Denmark and in the United States.” Health Services Reports (In press).
(7) Horwitz, O., E. WIlbek, and P. A. Erickson. “Epidemiological Basis of Tuberculosis Eradi- cation: 10. Longitudinal Studies on tie Risk of Tuberculosis in the General Population of a Low-Prevalence Area.” Bull WHO 41: 95-113,
1969.
(8) Kaplan, G. J., R.I. Fraser, and G.W. Comstock. “Tuberculosis in Alaska, 1970: The Continued Decline of the Tuberculosis Epidemic.” Am Rev Resp Dis 105: 920-926, 1912.
(9) Pio, A., and S. Ferebee. “Las investigaciones sobre profilaxis de la tuberculosis con iso- niacida. Servicio de Salud Pbblica de 10s Estados Unidos.” El T&ax (Montevideo) 19: S-26, 1970.
(IO) Comstock, Cr., and S.F. Woolpert. “Preventive Treatment of Untreated, Nonactive Tubercu- losis in an Eskimo Population.” Arch Environ Health 25: 333-337, 1972.
30 ENGLISH EDITION-BOLETIN DE LA OSP . Vol. VII, No. 2, 1973
Trend in a Human Population.” Bull Int Un Tuberc 42: l-140, 1969.
(12) Dominion Bureau of Statistics. Tuberczdosis S&z- tistics, Volume I: Tuberculosis Morbidity and Mortality, 1970. Ministry of Industry, Trade, and Commerce; Ottawa, Canada, 1971, 104
(13) Ca%lian Tuberculosis and Respiratory Disease Association. Canadian Tuberculosis Standards: For Use in General and Special Hospitals;
Reports from the Standards Committee, 1972. Ottawa, Canada, 1972,65 pp.
(14) U.S. Department of Health, Education and Welfare/Public Health Service. 1971 Tubercu- losis Statistics: States and Cities. DHEW Publi- cation No. (HSM) 73-8171, 1972.