-y t '
i
II
I
le
d
o~
,
'A A
¡
A A A~~~~~~~~~~~~~~~~~~~~~~~~~~~~~~~~~~~~~~~~~Tuberculosis in the
PART I: EPIDEMIOLOGY
The objectives of the tuberculosis control program in
the Americas
]are: to reduce morbidity and mortality
through BCG vaccination and the detection and
treat-ment of cases by the general health services.
BCG vaccination reduces by 80 per cent the vaccinees'
risk of contracting the disease. Since it is basically
ap-plied to infants under one year of age for the purpose of
preventing tuberculous meningitis and other serious (but
non-contagious) forms of infant tuberculosis, it has very
*O
little effect on the chain of transmission of the disease
and on the incidence and general mortality due to
tuber-culosis. Diagnosis and treatment, especially of active
cases (which are the sources of infection), are the
princi-pal control methods.. The recommended strategy is the
detection of active cases through the systematic
examina-tion of the sputum of adults with symptoms who present
themselves to the general health services for any reason
and their out-patient treatment under the supervision of
the general health service nearest their home.
'The policies and strategies for tuberculosis control in the Region of the Americas were set forth in the Ten-Year Health Platn for the Americas 1971-1980 (PAHO Official Document 118, 1973) and are
described in the Ninth Report of the WHO Expert Committee on
Tuberculosis (Technical Report Series 552, 1974) and in the Manual de nlormas y procedinientos para programas integrados de control de tuberculosis (Scientific Publication 376, 1979).
Because of operating difficulties, chemotherapy is
reserved for special cases such as contacts of active cases
or recently infected persons, and is not a practical
con-trol measure in most countries, especially those that
undertake BCG vaccination activities.
It has been estimated that the maximum impact that
could be obtained would be an annual 14 per cent
reduc-tion in the problem-as has been achieved in some
Euro-pean countries-through the use of BCG vaccination (1
per cent), diagnosis and treatment (8 per cent) and
im-provement in economic and social conditions in general
(5 per cent). However, in the Americas a 10 per cent
an-nual reduction is believed to be the optimum possible
and has already been achieved in some countries and
areas where sound programs have been conducted on a
sustained basis.
The epidemiological status of tuberculosis in the
Region, as well as the trends of the disease, as shown by
such indicators as mortality, morbidity, and annual risk
of infection, is reviewed below.
Mortality
Data on tuberculosis mortality since the beginning of
the century are available in a number of countries and
IN
THIS ISSUE
. . .
* Tuberculosis in the Americas
Acute Hemorrhagic Conjunctivitis Epidemic
· Diseases Subject to the International Health Regulations
*
Foodborne Disease Surveillance in the United States
*
Efficacy of Human Diploid Cell Vaccine in Anti-RabiesTreatments in Ontario, Canada
· Leprosy in Mexico
· Rapid Tests for the Diagnosis of Acute Bacterial Respiratory Diseases
* Risk Approach in the Extension of Health Service Coverage · Reports of Meetings and Courses
Figure 1. Tuberculosis mortality rates per 100,000 population in selected countries of the
Americas since 1900.
.City of RIO DE JANEIRO (BRAZIL)
1900 1905 1910 1915 1920 1925 1930 1935 1940 1945 1950 1955 1960 1965 1970 1975 19)0
reflect a decline in the absence of specific control
mea-sures (Figure 1). Between 1945 and 1955 the introduction
of drugs into tuberculosis treatment produced a sharp
fall in mortality. In some Latin American countries, the
death rate was stabilized for several years, possibly
be-cause of late deaths of chronic patients that had been
in-correctly treated. In the past decade, the downward trend
has been more marked than in the prechemotherapy era
and probably reflects the impact of control programs.
However, an analysis of the information available for a
group of Latin American countries (Table 1) shows a very
moderate downward trend (5 per cent annually) in
mor-tality, which is probably due to the fact that in those
countries the problem is more serious, the program less
developed, and financial resources limited. Table 2
pre-sents the deaths reported by the countries in the last year
for which statistics are available. In some countries such
as Bolivia, Brazil, Haiti, Paraguay, and Peru, the use of
death certificates is limited and in most of them a
sub-stantial proportion of deaths are not medically certified
so the data are of limited value.
On the basis of the incomplete information available,
it is estimated that in the Region there are about 45,000
deaths from tuberculosis every year (or 7.5 per 100,000
population).
The goal of the Ten-Year Health Plan for the
Ameri-cas (1971-1980) was to reduce tuberculosis mortality by
between 50 and 65 per cent, which implied an annual
reduction of 7 to 10 per cent; the data available show that
most of the countries did not achieve that goal.
Morbidity
Tuberculosis morbidity can be determined only on the
basis of the reported incidence. Disease prevalence studies
are too. expensive and are not justified. Furthermore, the
prevalence of patients under treatment varies according
to the duration of the treatment and the updating of the
registers; in addition, it is of little use as an
epidemio-logical indicator since those patients do not represent
sources of infection.
The recording of incidence on the basis of reports
im-proves as the program increases its coverage and
organi-zation. During this process, which is underway in many
countries, the reported cases increase every year until a
level close to the real incidence that can be diagnosed
with the medical resources available is reached.
Further-more, changes in the resources or the intensity of case
detection can temporarily change the observed incidence
400 300
I00
90 70)
z
2 4(
2 3C
20
i 61 5
3
2
e
1 .. . . . 1 .. . 1 . . 1 1 --- 1 .. 1 .1 1 .
. . . .
. . . 1 .. . . .. . . .
Table 1. Tuberculosis mortality rates per 100,000 population in countries of the Americas, 1970-1979.
Country 1970 1971 1972 1973 1974 1975 1976 1977 1978 1979
Argentinaa 12.1- -10.2- -- 9.3 8.4-- -6.7 6.2
Canada 2.5 2.1 2.1 1.8 1.5 1.2 ... 1.1 0.9
Chile 27.4 23.8 24.6 20.7 19.4 18.8 19.1 18.2 15.8 15.1
Colombia 12.8 ... 13.8 13.4 13.3 11.7 10.7 10.0
Costa Rica 7.1 6.2 7.2 4.7 4.4 5.1 5.2 4.2 3.9 4.2
Cuba ... 5.3 4.6 4.3 3.5 2.6 3.0 2.4 2.4 ...
Dominican Republic 6.6 5.7 6.1 7.0 6.7 6.2 6.7 6.2 8.1 ...
Ecuador 18.3 18.2 18.8 18.0 18.3 ... 17.9 16.7 ... ...
El Salvador 11.2 11.1 10.2 9.3 9.2 ... 6.7 ... ... 5.2
Guatemala 20.9 20.1 ... ... ... 18.3 15.4 12.2 13.9 ...
Honduras 5.0 6.4 5.7 7.2 6.0 3.9 3.4 5.1 ...
Mexico 19.2 17.3 16.7 15.8 14.8 14.2 13.2 ... ...
Nicaragua ... ... 2.3 3.0 2.1 2.6 3.5 1.8 1.1
Panama 19.4 16.2 16.1 13.7 13.1 ... ... 10.8 8.4
Paraguay 23.0 24.1 22.5 22.4 19.6 19.7 16.9 13.6 14.3
Peru 37.8 32.5 30.3 31.5 ... ... 28.2 22.5
United States of America 2.6 2.2 2.1 1.8 1.7 1.6 1.5 1.4 1.3
Uruguay 7.5 8.1 7.3 6.3 7.8 6.3 5.7 6.0 5.1
Venezuela 11.3 10.0 8.7 9.1 8.2 7.8 7.5 7.4 6.4
aBiennial analysis, National Tuberculosis Institute, Argentina. ... Data not available.
although over extended periods the trend (especially in the youngest groups) is a useful indicator.
The discrepancy between the real trend and case reporting is obvious in a number of countries. In Brazil, for example, 47,797 cases were reported in 1979, whereas 56,484, 64,734, and 72,608 were reported in subsequent years because of better record keeping. The morbidity rate rose from 42.6 to 60.0 per 100,000 population in these years, but in the same period mortality fell without any fundamental changes having taken place in treat-ment. The incidence in the states in which coverage and notification are adequate was reduced or remained stable. In other countries notification coverage is low and they have not yet reached the stage of extension. In Mexico, for example, up to 1978 the record keeping system in-cluded reports only of bacteriologically confirmed pul-monary cases registered by the official services of the Ministry of Health and Welfare, which represent less than half the patients detected and treated in the country.
An analysis of the reported trend in North America shows that the total incidence of cases fell by about 6 per cent annually up to 1978. Since then it has stabilized in the United States of America, probably because of immi-gration from countries in which there is a higher risk and prevalence of infection (Figure 2). In Latin America there has been a slow decrease in most of the countries, probably from 3 to 5 per cent annually (Figures 2 and 3). Taking into account the larger natural growth and the smaller proportion of adults with old infections, the ef-fect of control measures should be more rapid in the
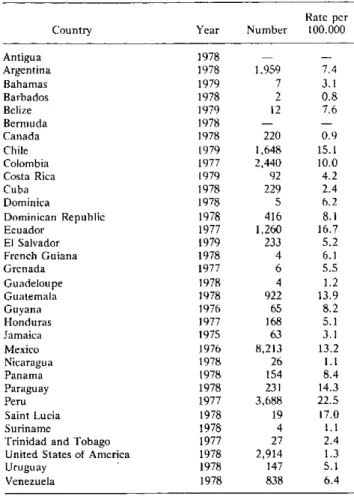
de-Table 2. Deaths from tuberculosis in countries of the Americas, last year available.
Rate per
Country Year Number 100.000
Antigua 1978 -
-Argentina 1978 1,959 7.4
Bahamas 1979 7 3.1
Barbados 1978 2 0.8
Belize 1979 12 7.6
Bermuda 1978
Canada 1978 220 0.9
Chile 1979 1,648 15.1
Colombia 1977 2,440 10.0
Costa Rica 1979 92 4.2
Cuba 1978 229 2.4
Dominica 1978 5 6.2
Dominican Republic 1978 416 8.1
Ecuador 1977 1,260 16.7
El Salvador 1979 233 5.2
French Guiana 1978 4 6.1
Grenada 1977 6 5.5
Guadeloupe 1978 4 1.2
Guatemala 1978 922 13.9
Guyana 1976 65 8.2
Honduras 1977 168 5.1
Jamaica 1975 63 3.1
Mexico 1976 8,213 13.2
Nicaragua 1978 26 1.1
Panama 1978 154 8.4
Paraguay 1978 231 14.3
Peru 1977 3,688 22.5
Saint Lucia 1978 19 17.0
Suriname 1978 4 1.1
Trinidad and Tobago 1977 27 2.4
United States of America 1978 2,914 1.3
Uruguay 1978 147 5.1
Figure 2. Morbidity rates from tuberculosis as notified in se-lected countries in North and Middle America, 1970-1980, and curve showing a tendency of 5 per cent annual reduction.
150
z
o
o o
o
Figure 3. Morbidity rates from tuberculosis as notified by se-lected countries in South America, and curve showing a ten-dency of 5 per cent annual reduction.
400
300
200
-z
o
o
2
C>
BOLIVIA d
00oo
so
60
50
40
-30 1
20
1970 71 72 73 74 75 76 77 78 79 1980
.
Figure 4. Number and percentage of new cases of tuberculosis by age group and site: pulmonary (PT), pulmonary with positive bacilloscopy (P+), and extrapulmonary (EP), in Middle and South America, 1979-1980.
NUMBER AND PERCENTAGE OF NEW CASES
PT (118,412 CASES)
0.6 3.4 P+ (74,537 CASES)
0 l0 20 30 40 50 60 70 80 90 I00
'16.8.,1 5 22.2 '''> :*:*:*:: Mi i35.6 llllll 22.2 8.í
...
1111111
23s,_ 8 ...
1111111...
_....23.8
.
39 23.8;
.-EP (11,212 CAS
*0-4
ES)
RE 5-14
15-24
25-44 jl45-64 u165+ YEARS.
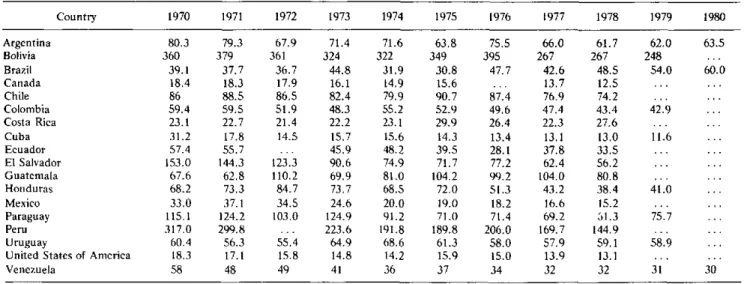
Table 3. Tuberculosis morbidity rates in countries of the Americas, 1970-1979.
Country 1970 1971 1972 1973 1974 1975 1976 1977 1978 1979 1980
Argentina 80.3 79.3 67.9 71.4 71.6 63.8 75.5 66.0 61.7 62.0 63.5
Bolivia 360 379 361 324 322 349 395 267 267 248 ...
Brazil 39.1 37.7 36.7 44.8 31.9 30.8 47.7 42.6 48.5 54.0 60.0
Canada 18.4 18.3 17.9 16.1 14.9 15.6 ... 13.7 12.5 ... ...
Chile 86 88.5 86.5 82.4 79.9 90.7 87.4 76.9 74.2 ...
Colombia 59.4 59.5 51.9 48.3 55.2 52.9 49.6 47.4 43.4 42.9 ...
Costa Rica 23.1 22.7 21.4 22.2 23.1 29.9 26.4 22.3 27.6 ... ..
Cuba 31.2 17.8 14.5 15.7 15.6 14.3 13.4 13.1 13.0 11.6 ..
Ecuador 57.4 55.7 ... 45.9 48.2 39.5 28.1 37.8 33.5 ... ..
El Salvador 153.0 144.3 123.3 90.6 74.9 71.7 77.2 62.4 56.2 ... ..
Guatemala 67.6 62.8 110.2 69.9 81.0 104.2 99.2 104.0 80.8 ... ...
Honduras 68.2 73.3 84.7 73.7 68.5 72.0 51.3 43.2 38.4 41.0 ..
Mexico 33.0 37.1 34.5 24.6 20.0 19.0 18.2 16.6 15.2 ..
Paraguay 115.1 124.2 103.0 124.9 91.2 71.0 71.4 69.2 61.3 75.7 ..
Peru 317.0 299.8 ... 223.6 191.8 189.8 206.0 169.7 144.9 ..
Uruguay 60.4 56.3 55.4 64.9 68.6 61.3 58.0 57.9 59.1 58.9 ..
United States of America 18.3 17.1 15.8 14.8 14.2 15.9 15.0 13.9 13.1 ... ..
Venezuela 58 48 49 41 36 37 34 32 32 31 30
... Data not available.
veloping countries than in the developed countries. How-ever, there are a number of factors that mask or limit that effect on incidence. First, there is the expansion of the coverage of health services, the greater demand for services by the population, the integration of case detec-tion activities and of resources for the diagnosis of infant and extra-pulmonary forms of the disease, and the gradual improvement in the reporting, registration, and epidemiological surveillance systems. Among the factors that limit the effect of control measures are the socio-economic conditions of the population and the limited accessibility, scarce resources, and inadequate organiza-tion of the health services.
It is estimated that about 250,000 new cases are diag-nosed in the Region each year: 12 per cent of them in North America (with a rate of 13.0 per 100,000 popula-tion) and 88 per cent in Middle America and South America (with a rate of 67.0 per 100,000 population). The ratio between reported incidence and tuberculosis mortality is 10 to 1 in North America and 5 to 1 in the rest of the Region, probably because of lower levels of case detection and registration and a higher case fatality rate among the detected cases in less developed countries. Figures 4 and 5 present information for South Amer-ica and Middle AmerAmer-ica on notifAmer-ications by age group and site (pulmonary-extrapulmonary), and according to method of diagnosis. The percentages depend on the age composition of the population, the ability to diagnose ex-trapulmonary and infant forms of the disease (radiologi-cal resources, pediatric clinic, chemi(radiologi-cal laboratory, cul-ture methods, pathological anatomy examinations), the compulsory reporting of these forms and its enforcement, and the activity and coverage of the program as regards
the detection of pulmonary cases by bacilloscopy. Table 3 shows the reported morbidity rates in the countries of
the Americas between 1970 and 1980.
In the United States the proportion of cases is lower among young persons (12.6 in persons under age 25) and higher among persons over 65 years of age (28.6 in 1978). As for the diagnostic method, 80.6 per cent of the pulmo-nary cases proved to be positive on bacteriological exami-nation, 12.4 per cent negative, and for 7 per cent no in-formation was available.
Reliable information is, unfortunately, not available in the Region on cases of tuberculous meningitis in chil-dren, which is a good epidemiological indicator as well as an indicator of the impact of BCG vaccination.
Figure 5. Percentage of new cases of pulmnionary tuberculosis according to the diagnostic method in Middle and South America, 1979-1980.
PERCENTAGE OF NEW CASES
0 lo 20 30 40 50 60 70 80 90 100
1
1 1 1 1 1 l l1
16
M RBACILLOSCOPY (+)
-
CULIURE (+)[=mnm NEGATIVE EXAMINATIONS
EXAMINATIONS NO1
M~~ NOCARRIED OliT
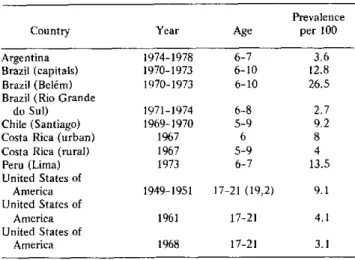
Table 4. Prevalence of reactions of 10 mm and more to the tuberculin test in countries of the Americas.
Prevalence Country Year Age per 100 Argentina 1974-1978 6-7 3.6 Brazil (capitals) 1970-1973 6-10 12.8 Brazil (Belém) 1970-1973 6-10 26.5 Brazil (Rio Grande
do Sul) 1971-1974 6-8 2.7 Chile (Santiago) 1969-1970 5-9 9.2 Costa Rica (urban) 1967 6 8 Costa Rica (rural) 1967 5-9 4 Peru (Lima) 1973 6-7 13.5 United States of
America 1949-1951 17-21 (19,2) 9.1 United States of
America 1961 17-21 4.1 United States of
America 1968 17-21 3.1
Annual Risk of Infection
Little information is available about the risk and alence of the disease at the regional level. Although prev-alence studies are common, the groups studied are usu-ally not representative of the population at large. BCG vaccination and internal migration also interfere with the conduct and comparability of prevalence studies that are carried out at an interval of several years and are neces-sary for estimating the risk of infection and its trend.
Table 4 presents the information available on the prev-alence of reactions of 10 mm or more to the tuberculin test in certain countries for which data are available. In none of them was information on the trend of the risk ob-tained. However, estimates based on prevalence of infec-tion data that reflect a 3 to 5 per cent annual reducinfec-tion would indicate for 1980 annual risks of less than 0.5 per cent in Argentina, 0.9 per cent in Brazil, 2 per cent in Peru, and 0.1 per cent in the United States.
If the population samples included in the tuberculin studies are representative and the trends are sustained, these estimates should be correlated with the incidence of new cases since there are approximately 50-60 active cases per 100,000 population for every 1 per cent of risk of infection.
Conclusions
The problem of tuberculosis is slowly but gradually declining in the Americas, with mortality falling some-what more rapidly than the annual risk of infection and incidence.
Given the present trend (5 per cent annual reduction) and the expected increase in the population, it is esti-mated that there will be more than 150,000 new cases a year by the end of the century. The aggregate number of cases expected in the next 20 years is more than 2 mil-lion.
Since the simple technical resources for prevention, diagnosis, and treatment are available, tuberculosis con-trol should be included among the priority activities of the short- and medium-term health plans of the coun-tries.
The next issue of the Epidemiological Bulletin will contain Part II of this report and deal with the present status of tuberculosis control programs in the Americas.
(Source: Tuberculosis Control Program, Communicable Disease Unit, Division of Disease Prevention and Control, PAHO.)