Association between the
IL1B (-511)
,
IL1B (
+
3954)
,
IL1RN
(VNTR)
Polymorphisms and Graves’ Disease Risk: A
Meta-Analysis of 11 Case-Control Studies
Min-Li Chen1, Ning Liao1, Hua Zhao1, Jian Huang2, Zheng-Fu Xie1*
1Department of Geriatrics and Gerontology, First Affiliated Hospital, Guangxi Medical University, Nanning, China,2Department of Clinical Medicine, Grade 2001, Guangxi Medical University, Nanning, China
Abstract
Background:Data on the association between the interleukin-1 (IL-1) gene polymorphisms and Graves’ disease (GD) risk were conflicting. A meta-analysis was undertaken to assess this association.
Methods:We searched for case-control studies investigating the association between theIL1B(-511),IL1B(+3954),IL1RN (VNTR)polymorphisms and GD risk. We extracted data using standardized forms and calculated odds ratios (OR) with 95% confidence intervals (CI).
Results:A total of 11 case-control studies were included in this meta-analysis. Available data indicated that theIL1B(-511) polymorphism was associated with GD risk in the overall populations (Caucasians and Asians) in homozygote model (TT vs. CC, OR = 0.86, 95% CI: 0.76–0.97,Pz= 0.015), but not in dominant and recessive models (TT+TC vs. CC: OR = 0.95, 95% CI: 0.81–1.12,Pz= 0.553 and TT vs. TC+CC: OR = 0.82, 95% CI: 0.60–1.12,Pz= 0.205, respectively). No association between the IL1B(+3954),IL1RN (VNTR)polymorphisms and GD risk was found in the overall populations in any of the genetic models. In subgroup analyses according to ethnicity, theIL1B(-511) polymorphism was associated with GD risk in Asians in recessive and homozygote models (TT vs. TC+CC: OR = 0.68, 95% CI: 0.55–0.84,Pz,0.001 and TT vs. CC: OR = 0.81, 95% CI: 0.70–0.93, Pz= 0.003, respectively), but not in dominant model (TT+TC vs. CC: OR = 0.92, 95% CI: 0.77–1.11,Pz= 0.389). No association between theIL1B(+3954),IL1RN (VNTR)polymorphisms and GD risk was indicated in Asians, and we found no association between theIL1B(-511),IL1B(+3954),IL1RN (VNTR)polymorphisms and GD risk in Caucasians in any of the genetic models.
Conclusion:TheIL1B(-511) polymorphism, but not theIL1B(+3954) andIL1RN (VNTR)polymorphisms was associated with GD risk in Asians. There was no association between these polymorphisms and GD risk in Caucasians.
Citation:Chen M-L, Liao N, Zhao H, Huang J, Xie Z-F (2014) Association between theIL1B (-511),IL1B (+3954),IL1RN (VNTR)Polymorphisms and Graves’ Disease Risk: A Meta-Analysis of 11 Case-Control Studies. PLoS ONE 9(1): e86077. doi:10.1371/journal.pone.0086077
Editor:Paula Soares, IPATIMUP/Faculty of Medicine of the University of Porto, Portugal ReceivedAugust 4, 2013;AcceptedDecember 4, 2013;PublishedJanuary 21, 2014
Copyright:ß2014 Chen et al. This is an open-access article distributed under the terms of the Creative Commons Attribution License, which permits unrestricted use, distribution, and reproduction in any medium, provided the original author and source are credited.
Funding:The authors have no support or funding to report.
Competing Interests:The authors have declared that no competing interests exist. * E-mail: [email protected]
Introduction
Graves’ disease (GD) is an autoimmune thyroid disorder characterized by hyperthyroidism. It is commonly seen in young and middle-aged people, affecting 0.5–1.0% of the general population [1]. In GD, circulating autoantibodies are produced, which target well-defined thyroidal antigens, such as thyroid peroxidase, thyroglobulin, and the thyroid-stimulating hormone receptor (TSHR) [2]. Stimulatory autoantibodies binding to TSHR on thyroid follicular cells induce over-synthesis of the thyroid hormones thyroxine (T4) and triiodothyronine (T3). The systematic effects of elevated T3/T4 manifests as a sped up metabolism and its correlated symptoms. In addition to hyper-thyroidism, some patients with GD have clinical involvement of the eyes resulting in Graves’ Ophthalmopathy (GO) and the skin resulting in localized myxoedema [3,4].
The etiology of GD remains unknown; however, it is considered to be caused by an interplay between genetic and environmental factors [5,6]. In common with other autoimmune diseases, GD has
a complex genetic basis, with numerous different genes each contributing in various degrees to the inherited susceptibility. Using both the candidate gene approach and whole genome linkage studies, some major susceptibility genes to GD have been identified, including human leukocyte antigen (HLA) on chromo-some 6p21,Cytotoxic T-Lymphocyte Antigen (CTLA) -4 on chromo-some 2q33 andlymphoid tyrosine phosphatase (LYP)on chromosome 1p13 [7–10]. Besides these, it is believed that additional genes contribute to the genetic susceptibility to GD, as well as to its different phenotypes. Much interest has currently centered around the exploration of additional susceptibility genes to GD, which may help elucidate signaling pathways involved in the pathogen-esis of GD, and help develop novel therapeutic strategies for the disease.
2q13-14, which are candidate genes for GD. There are several common polymorphisms that have been most frequently investi-gated. TheIL1B gene has two single nucleotide polymorphisms (SNP) at position -511 in the promoter region (rs16944) and at position+3954 in the fifth exon (rs1143634), respectively [11,12]. In theIL1RNgene, the second intron contains a variable number of tandem repeats (VNTR) of 86 base pairs (rs2234663) [13]. Many genetic association studies have intensively investigated the association of these SNPs with GD risk; however, results from individual studies are not consistent [14–27]. Here we conducted a meta-analysis with pooled data from 11 genetic association studies to determine risk of GD associated with these three polymor-phisms in theIL-1gene.
Materials and Methods
Search strategy and selection of studies
We conducted a literature search for studies reporting on the association betweenIL-1gene polymorphisms and GD risk using the electronic database PubMed, Medline and Web of Science from January 1990 up to the end of July 2013. The search results were limited to publications in English. The search strategy used the key words ‘‘IL-1, Graves’ disease, thyroid disease, genetic, association, polymorphism, susceptibility’’. We also screened references of retrieved publications. Inclusion criteria were as follows: (a) case-control design; (b) sufficient data provided to reconstruct two by two tables or determine odds ratio and confidence intervals. Studies were excluded if one of the following existed: (a) no control; (b) no usable data reported.
Data extraction
Information on general study characteristics including first author, year of publication, country, ethnicity, sample size, and genotype distribution in cases and controls was collected from the published papers.
Statistical analyses
Data were analyzed using Stata 11.0. We used raw data of genotype distribution, without adjustment for calculation of the study-specific estimates of odds ratio (OR) and 95% confidence interval (CI). Dominant, recessive and homozygote genetic models were employed to assess the relation ofIL-1gene polymorphisms with GD risk. Z-test was conducted for assessing the significance of the pooled ORs, with p,0.05 considered statistically significant. Cochran’ s Q test was used to test for heterogeneity, with significance level set at 0.10. The pooled estimation of the ORs of each publication was calculated with the fixed effects model (Mantel-Haenszel methods) in the absence of significant between-study heterogeneity [28], while the random effects model (DerSimonian and Laird’ s method) was employed for results showing high heterogeneity [29]. We used Begg’ s test to evaluate publication bias.
Results
Study characteristics
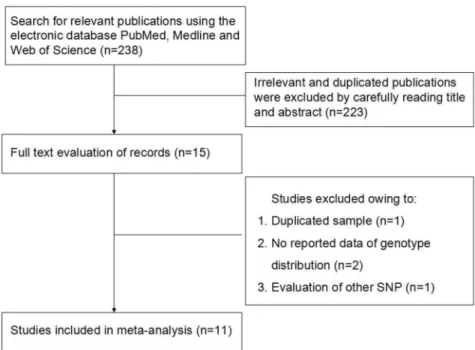
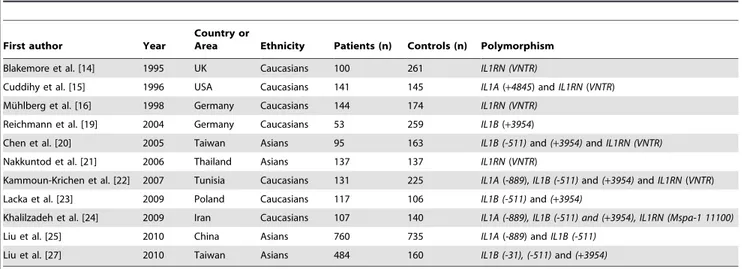
Figure 1 summarized the process of identifying eligible studies. After title and abstract evaluation we were left with 15 studies. Four studies were excluded after evaluating the remaining 15 articles in their entirety. Finally, 11 studies were included in the meta-analysis [14–16,19–25,27]. Table 1 summarizes the charac-teristics of the 11 studies according to the IL-1 gene polymor-phisms. Six studies investigated the IL1B (-511) polymorphism [20,22–25,27], six the IL1B (+3954) polymorphism [19,20,22– 24,27] and six studies the IL1RN (VNTR) polymorphism [14– 16,20–22]. Table 2 summarizes genotype distribution of theIL-1
gene polymorphisms.
Association between theIL1B(-511) polymorphism and GD
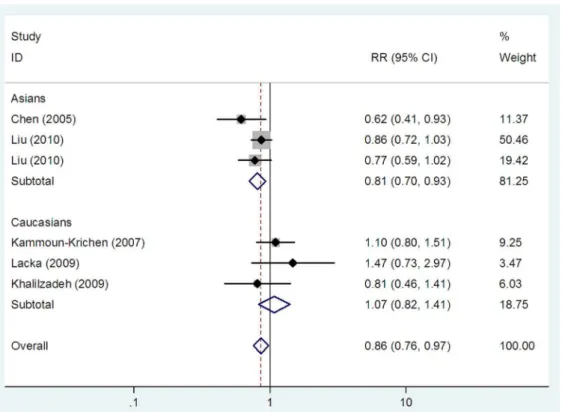
Three studies investigating the IL1B (-511) polymorphism reported on Caucasian populations [22–24], and three on Asians [20,25,27]. We found an association between the IL1B (-511)
polymorphism and GD risk in the overall populations in homozygote model (TT vs CC: OR = 0.86, 95% CI: 0.76–0.97,
Ph= 0.177,Pz= 0.015) (Table 3 and Fig. 2), but not in dominant
and recessive models (TT+TC vs CC: OR = 0.95, 95% CI: 0.81– 1.12,Ph= 0.244,Pz= 0.553 and TT vs TC+CC: OR = 0.82, 95%
CI: 0.60–1.12, Ph= 0.052,Pz= 0.205, respectively) (Table 3 and
Fig. 3). In subgroup analyses stratified by ethnicity, theIL1B(-511) polymorphism was associated with GD risk in Asians in homozygote and recessive models (TT vs CC: OR = 0.81, 95%
CI: 0.70–0.93, Ph= 0.324, Pz= 0.003 and TT vs TC+CC:
OR = 0.68, 95% CI: 0.55–0.84,Ph= 0.422,Pz,0.001,
respective-ly) (Table 3, Fig. 2 and Fig. 3), but not in dominant model (TT+TC vs CC: OR = 0.92, 95% CI: 0.77–1.11, Ph= 0.265,
Pz= 0.389) (Table 3). No association between the IL1B (-511)
polymorphism and GD risk was found in Caucasians in dominant model (TT+TC vs CC: OR = 1.06, 95% CI: 0.76–1.48,
Ph= 0.169,Pz= 0.736) (Table 3), recessive model (TT vs TC+CC:
OR = 1.26, 95% CI: 0.85–1.86,Ph= 0.438,Pz= 0.244) (Table 3 Table 1.Characteristics of the studies evaluatingIL-1gene polymorphisms and GD risk.
First author Year
Country or
Area Ethnicity Patients (n) Controls (n) Polymorphism
Blakemore et al. [14] 1995 UK Caucasians 100 261 IL1RN (VNTR)
Cuddihy et al. [15] 1996 USA Caucasians 141 145 IL1A(+4845) andIL1RN(VNTR)
Mu¨hlberg et al. [16] 1998 Germany Caucasians 144 174 IL1RN (VNTR)
Reichmann et al. [19] 2004 Germany Caucasians 53 259 IL1B(+3954)
Chen et al. [20] 2005 Taiwan Asians 95 163 IL1B (-511)and(+3954)andIL1RN (VNTR)
Nakkuntod et al. [21] 2006 Thailand Asians 137 137 IL1RN(VNTR)
Kammoun-Krichen et al. [22] 2007 Tunisia Caucasians 131 225 IL1A(-889),IL1B (-511)and(+3954)andIL1RN(VNTR)
Lacka et al. [23] 2009 Poland Caucasians 117 106 IL1B (-511)and(+3954)
Khalilzadeh et al. [24] 2009 Iran Caucasians 107 140 IL1A (-889), IL1B (-511) and (+3954), IL1RN (Mspa-1 11100)
Liu et al. [25] 2010 China Asians 760 735 IL1A(-889) andIL1B (-511)
Liu et al. [27] 2010 Taiwan Asians 484 160 IL1B (-31), (-511)and(+3954)
IL-1, interleukin-1; UK, united kingdom; USA, united states of America. doi:10.1371/journal.pone.0086077.t001
Table 2.Genotype distribution ofIL-1polymorphisms in patients and controls.
Polymorphism Patients Controls
IL1B(-511) CC (%) TC (%) TT (%) Total CC (%) TC (%) TT (%) Total
Chen (2005) 29 (30.53) 49 (51.58) 17 (17.89) 95 34 (20.86) 78 (47.85) 51 (31.29) 163
Kammoun-Krichen (2007) 17 (12.98) 86 (65.65) 28 (21.37) 131 26 (11.56) 165 (73.33) 34 (15.11) 225
Lacka (2009) 61 (52.14) 40 (34.19) 16 (13.68) 117 67 (63.21) 28 (26.42) 11 (10.38) 106
Khalilzadeh (2009) 33 (30.84) 60 (56.07) 14 (13.08) 107 36 (25.90) 82 (58.99) 21 (15.11) 139
Liu (2010) 228 (30.00) 399 (52.50) 133 (17.50) 760 220 (29.93) 351 (47.76) 164 (22.31) 735
Liu (2010) 154 (32.70) 230 (48.83) 87 (18.47) 471 48 (30.00) 70 (43.75) 42 (26.25) 160
IL1B(+3954) CC (%) TC (%) TT (%) Total CC (%) TC (%) TT (%) Total
Reichmann (2004) 3 (5.67) 26 (49.06) 24 (45.28) 53 14 (5.41) 101 (39.00) 144 (55.60) 259
Chen (2005) 90 (94.74) 5 (5.26) 0 (0.00) 95 155 (95.09) 7 (4.29) 1 (0.61) 163
Kammoun-Krichen (2007) 26 (19.85) 92 (70.23) 13 (9.92) 131 47 (20.89) 155 (68.89) 23 (10.22) 225
Lacka (2009) 77 (65.81) 32 (27.35) 8 (6.84) 117 78 (73.58) 24 (22.64) 4 (3.77) 106
Khalilzadeh (2009) 48 (45.71) 51 (48.57) 6 (5.71) 105 70 (50.00) 58 (41.43) 12 (8.57) 140
Liu (2010) 458 (97.24) 13 (0.03) 0 (0.00) 471 36 (22.50) 80 (50.00) 44 (27.5) 160
IL1RN(VNTR) LL (%) 2L (%) 22 (%) Total LL (%) 2L (%) 22 (%) Total
Blakemore (1995) 45 (45.00) 42 (42.00) 13 (13.00) 100 152 (58.24) 92 (35.25) 17 (6.51) 261
Cuddihy (1996) 83 (58.87) 50 (35.46) 8 (5.67) 141 83 (57.24) 51 (35.17) 11 (7.59) 145
Mu¨hlberg (1998) 99 (68.75) 33 (22.92) 12 (8.33) 144 104 (59.77) 49 (28.16) 21 (12.07) 174
Chen (2005) 87 (91.58) 7 (7.37) 1 (1.05) 95 147 (90.18) 15 (9.20) 1 (0.61) 163
Nakkuntod (2006) 109 (79.56) 25 (18.25) 3 (2.19) 137 106 (77.37) 29 (21.17) 2 (1.46) 137
Kammoun-Krichen (2007) 92 (70.23) 35 (26.72) 4 (3.05) 131 158 (70.22) 63 (28.00) 4 (1.78) 225
IL-1, interleukin-1.
doi:10.1371/journal.pone.0086077.t002
and Fig. 3) and homozygote model (TT vs CC: OR = 1.07, 95% CI: 0.82–1.41,Ph= 0.405,Pz= 0.600) (Table 3 and Fig. 2).
Association between theIL1B(+3954) polymorphism and GD
For this SNP, four studies were conducted in Caucasians [19,22–24], while two studies were performed in Asians [20,27]. No association between theIL1B(+3954) polymorphism and GD risk was observed in the overall populations in dominant model (TT+TC vs CC: OR = 0.63, 95% CI: 0.34–1.14, Ph,0.001,
Pz= 0.124) (Table 3), recessive model (TT vs TC+CC: OR = 0.51,
95% CI: 0.17–1.55, Ph,0.001, Pz= 0.233) (Table 3) and
homozygote model (TT vs CC: OR = 0.39, 95% CI: 0.08–1.99,
Ph,0.001,Pz= 0.259) (Table 3). In subgroup analyses stratified by
ethnicity, we found that theIL1B(+3954) polymorphism was not associated with GD risk in Asians in domiant model (TT+TC vs CC: OR = 0.19, 95% CI: 0.01–5.32, Ph,0.001, Pz= 0.328)
(Table 3), recessive model (TT vs TC+CC: OR = 0.04, 95% CI: 0.00–8.86, Ph= 0.010, Pz= 0.239) (Table 3) and homozygote
model (TT vs CC: OR = 0.02, 95% CI: 0.00–13.04,Ph= 0.003,
Pz= 0.240)(Table 3). No association between the IL1B (+3954)
polymorphism and GD risk was found in Caucasians in dominant model (TT+TC vs CC: OR = 1.02, 95% CI: 0.95–1.09,
Ph= 0.320,Pz= 0.640) (Table 3), recessive model (TT vs TC+CC:
OR = 0.82, 95% CI: 0.56–1.22, Ph= 0.449,Pz= 0.334) (Table 3)
and homozygote model (TT vs CC: OR = 1.02, 95% CI: 0.60– 1.72,Ph= 0.630,Pz= 0.953) (Table 3).
Association between theIL1RN(VNTR) polymorphism and GD
Four studies evaluated this polymorphism in Caucasians [14– 16,22], while two studies on this polymorphism were performed in Asians [20,21]. We found no association between the IL1RN (VNTR)polymorphism and GD risk in the overall populations in dominant model (22+2L vs LL: OR = 0.99, 95% CI: 0.80–1.22,
Ph= 0.145, Pz= 0.914) (Table 3), recessive model (22 vs 2L+LL:
OR = 1.12, 95% CI: 0.73–1.68,Ph= 0.301,Pz= 0.636) (Table 3)
and homozygote model (22 vs LL: OR = 1.11, 95% CI: 0.73–1.70,
Ph= 0.149,Pz= 0.630) (Table 3). In subgroup analyses according
to ethnicity, we did not find an association between the IL1RN
(VNTR) polymorphism and GD risk in Caucasians and Asians, respectively (Table 3).
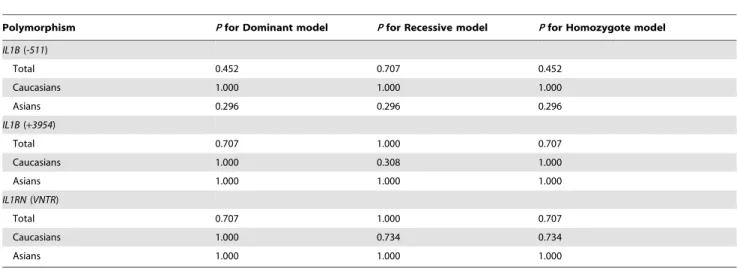
Heterogeneity and publication bias
Table 3 showed between-study heterogeneity in details. Begg’s test was used to evaluate publication bias. No publication bias was present in the analysis assessing theIL1B(-511),IL1B(+3954), and
IL1RN(VNTR) polymorphisms. Table 4 summarized the results of Begg’s test in detail.
Discussion
Since 1995, many genetic association studies have assessed the relation of the IL1B (-511) and (+3954), and IL1RN (VNTR) polymorphisms with GD risk; however, the findings remain inconclusive. This may partly be owing to a small sample size of individual studies and distinct genetic background. Meta-analysis is a quantitative statistical analysis that combines the results of previous separate but related studies in order to test the pooled data for statistical significance. It has been increasingly utilized in
Figure 2. Meta-analysis with a fixed effects model for the association between theIL1B (-511) polymorphism and GD risk in homozygote model.Each study is shown by the point estimate of the odds ratio, and a horizontal line denotes the 95% confidence interval. The pooled odds ratio is represented by a diamond. The area of the grey squares reflects the weight of the study in the meta-analysis.
assessing associations between genetic variants and autoimmune diseases, including multiple sclerosis (MS), type 1 diabetes, and GD [30]. In the present study, we undertook a meta-analysis of 11 published case-control studies to investigate the association between the three mainIL-1 gene polymorphisms and GD risk. The main findings were as follows: (1) theIL1B(-511) polymor-phism was associated with GD risk in homozygote model in the
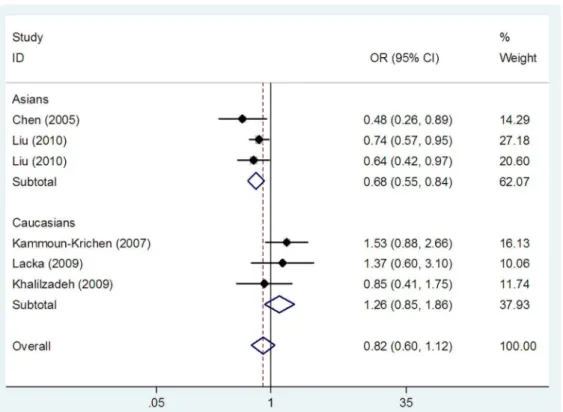
overall populations; (2) the IL1B (+3954) and IL1RN (VNTR) polymorphisms were not associated with GD risk in any of the genetic models in the overall populations; (3) in Asians, theIL1B( -511) polymorphism was associated with GD risk in recessive and homozygote models, while theIL1B(+3954) andIL1RN(VNTR) polymorphisms were not associated with GD risk; (4) no association between the IL1B (-511), IL1B(+3954), and IL1RN Figure 3. Meta-analysis with a random effects model for the association between theIL1B(-511) polymorphism and GD risk in recessive model.Each study is shown by the point estimate of the odds ratio, and a horizontal line denotes the 95% confidence interval. The pooled odds ratio is represented by a diamond. The area of the grey squares reflects the weight of the study in the meta-analysis.
doi:10.1371/journal.pone.0086077.g003
Table 3.Meta-analysis of polymorphisms in theIL-1gene and GD risk.
Polymorphism
No. of studies
(Cases/Controls) Dominant model Recessive model Homozygote model
OR (95% CI) Ph Pz OR (95% CI) Ph Pz OR (95% CI) Ph Pz
IL1B (-511)
Total 6 (1681/1528) 0.95 (0.81–1.12) 0.244 0.553 0.82 (0.60–1.12) 0.052 0.205 0.86 (0.76–0.97) 0.177 0.015 Caucasians 3 (355/470) 1.06 (0.76–1.48) 0.169 0.736 1.26 (0.85–1.86) 0.438 0.244 1.07 (0.82–1.41) 0.405 0.600
Asians 3 (1326/1058) 0.92 (0.77–1.11) 0.265 0.389 0.68 (0.55–0.84) 0.422 ,0.001 0.81 (0.70–0.93) 0.324 0.003 IL1B (+3954)
Total 6 (972/1053) 0.63 (0.34–1.14),0.001 0.124 0.51 (0.17–1.55) ,0.001 0.233 0.39 (0.08–1.99) ,0.001 0.259
Caucasians 4 (406/730) 1.02 (0.95–1.09) 0.320 0.640 0.82 (0.56–1.22) 0.449 0.334 1.02 (0.60–1.72) 0.630 0.953
Asians 2 (566/323) 0.19 (0.01–5.32),0.001 0.328 0.04 (0.00–8.86) 0.010 0.239 0.02 (0.00–13.04) 0.003 0.240
IL1RN (VNTR)
Total 6 (748/1105) 0.99 (0.80–1.22) 0.145 0.914 1.12 (0.73–1.68) 0.301 0.636 1.11 (0.73–1.70) 0.149 0.630
Caucasians 4 (516/805) 1.02 (0.81–1.29) 0.049 0.875 1.07 (0.69–1.66) 0.119 0.748 1.08 (0.69–1.69) 0.046 0.734
Asians 2 (232/300) 0.87 (0.54–1.41) 0.943 0.567 1.57 (0.34–7.15) 0.938 0.561 1.52 (0.33–6.95) 0.931 0.588
CI, confidence interval; GD, Graves’ disease; IL-1, interleukin-1; OR, odds ratio;Ph,P-value for heterogeneity;Pz,P-value for overall effect. *Significant associations are highlighted in bold.
doi:10.1371/journal.pone.0086077.t003
(VNTR) polymorphisms and GD risk was observed in any of the genetic models in Caucasians.
IL-1B is a pluripotential proinflammatory cytokine that primarily produced by B lymphocytes, monocytes and fibroblasts. It is an important mediator for the inflammatory responses and play key roles in the triggering of immune functions, effecting nearly every cell type. IL-1B influenced thyroid cells via a number of underlying mechanisms, including down-regulation of thyroid peroxidase gene expression [31], induction of dissociation of the junctional complex [32], and inhibition of cyclic adenosine monophosphate (cAMP) and thyroglobulin production [33]. In the development of GD, infiltration of the thyroid by activated immune cells results in local release of IL-1B. It has been observed that IL-1B induces the production of IL-6, IL-8, intercellular adhesion molecule-1 (ICAM-1), and other inflammatory mediators [34–36]. IL-1B also enhances T cell-dependent antibody produc-tion by augmenting CD40 ligand and OX40 expression on T cells [37]. IL-1B was shown to promote differentiation of T-helper 17 (Th17) cell, the proportion of which was reported to be higher in intractable GD than that of GD in remission [38]. Therefore,IL1B
may play a role in the pathogenesis of thyroid autoimmunity. In this meta-analysis, we observed that theIL1B (-511)TT genotypes were protective against GD in Asians. This SNP may affect protein expression and function [27,39], resulting in down-regulation of inflammatory responses and resistance to develop GD. Several reasons may account for the discrepancy of results between Asians and Caucasians. First, distinct genetic background may play a role. Second, GD is a complex disease which is also related to environmental factors. Genetic susceptibility to GD may be modified by a variety of environmental exposures, leading to differences in genetic associations. Between-study heterogeneity was identified in several pooled analyses. However, when we undertook subgroup analyses according to ethnicity, heterogeneity was greatly reduced, suggesting that ethnicity was the main source of heterogeneity. Other potential factors, such as study design, sample size and genotyping methods, might also contribute to heterogeneity.
Some limitations should be acknowledged when interpreting this meta-analysis. First, our study only included publications
written in English. It is possible that some relevant papers written in other languages were missed. Second, all included case-control studies were conducted in Caucasians and Asians. Therefore, the results of this meta-analysis were only applicable to these two ethnic groups. For providing additional evidence of the association between theIL-1gene polymorphisms and GD risk, future studies should be performed in other ethnic groups, for example in Latin Americans. Third, although we combined data from all included published case-controls assessing the IL1B (-511), IL1B (+3954) andIL1RN (VNTR)polymorphisms, the sample size of this meta-analysis was still relatively small, which limited the statistical power to achieve a definitive conclusion. Fourth, haplotype analysis using haplotypes constructed by these SNPs could not be conducted because relevant data provided by included studies were limited. Future association studies are needed to evaluate haplotype associations with GD risk, which will provided more insights for the effects of gene-gene interaction among these SNPs on GD risk. In summary, our meta-analysis suggested that the IL1B(-511) polymorphism, but not the IL1B (+3954) and IL1RN (VNTR)
polymorphisms was associated with GD risk in Asians, and there was no association between these polymorphisms and GD risk in Caucasians. Future studies should be performed using large sample numbers to establish a more definitive conclusion
Supporting Information
Checklist S1 PRISMA Checklist.
(DOC)
Figure S1 PRISMA flow diagram.
(DOC)
Author Contributions
Conceived and designed the experiments: JH ZFX. Performed the experiments: MLC NL HZ JH ZFX. Analyzed the data: MLC NL HZ JH ZFX. Contributed reagents/materials/analysis tools: MLC NL HZ JH ZFX. Wrote the paper: MLC NL HZ JH ZFX. Discussion: MLC NL HZ JH ZFX.
Table 4.Begg’s test for evaluating publication bias.
Polymorphism Pfor Dominant model Pfor Recessive model Pfor Homozygote model IL1B(-511)
Total 0.452 0.707 0.452
Caucasians 1.000 1.000 1.000
Asians 0.296 0.296 0.296
IL1B(+3954)
Total 0.707 1.000 0.707
Caucasians 1.000 0.308 1.000
Asians 1.000 1.000 1.000
IL1RN(VNTR)
Total 0.707 1.000 0.707
Caucasians 1.000 0.734 0.734
Asians 1.000 1.000 1.000
IL-1, interleukin-1.
References
1. Weetman AP (2000) Graves’ disease. N Engl J Med 343:1236–1248. 2. Prabhakar BS, Bahn RS, Smith TJ (2003) Current perspective on the
pathogenesis of Graves’ disease and ophthalmopathy. Endocr Rev 24:802–835. 3. Heufelder AE (2000) Pathogenesis of ophthalmopathy in autoimmune thyroid
disease. Rev Endocr Metab Disord 1:87–95.
4. Brinster NK, Garrett AB, Kostopoulos TC (2013) Localized myxedema of thyroid disease. J Am Acad Dermatol 68:e189–190.
5. Hemminki K, Li X, Sundquist J, Sundquist K (2010) The epidemiology of Graves’ disease: evidence of a genetic and an environmental contribution. J Autoimmun 34:J307–313.
6. Tomer Y (2010) Genetic susceptibility to autoimmune thyroid disease: past, present, and future. Thyroid 20:715–725.
7. Velaga MR, Wilson V, Jennings CE, Owen CJ, Herington S, et al. (2004) The codon 620 tryptophan allele of the lymphoid tyrosine phosphatase (LYP) gene is a major determinant of Graves’ disease. J Clin Endocrinol Metab 89:5862–5865. 8. Ban Y, Tomer Y (2005) Susceptibility genes in thyroid autoimmunity. Clin Dev
Immunol 12:47–58.
9. Zhao SX, Pan CM, Cao HM, Han B, Shi JY,et al. (2010) Association of the CTLA4 gene with Graves’ disease in the Chinese Han population. PLoS One 5:e9821.
10. Jurecka-Lubieniecka B, Ploski R, Kula D, Krol A, Bednarczuk T, et al. (2013) Association between age at diagnosis of Graves’ disease and variants in genes involved in immune response. PLoS One 8:e59349.
11. Garcı´a-Gonza´lez MA, Aı´sa MA, Strunk M, Benito R, Piazuelo E, et al. (2009) R elevance of IL-1 and TNF gene polymorphisms on interleukin-1beta and tumor necrosis factor-alpha gastric mucosal production. Hum Immunol 70:935–945. 12. Stegger JG, Schmidt EB, Tjønneland A, Kopp TI, Sørensen TI, et al. (2012)
Single nucleotide polymorphisms in IL1B and the risk of acute coronary syndrome: a Danish case-cohort study. PLoS One 7:e36829.
13. Jaiswal D, Trivedi S, Singh R, Dada R, Singh K (2012) Association of the IL1RN gene VNTR polymorphism with human male infertility. PLoS One 7:e51899.
14. Blakemore AI, Watson PF, Weetman AP, Duff GW (1995) Association of Graves’ disease with an allele of the interleukin-1 receptor antagonist gene. J Clin Endocrinol Metab 80:111–115.
15. Cuddihy RM, Bahn RS (1996) Lack of an association between alleles of interleukin-1 alpha and interleukin-1 receptor antagonist genes and Graves’ disease in a North American Caucasian population. J Clin Endocrinol Metab 81:4476–4478.
16. Mu¨hlberg T, Kirchberger M, Spitzweg C, Herrmann F, Heberling HJ, et al. (1998) Lack of association of Graves’ disease with the A2 allele of the interleukin-1 receptor antagonist gene in a white European population. Eur J Endocrinol 138:686–690.
17. Hunt PJ, Marshall SE, Weetman AP, Bell JI, Wass JA, et al. (2000) Cytokine gene polymorphisms in autoimmune thyroid disease. J Clin Endocrinol Metab 85:1984–1988.
18. Chistyakov DA, Savost’anov KV, Turakulov RI, Petunina NA, Trukhina LV, et al. (2000) Complex association analysis of graves disease using a set of polymorphic markers. Mol Genet Metab 70:214–218.
19. Reichmann I, Schulte KM, Roeher HD (2004) No association of IL-1beta C+3954 T polymorphism and thyroid disease. Exp Clin Endocrinol Diabetes 112:440–443.
20. Chen RH, Chen WC, Chang CT, Tsai CH, Tsai FJ (2005) Interleukin-1-beta gene, but not the interleukin-1 receptor antagonist gene, is associated with Graves’ disease. J Clin Lab Anal 19:133–138.
21. Nakkuntod J, Wongsurawat T, Charoenwongse P, Snabboon T, Sridama V, et al. (2006) Association of TNF-alpha, TNF-beta, IFN-gamma and IL-1Ra gene polymorphisms with Graves’ disease in the Thai population. Asian Pac J Allergy Immunol 24:207–211.
22. Kammoun-Krichen M, Bougacha-Elleuch N, Makni K, Rebai M, Peraldi-Roux S, et al. (2007) Association analysis of interleukin gene polymorphisms in autoimmune thyroid diseases in the Tunisian population. Eur Cytokine Netw 18:196–200.
23. Lacka K, Paradowska A, Gasinska T, Soszynska J, Wichary H, et al. (2009) Interleukin-1beta gene (IL-1beta) polymorphisms (SNP -511 and SNP+3953) in thyroid-associated ophthalmopathy (TAO) among the Polish population. Curr Eye Res 34:215–220.
24. Khalilzadeh O, Anvari M, Esteghamati A, Mahmoudi M, Tahvildari M, et al. (2009) Graves’ ophthalmopathy and gene polymorphisms in interleukin-1alpha, interleukin-1beta, interleukin-1 receptor and interleukin-1 receptor antagonist. Clin Experiment Ophthalmol 37:614–619.
25. Liu N, Li X, Liu C, Zhao Y, Cui B, et al. (2010) The association of interleukin-1alpha and interleukin-1beta polymorphisms with the risk of Graves’ disease in a case-control study and meta-analysis. Hum Immunol 71:397–401.
26. Khalilzadeh O, Anvari M, Esteghamati A, Momen-Heravi F, Mahmoudi M, et al. (2010) The interleukin-1 family gene polymorphisms and Graves’ disease. Ann Endocrinol (Paris) 71:281–285.
27. Liu YH, Chen RH, Wu HH, Liao WL, Chen WC, et al. (2010) Association of interleukin-1beta (IL1B) polymorphisms with Graves’ ophthalmopathy in Taiwan Chinese patients. Invest Ophthalmol Vis Sci 51:6238–6246 28. MANTEL N, HAENSZEL W (1959) Statistical aspects of the analysis of data
from retrospective studies of disease. J Natl Cancer Inst 22: 719–748. 29. DerSimonian R, Laird N (1986) Meta-analysis in clinical trials. Control Clin
Trials 7: 177–188.
30. Kavvoura FK, Ioannidis JP (2008) Methods for meta-analysis in genetic association studies: a review of their potential and pitfalls. Hum Genet 123:1–14. 31. Ashizawa K, Yamashita S, Tobinaga T, Nagayama Y, Kimura H, et al. (1989) Inhibition of human thyroid peroxidase gene expression by interleukin 1. Acta Endocrinol (Copenh) 121:465–469.
32. Nilsson M, Husmark J, Bjo¨rkman U, Ericson LE (1998) Cytokines and thyroid epithelial integrity: interleukin-1alpha induces dissociation of the junctional complex and paracellular leakage in filter-cultured human thyrocytes. J Clin Endocrinol Metab 83:945–952.
33. Rasmussen AK, Feldt-Rasmussen U, Bendtzen K (1993) The effect of interleukin-1 on the thyroid gland. Autoimmunity 16:141–148.
34. Dinarello CA (1997) Interleukin-1. Cytokine Growth Factor Rev 8:253–265. 35. Yoon JS, Lee HJ, Choi SH, Chang EJ, Lee SY, et al. (2011) Quercetin inhibits
IL-1b-induced inflammation, hyaluronan production and adipogenesis in orbital fibroblasts from Graves’ orbitopathy. PLoS One 6:e26261.
36. Paik JS, Cho WK, Oh EH, Lee SB, Yang SW (2012) Palmitate induced secretion of IL-6 and MCP-1 in orbital fibroblasts derived from patients with thyroid-associated ophthalmopathy. Mol Vis 18:1467–1477.
37. Nakae S, Asano M, Horai R, Sakaguchi N, Iwakura Y (2001) IL-1 enhances T cell-dependent antibody production through induction of CD40 ligand and OX40 on T cells. J Immunol 167:90–97.
38. Nanba T, Watanabe M, Inoue N, Iwatani Y (2009) Increases of the Th1/Th2 cell ratio in severe Hashimoto’s disease and in the proportion of Th17 cells in intractable Graves’ disease. Thyroid 19:495–501.