Integrating Paleodistribution Models and
Phylogeography in the Grass-Cutting Ant
Acromyrmex striatus
(Hymenoptera:
Formicidae) in Southern Lowlands of South
America
Maykon Passos Cristiano1,2,4¤
*, Danon Clemes Cardoso1,3,4, Tânia Maria Fernandes-Salomão1, Jürgen Heinze4
1Departamento de Biologia Geral, Universidade Federal de Viçosa, Av. Peter Henry Rolfs, s/n, Viçosa,
Minas Gerais, 36570–000, Brazil,2Departamento de Biodiversidade, Evolução e Meio Ambiente/ICEB, Universidade Federal de Ouro Preto, Campus Morro do Cruzeiro, Ouro Preto, Minas Gerais, 35400–000, Brazil,3Departamento de Genética, Setor de Ciências Biológicas, Universidade Federal do Paraná, Rua Francisco H. dos Santos, 100, Jardim das Américas, Curitiba, Paraná, 81530–000, Brazil,4Zoology /
Evolutionary Biology, Universitätstrasse 31, Universität Regensburg, 93040, Regensburg, Deutschland
¤ Current address: Universidade Federal de Ouro Preto, Instituto de Ciências Exatas e Biológicas, Departamento de Biodiversidade Evolução e Meio Ambiente, Campus Morro do Cruzeiro, S/N, Ouro Preto, Minas Gerais, 35400–000, Brazil
*Maykon.Passos@biologie.uni-regensburg.de
Abstract
Past climate changes often have influenced the present distribution and intraspecific genetic diversity of organisms. The objective of this study was to investigate the phylogeo-graphy and historical demophylogeo-graphy of populations ofAcromyrmex striatus(Roger, 1863), a
leaf-cutting ant species restricted to the open plains of South America. Additionally, we modeled the distribution of this species to predict its contemporary and historic habitat. From the partial sequences of the mitochondrial gene cytochrome oxidase I of 128A. stria-tusworkers from 38 locations we estimated genetic diversity and inferred historical
demog-raphy, divergence time, and population structure. The potential distribution areas ofA. striatusfor current and quaternary weather conditions were modeled using the maximum
entropy algorithm. We identified a total of 58 haplotypes, divided into five main haplogroups. The analysis of molecular variance (AMOVA) revealed that the largest proportion of genetic variation is found among the groups of populations. Paleodistribution models suggest that the potential habitat ofA.striatusmay have decreased during the Last Interglacial Period
(LIG) and expanded during the Last Maximum Glacial (LGM). Overall, the past potential dis-tribution recovered by the model comprises the current potential disdis-tribution of the species. The general structuring pattern observed was consistent with isolation by distance, sug-gesting a balance between gene flow and drift. Analysis of historical demography showed that populations ofA.striatushad remained constant throughout its evolutionary history.
Although fluctuations in the area of their potential historic habitat occurred during quaternary
OPEN ACCESS
Citation:Cristiano MP, Clemes Cardoso D, Fernandes-Salomão TM, Heinze J (2016) Integrating Paleodistribution Models and Phylogeography in the Grass-Cutting AntAcromyrmex striatus
(Hymenoptera: Formicidae) in Southern Lowlands of South America. PLoS ONE 11(1): e0146734. doi:10.1371/journal.pone.0146734
Editor:Wolfgang Arthofer, University of Innsbruck, AUSTRIA
Received:October 8, 2015
Accepted:December 21, 2015
Published:January 6, 2016
Copyright:© 2016 Cristiano et al. This is an open access article distributed under the terms of the
Creative Commons Attribution License, which permits unrestricted use, distribution, and reproduction in any medium, provided the original author and source are credited.
Data Availability Statement:All relevant data are within the paper and its Supporting Information files.
climate changes, populations ofA.striatusare strongly structured geographically. However,
explicit barriers to gene flow have not been identified. These findings closely match those in
Mycetophylax simplex, another ant species that in some areas occurs in sympatry withA. striatus. Ecophysiological traits of this species and isolation by distance may together have
shaped the phylogeographic pattern.
Introduction
Climatic oscillations during the Quaternary Period have a strong effect on the genetic diversity and distribution of extant species [1–4]. Increased aridity and decreased temperatures during the glacial led to a fragmentation of tropical forests, and forest species became restricted to sta-ble wetland refuges [5–9]. In South America, phylogenetic studies have revealed a high genetic diversity and endemism in the fauna of tropical forests, especially of the Amazon and Atlantic Forest biomes [8,10,11]. This, together with paleoclimate models, indicates that many animals persisted during the glacial maxima in forest fragments north of their current range and subse-quently spread south [3,8].
However, for southern Brazil, several studies have pointed out ambiguities in the predictions from these models [12,13]. It appears that the cool and dry weather during the glaciations allowed grassland ecosystems and open vegetation environments to expand over much of South America [14]. Fossil pollen suggests that subtropical grasslands increased their range to the north by at least 750 km (to latitude 20°S) [14,15]. Grasslands today occur in patches in the southern highlands of Brazil (especially in Santa Catarina), where they are maintained by a climate with long periods of drought and low rainfall [14]. Subtropical grasslands, known as
“campos sulinos”or“Pampas,”can also be found in the plains in southern Brazil in the state of Rio Grande do Sul, where they connect with the Pampas of Argentina and Uruguay [16]. Taxa from grassland habitats likely responded to climatic oscillations in the Quaternary Period in a different way than forest species [17–21]. Despite the potential for better understanding the patterns of diversity and distribution, only few studies have been conducted with such organ-isms and the observed patterns are still controversial [22–24].
Ants are an important component of all terrestrial ecosystems, but so far little attention has been given to the phylogeography of South American taxa [24]. The leaf-cutting ant Acromyr-mex striatus(Roger, 1863) is restricted to grassland habitats in the temperate zones of South America (above 30°). This makes it an excellent model to evaluate the influence of historical climate fluctuations on the origin and evolutionary dynamics of plains associated with open vegetation in southern South America.A.striatusis common in coastal sandbanks (restinga) and sandy soils throughout the Pampas (including thecampos sulinos), the Brazilian southern coast in the states of Santa Catarina and Rio Grande do Sul, parts of the Chaco in Argentina, and the extreme south of Paraguay [25]. Its nest is peculiar because workers clean the soil sur-face above the fungus chambers from all vegetation and dead plant material [26,27]. In addi-tion,A.striatusis an intriguing species with regards to taxonomic, phylogenetic, and
cytogenetic aspects. Cristiano et al. (2013) indicated thatA.striatushas the same chromosome number as the genusAtta, but in a phylogeny it clusters with neither its congeners norAtta, but forms a sister group to the other leaf-cutting ants evaluated [28].
To better understand the evolutionary history ofA.striatus(Roger, 1863) and to get insights into the history of South American plains we analyzed the phylogeography and population genetics of this species across much of its distribution. Our goal was to determine the genetic fellowship during his doctorate studies in Brazil at
Universidade Federal de Viçosa and during the sandwich period at the Universität Regensburg in Germany (CBB-22003/11).
structure of its populations and the geographical patterns of genetic variation and to use these data to investigate how the glacial and interglacial periods have influenced the distribution in this species. In addition, we estimated the current potential distribution area and the historical potential area ofA.striatususing paleoclimate models to allow a more detailed evaluation of the demographic history and phylogeographical patterns.
Materials and Methods
Collection of samples
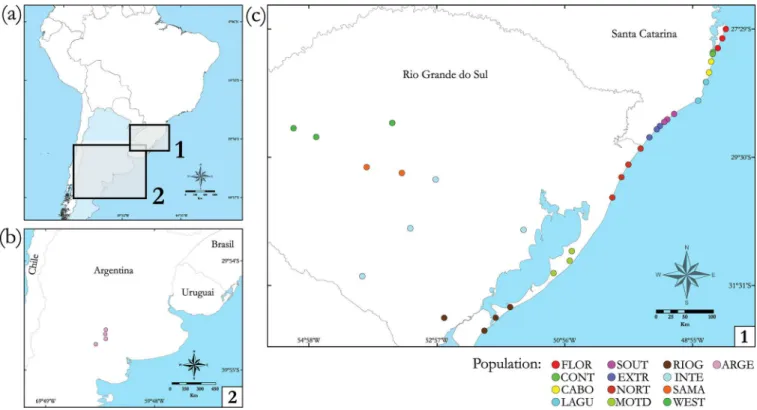
A total of 128 colonies ofAcromyrmex striatuswere collected at 38 sites in Brazil and Argentina (Table 1andFig 1). The specific permission for collections in Brazil (SISBio26441-1) was authorized by the Instituto Chico Mendes de Conservação da Biodiversidade (ICMBio). Sam-ples from Argentina were kindly provided by Dr. Stela Quirán. These 38 sampling sites were pooled into 13 populations to ensure reliable estimates of regional differentiation and diversity and to allow appropriate statistical analysis. Thus, geographically and ecologically close loca-tions (neighboring plains and/or plains inside large rivers basins) were pooled in order to obtain populations with sample sizes with of at least eight colonies. InTable 1, sampling locali-ties belonging to the same population are shown.
Extraction of DNA, amplification and sequencing
Samples ofA.striatuspreserved in alcohol were used for extraction of total DNA from one individual of each colony, using the protocol of Fernandes-Salomãoet al. (2005) [29]. The extracted DNA was used to amplify part of the mitochondrialcytochrome oxidase subunitI gene (COI) and part of the nuclear genewingless(wg). The primer pair CO11-3F and CO12-4R [30] was used for amplification of the COI gene and the pair Wg578F [31] and Wg1032R [32] for the wg gene.
PCR was performed using 1U ofTaqpolymerase (Promega), dNTPs (0.25 mM each), MgCl2 (2.5 mM), 1XTaqbuffer (Promega), primers (0.48 mM each) and 1μL of DNA (50 ng) in a final volume of 25μL. The amplification conditions included an initial denaturation step at 94°C for 3 min, followed by 35 cycles of 1 min at 94°C for DNA denaturation, 1 min at 53.5°C (COI) or 55°C (wg) for annealing of the primers and 72°C for 2 min (COI) or 1 min (wg) for primer extension followed by a final extension step at 72°C for 7 min.
The amplicons were sent to Macrogen Inc., South Korea (www.macrogen.com), purified and sequenced directly in both directions (forward and reverse) using the same primers as in the amplification reactions.
The forward and reverse strands were visually inspected and assembled using the program Consed [33]. Sequences were first translated into amino acid sequences to guarantee the homology of the sites and to exclude the possible presence of stop codons or indels. Thereafter the nucleotides were aligned using the ClustalW algorithm [34] in the MEGA5 program [35].
Genetic diversity and structure of the population
The genetic diversity of each population sampled was investigated using the DNAsp 5.1 pro-gram [36] to assess nucleotide polymorphism, number of haplotypes (H), haplotype diversity (Hd), and nucleotide diversity (π).
groups that are geographically homogeneous and genetically different from each other. Popula-tions were split into two to twelve groups, and the apportionment of genetic variation and its cause was analyzed (FCT). The highest and statistically significant value of FCTfor a determined Kwas identified among the groups analyzed.
Table 1. Specimens ofAcromyrmex striatussampled for phylogeographic analysis. Sampling sites, geographic coordinates (S = South, W = West), number of individuals and estimated haplotypes from the COI gene followed by the number of individuals (n). Samples collected in the states of Rio Grande do Sul and Santa Catarina are represented by RS and SC, respectively.
Country Population Localities (State) Coordinates Haplotypes (n)
S W
Brazil FLOR Moçambique (SC) 27.48 48.38 1(4)
Joaquina (SC) 27.63 48.45 1(1)
Pantano do Sul (SC) 27.78 48.52 1(4)
CONT Pinheira (SC) 27.87 48.60 1(2)
Sonho (SC) 27.84 48.59 1(2), 12(2)
CABO Garopaba (SC) 27.99 48.63 1(2), 11(2), 12(1) Ibiraquera (SC) 28.16 48.65 1(5)
LAGU Laguna (SC) 28.60 48.83 1(3), 4(1), 5(1)
Itapirubá (SC) 28.31 48.70 1(3), 9(1), 10(1) SOUT Rincão (SC) 28.81 49.20 6(1), 7(1), 8(1)
Ilhas (SC) 28.90 49.32 1(2)
Araranguá (SC) 28.93 49.35 1(3), 2(1) EXTR Arroio do Silva (SC) 29.02 49.44 1(3), 2(1), 3(1),
Gaivota (SC) 29.18 49.60 1(2), 3(1)
NORT Torres (RS) 29.36 49.74 13(1), 14(1)
Curumim (RS) 29.62 49.93 15(1)
Xangrilá (RS) 29.82 50.04 16(2), 17(1), 18(1) Cidreira (RS) 30.13 50.18 15(1), 19(1)
MOTD Mostardas (RS) 31.13 50.83 20(1), 21(2), 22(1), 23(1) Tavares (RS) 31.32 51.11 21(2), 23(1), 26(1), 27(1) São Simão (RS) 30.93 50.76 24(1), 25(1)
RIOG São José do Norte (RS) 32.02 52.03 28(2)
Estreito (RS) 31.85 51.79 29(1), 30(1), 31(2) Cassino (RS) 32.11 52.17 32(1), 33(2), 34(1) Pedro Osório (RS) 32.02 52.83 47(2), 48(1), 49(1)
INTE Bagé (RS) 31.36 54.11 35(1), 50(2)
Cachoeira do Sul (RS) 29.84 52.96 41(1), 44(1), 45(1) Caçapava do Sul (RS) 30.61 53.36 32(1), 33(2), 34(1)
Tapes (RS) 30.65 51.56 51(1), 52(1)
SAMA Santa Maria (RS) 29.65 54.05 35(1), 36(1), 37(3) Restinga Seca (RS) 29.76 53.49 37(1), 38(1), 39(1), 40(1) WEST Unistalda (RS) 29.03 55.21 35(1), 41(2), 42(1)
Cruz Alta (RS) 28.95 53.64 41(3), 43(1)
Santiago (RS) 29.18 54.85 41(5)
Argentina ARGE Santa Rosa 36.61 64.32 53(1)
Ataliva Roca 37.05 64.28 54(2), 55(1) Entre Lihuel Calel 37.53 65.15 56(1)
Winifreda 35.22 64.26 57(1), 58(1)
An analysis of molecular variance (AMOVA) was estimated by the genetic variation and fix-ation indices implemented in Arlequin 3.5 [38]. AMOVA was calculated with three hierarchi-cal levels according to the population groups defined by SAMOVA. We also performed a second AMOVA considering sample sites, without anya prioripopulation group, to test possi-ble bias due our population grouping.
To assess whether genetic variation could be explained by isolation by distance, a correlation was performed between the logarithm of genetic distance and geographic distance by Mantel tests [39] using the program Alleles In Space (AIS) [40] with 10000 replications.
A gene genealogy was reconstructed in the program Network 4.6.1.1. ( www.fluxus-engineering.com) using the median-joining algorithm to verify the existence of a relationship between the distribution of haplotypes and the geographic distribution of the analyzed samples ofA.striatus.
Historical demography and divergence
To determine if populations ofA.striatusunderwent recent population expansions or bottle-necks, we used Fu’s Fs [41] and Tajima’s D [42] neutrality tests in ARLEQUIN 3.5 for each population. The distribution of genetic differences between pairs of haplotypes (Mismatch dis-tribution) was performed in the population that showed significant results for the neutrality tests considering the premise of panmictic populations. The observed distribution was com-pared with the one expected for the demographic expansion model and the spatial expansion model using the program ARLEQUIN 3.5. In general, multimodal distributions are consistent with demographic stability or multiple expansion events, while unimodal distributions com-monly indicate that the population underwent a recent population and spatial expansion [38].
Fig 1. Map of South America with the geographic distribution ofAcromyrmex striatuspopulations sampled.(a) Map of the South American continent, (b) population collected in Argentina and (c) populations collected in Brazil. Each collection site is represented by a point, and the colors of the points indicate each population. These same colors used to represent each population were also present in the haplotype network.
Fit of the models to our data was assessed by the significance of the sums of squared deviations (SSD) and Harpending’s raggedness index (Hri index).
To determine when major clades diverged and if the time of divergence corresponds to any of the known events in the Quaternary Period, we estimated the divergence times between clades following Seal et al. (2011) [43]. The time since the most recent common ancestor (TMRCA) was estimated by the Bayesian approach in MCMC chains using the program BEAST 1.6.1 [44]. The mutation rate of 1.455E-02 ± 1.25E-03 substitutions per site per million years, estimated specifically for the COI gene of ants [11], was used under an uncorrelated log-normal relaxed molecular clock. This approach was selected because an analysis in PAUP[45]
rejected the restricted or fixed molecular clock model (χ2= 211.6; d.f. = 56; P<0.001).
Treat-ing this as an intraspecific analysis, the identical sequences were removed and the coalescence of constant size model was used (coalescence: constant size). Analyzes were conducted using the SRD06 nucleotide substitution model [46], which allows that the third position of the codon has a substitution rate different from that estimated for the first and second positions of the codon. The analyses were performed by setting 30 million generations and 20% of the ini-tial runs were excluded. A total of five independent analyses were conducted and subsequently combined and analyzed in the program TRACER v 1.5 [47], to verify the consistency and repeatability of the data by means of the effective sample size (ESS)>200.
Modeling of the current and historical potential distribution
The potential current and quaternary distribution ofA.striatuswas determined using the max-imum entropy algorithm in Maxent [48]. This model allows calculating the probability of occurrence of a species in a geographic area based on environmental variables for a given set of locations. To generate correlative models of the range ofA.striatusunder current and paleocli-mates, we used 311 geo-referenced point locality data obtained from our own fieldwork (S1 Table). The climatic variables used to perform the modeling were: mean annual temperature (BIO1), temperature seasonality (standard deviation100) (BIO4), mean temperature in the
driest quarter (BIO9), annual precipitation (BIO12), precipitation seasonality (coefficient of variation100) (BIO15), and precipitation in the warmest quarter (BIO18), available at the
WorldClim database (http:\\www.worldclim.org) and with a spatial resolution of 2.5 arc-min [49]. These variables were selected based on the nesting biology, the thermoregulatory capacity ofA.striatusand its symbiotic fungus [50], and to minimize the autocorrelation between the different WorldClim variables. The environmental dataset was clipped to the species’ approxi-mate supposed distribution, following recommendations by Anderson and Raza [51]. Consid-ering the spatial resolution used in the analysis, 57 of 311 points were independent. The algorithm removed duplicate points to perform the modeling. We modeled the distribution of
A.striatususing 75% of the species data for training and 25% for testing the models, setting Maxent to run with random seed, a convergence threshold of 0.00001 with 500 interactions and 10,000 maximum number of background points. We selected the logistic output format to generate response curves jackknife results. In order to avoid spurious predictions, we defined a minimum training presence threshold, which is equal to the prediction of a model with a mini-mum value of presence for any occurrence. The modeling performance was evaluated using the average values of the 25% training gains through 10 bootstrap replicates and the mean of the area under the curve (AUC) of the receiver operating characteristic curve (ROC).
Model) from WorldClim database (http:\\www.worldclim.org) [49], in order to infer the appropriate predictive area for the occurrence ofA.striatusduring the Quaternary.
Results
Characterization and diversity of the sequences
A total of 922 unambiguous base pairs were sequenced from the mitochondrial COI gene in natural populations ofA.striatus, and no stop codon or indel was observed. For the nuclear gene wingless, 338 base pairs were sequenced (KU162879-KU162939); however, this gene did not show any intraspecific polymorphism. Thus, all following analyses were only performed with the COI gene. All COI sequences were deposited in GenBank under the accession num-bers KR605508–KR605635. Of the 66 variable sites in COI, 58 were informative for parsimony and eight were singletons. We identified 58 haplotypes. The difference in the number of nucle-otides between sequences averaged 12.96 nuclenucle-otides (min—max = 0–37), and the maximum divergence between two sequences was 4.01%. Although, the definition of what is a natural population is always an arbitrary issue. The population evaluations that follow inhere should be viewed with thoughtfulness since they could bear possible bias introduced by our population grouping strategy. Haplotype diversity (Hd) was 0.908 ± 0.021 and total nucleotide diversity (π) was 0.01406 ± 0.00094 across all populations. The populations presenting the highest and lowest haplotype diversity were ARGE and FLOR, respectively. The population FLOR also showed the lowest nucleotide diversity, while the highest was observed in NORT (Table 2).
Phylogenetic relationships and geographic structure
Fig 2shows the phylogenetic relationships among haplotypes ofA.striatuswith five geographi-cally structured haplogroups. The populations ofA.striatuscollected in the coastal region of Santa Catarina were all included in the same haplogroup, including 12 haplotypes, with haplo-type H1 (n = 36) being the most abundant (Fig 2). Similarly, samples collected in Argentina formed a single haplogroup with high haplotype diversity. Samples from the southern coastline of Rio Grande do Sul (RIOG) form a haplogroup separate from samples collected in the
Table 2. Genetic diversity and neutrality tests for each population ofAcromyrmex striatus. Significant values are presented in bold.
Population N H Hd π Neutrality tests
Tajima’s D p-value Fu’s Fs p-value
FLOR 09 01 0.000±0.000 0.00000±0.000 0.00000 1.00000 0.00000 n.a
CONT 06 02 0.533±0.172 0.00058±0.000 0.85057 0.88170 0.62543 0.37000
CABO 10 03 0.511±0.164 0.00137±0.000 -0.39990 0.36850 0.94880 0.69820
LAGU 10 05 0.667±0.163 0.00207±0.001 -1.39868 0.09030 -0.70594 0.25180
SOUT 09 05 0.722±0.159 0.00193±0.001 -1.79752 0.01130 -1.11299 0.13920
EXTR 08 06 0.607±0.164 0.00221±0.001 -0.56068 0.31290 1.61176 0.81340
NORT 09 07 0.944±0.070 0.01344±0.004 1.72582 0.98130 0.72790 0.60250
MOTD 12 08 0.894±0.078 0.00251±0.002 -1.75016 0.02680 -3.45722 0.00970
RIOG 14 10 0.956±0.038 0.00365±0.002 -0.95645 0.17710 -4.07787 0.01190
INTE 12 08 0.894±0.078 0.00526±0.002 -0.81319 0.22000 -1.13556 0.25360
SAMA 09 06 0.833±0.127 0.00368±0.001 0.10765 0.56430 -0.87706 0.24990
WEST 13 04 0.423±0.164 0.00139±0.001 -1.24415 0.11130 0.02744 0.47760
ARGE 07 06 0.952±0.096 0.00424±0.002 0.33464 0.64290 -1.64228 0.10910
N: number of samples; H: number of haplotypes; Hd: haplotype diversity;π: nucleotide diversity;±: standard deviation.
interior and on the coast of Rio Grande do Sul. Three exclusive haplotypes (H13, H14 and H19) were identified in samples from the NORT population (both locations are situated along the northern coast of the state of Rio Grande do Sul) and form a haplogroup isolated from the other populations. The remaining populations of the interior and the coast of Rio Grande do Sul formed a distinct haplogroup, with the most abundant haplotype being H41 (n = 14). Hap-lotype distribution shows high regional structuring ofA.striatuspopulations (S1 Fig), where haplogroups are connected by nine or more mutational steps.
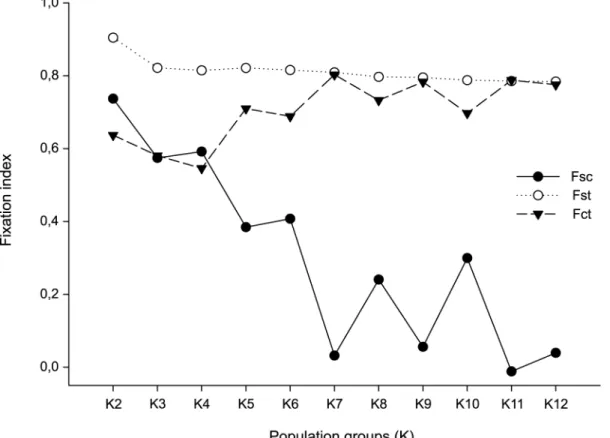
SAMOVA allowed identifying the maximum genetic differentiation between the groups and therefore estimating potential barriers to gene flow. The split inK= 7 groups showed the highest value of FCT(Fig 3) and the subdivision scheme: [FLOR, CABO, LAGU, SOUT, EXTR]
[CONT] [NORT] [MOTD] [RIOG] [INTE, SAMA, WEST] [ARGE]. Based on the groups sug-gested by SAMOVA, the AMOVA showed that most of the genetic variation was attributed to differences among population groups or between sampled regions (Table 3). The AMOVA results considering sampling sites without the population grouping also showed that most of the genetic variation was attributed to differences among population groups (S2 Table). The population groups identified by SAMOVA (K = 7) match the geographical location of popula-tions and adjacent populapopula-tions were grouped together. Pairwise FSTvalues varied between
0.9494 and 0.0000 and were mostly significant (p<0.05). In general, the lowest values of FST
were observed between neighboring populations. FSTvalues between populations of Santa Fig 2. Genealogical relationship inferred for 58 haplotypes of the mitochondrial COI gene ofAcromyrmex striatusestimated by the median-joining algorithm.The areas are proportional to the frequency of haplotypes, which ranged from 1 to 36. Colors represent each population sampled, and correspond with the colors ofFig 1. The numbers of haplotypes ofA.striatuscorrespond with those shown inTable 1. Numbers in red indicate mutational steps between
haplotypes greater than one. Five haplogroups can be viewed. The small white circles represent lost or unsampled haplotypes.
Catarina were not significant, suggesting that there is no significant lack of gene flow between these populations (S3 Table).
The logarithm of genetic distance and the geographical distance were significantly corre-lated (Mantel test, r = 0.5662;p<0.01), indicating that the genetic differentiation betweenA. striatuspopulations may be partially attributed to isolation by distance. An analysis after exclu-sion of the most distant population from Argentina still yielded a significant result (r = 0.5031;
p<0.01).
Historical demography and molecular dating
Neutrality tests were conducted for each of the 13 populations ofA.striatusand the results are shown in theTable 2. Among the 13 populations analyzed, only one (MOTD population)
Fig 3. Spatial analysis of molecular variance (SAMOVA) of the 13 populations ofAcromyrmex striatus.The fixation indexes were calculated independently for each groupK. The most significant value of the fixation index FCTfor a givenKreports the best grouping of populations ofA.striatus.
doi:10.1371/journal.pone.0146734.g003
Table 3. Analysis of molecular variance (AMOVA) for the speciesAcromyrmex striatus, performed with three hierarchical levels, considering the groups formed by SAMOVA.
Source of variation df Percentage of variation
Among groups 6 80.28
Among populations within groups 6 0.63
Within groups 115 19.09
df: degrees of freedom. All values were significant atp<0.01.
showed significant, negative values for both Fu’s Fs (p<0.01) and Tajima’s D (p<0.05) tests.
These results indicate that haplotype frequencies for MOTD differ from those expected by the neutral evolution hypothesis and suggest a recent population expansion. The unimodal distri-bution of pairwise haplotype differences in the mismatch distridistri-bution analysis of MOTD gave a similar result (S2 Fig), and the observed distribution pattern fits well with the spatial expan-sion (SDD = 0.00758;p= 0.70;Hri= 0.06084;p= 0.62) and the demographic expansion models (SDD = 0.00758;p= 0.70;Hri= 0.06084;p= 0.66).
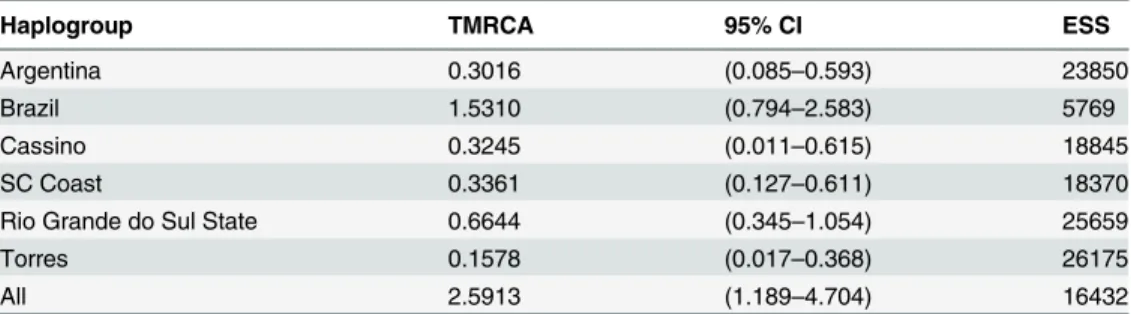
Table 4presents the time of divergence between estimated clades by means of the Bayesian approach. Time to the most recent common ancestor of populations from Brazil and Argentina was ~2.5 million years. Divergence times for all Brazilian populations was ~1.531 million years and for populations from the interior of Rio Grande do Sul (including MOTD and part of NORT) ~664,000 years. Populations from the coast of Santa Catarina and the extreme south of Rio Grande do Sul (RIOG) are relatively younger, with divergence times of 336,100 and 324,500 years, respectively (Table 4).
Current and historical potential distribution
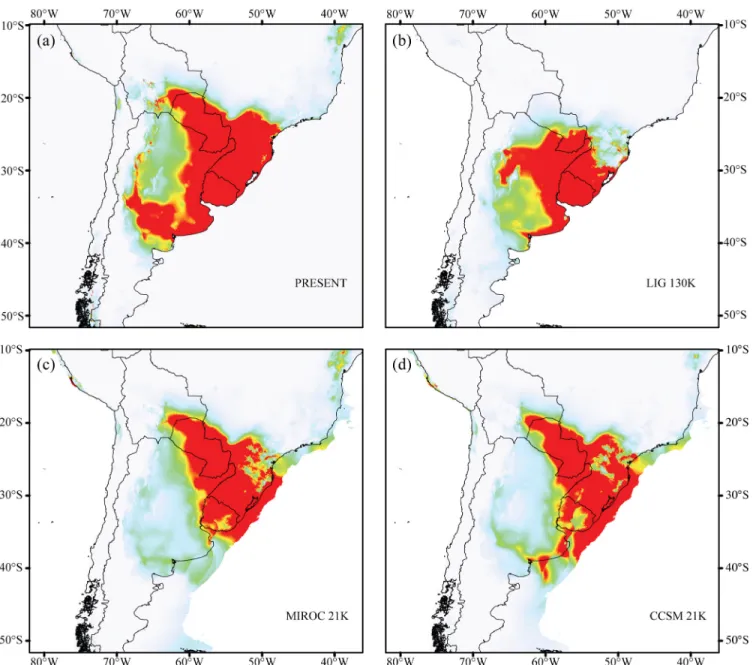
The modeled current potential distribution (Fig 4) widely overlapped with the current known distribution ofA.striatus, although it included a few areas that are not suitable for this ant (e.g., Atlantic Forest areas north of the state of Santa Catarina). The models achieved over 2.5 regularized gain values indicating good fit to presence data. The AUC was high, with a mean value of 0.981 and a standard deviation of 0.009, showing no over-fitting around the presence data. Projection of the model for the potential occurrence ofA.striatuson the paleoclimatic parameters of the Last Glacial Maximum (LGM) and Last Interglacial Period (LIG) recovered appropriate potential areas for the occurrence ofA.striatus(Fig 4). Paleodistribution models suggest that the potential habitat ofA.striatusmay have decreased during the LIG and expanded during the LGM. Estimated areas with a high probability of occurrence during the LGM even surpassed the present coastline, which can be explained by the lower sea levels dur-ing the LGM, which increased the Atlantic coastline by more than 120 km (Fig 4).
Discussion
The results obtained in the present study clarify the evolutionary history and the pattern of genetic variability ofA.striatus, a species associated with vegetation of the open plains. The observed phylogeographic pattern appears to reflect both ecophysiological traits of the studied species and isolation by distance.
Table 4. Estimates of the divergence time of the most recent common ancestor between the hap-logroups ofAcromyrmex striatus(in million years).Estimates were based on the mutation rate for the mitochondrial COI gene in ants (0.01455 bp per million years).
Haplogroup TMRCA 95% CI ESS
Argentina 0.3016 (0.085–0.593) 23850
Brazil 1.5310 (0.794–2.583) 5769
Cassino 0.3245 (0.011–0.615) 18845
SC Coast 0.3361 (0.127–0.611) 18370
Rio Grande do Sul State 0.6644 (0.345–1.054) 25659
Torres 0.1578 (0.017–0.368) 26175
All 2.5913 (1.189–4.704) 16432
TMRCA: Time to most recent common ancestor; CI: Confidence interval; ESS: Effective sample size.
Across its range, populations are genetically highly structured, presumably reflecting long-lasting isolation of population groups in the past. Populations within the same geographical region are genetically similar, suggesting restricted gene flow between geographically separated groups of populations. AMOVA confirmed the existence of five previously defined population groups (seeTable 3), and SAMOVA identified seven potential barriers to gene flow that may have shaped the genetic differentiation among regions in the past (seeResultssection). One of the detected barriers separates the coastal populations from inland populations, while gene flow appears unrestricted among coastal populations of Santa Catarina state, at the northern edge ofA.striatusdistribution. Populations on Santa Catarina’s island (FLOR) shared
Fig 4. Geographical distribution for climatically predicted areas for the occurrence ofAcromyrmex striatusbased on current and past bioclimatic variables.(a) potential distribution under current conditions, (b) LIG 130K: last interglacial period (130,000 years before present), (c) MIROC 21k and (d) CCSM 21k: last glacial maximum (21,000 years before present). Warm colors (red/yellow) represent areas with high probability ofA.striatus.
haplotypes with coastal populations, matching the observation that a few kilometers of sea do not represent an impassable barrier for flying insects [30,43].
A similar pattern of unrestricted gene flow among coastal populations was also observed in the endemic sand dune antMycetophylax simplex[52], which occurs in sympatry withA. stria-tusin parts of its coastal range. This congruency may suggest that open sandy habitats, free of obvious geographical barriers, facilitate ant dispersion over long distances. However,A.striatus
populations in the southern part of the coastal plain were genetically structured in contrast to those ofM.simplex. This discordance might be due to differences between these two species in dispersal capabilities and habit requirements.M.simplexis thought to disperse over several kilometers whereasA.striatuswas suggested to disperse only over short distances [52]. Fur-thermore,M.simplexnests always in open areas, which are abundant on the coast. In contrast,
A.striatusnests on open, well-drained sites close to shrubby vegetation, which are patchily dis-tributed on the coast.
Our study did not identify explicit physical barriers to gene flow. Although able to fly, queens ofA.striatushave low dispersion capability [53] and successfully establish nests only in areas with sandy, well-drained soil, with little organic matter [54]. Selection of suitable soil for colony establishment is highly relevant for leaf-cutting ants [50]. Thus, the observed phylogeo-graphic pattern might reflect the historical geomorphology of the two plains (coastal and inland plains) whereA.striatusoccurs. Both plains are characterized by sandy, permeable soils, and are influenced by strong winds. The coastal plains are geologically more recent and formed mainly of sandy soils. The Pampas are older environments with several different types of soil [23,55] and sandy soils are patchily distributed. This heterogeneity of the landscape and the distribution of the preferred nesting habitat may well explain the structured phylogeographical pattern ofA.striatusand matches similar findings in subterranean rodents of the genus Cte-nomys[20,21], andPetunia[56], andCalibrachoaplants from the same habitat [23].
Some of distance measures and FSTvalues, mainly between Argentine populations, were
quite extreme (>4% of sequence divergence and>0.9 pairwise FST, seeS3 Table). Such results
can be an indicative of possible presence of cryptic species, but further analysis would be needed. The combination of high haplotype and nucleotide diversity inA.striatusis related to historically large and stable populations [57]. In fact, neutrality tests did not identify deviations of the neutral evolution hypothesis for 12 from 13 studied populations. This indicates thatA.
striatusdid not experience periods of rapid population expansion or bottlenecks (except for the MOTD population, seeresults), but that the species remained demographically stable. Thus, our study suggests that the colonization of open vegetation in the plains byA.striatus
occurred gradually and was influenced by factors such as climatic events at the end of the Plio-cene and throughout the Quaternary Period.
leaf-cutter ants must have originated and diversified in open environments in southern South America [58].
It has been thought that events during the Pleistocene have acted as main trigger of species diversification in the Neotropics [59]. However, phylogeographic studies on Atlantic Forest spe-cies based on molecular clock have suggested that spespe-cies diversification and dispersion may have occurred already before the Pleistocene [11–13]. Our results confirm this observation, since the estimated age for the TMRCA ofA.striatushaplotypes falls into the Pliocene. The age of major clades ofA.striatusseems to match the estimated time of the formation of coastal plains in Rio Grande do Sul by gradual depositions of sand barriers along the coast during the Pleisto-cene and HoloPleisto-cene around 400,000 B.P. [60]. According to the haplotype frequencies, the central and northern coastal populations (NORT; MOTD) are separated from those in the south (RIOG). This suggests that the RIOG population is derived from a lineage independent of other lineages present in Rio Grande do Sul (north coast and inland populations). The time of diver-gence of ~324.500 years corresponds to the age of formation of the sandy barrier where this pop-ulation occurs today (see [60]). The remaining costal populations occupy sand ridges formed during secondary marine transgressive-regressive events and are therefore younger.
In conclusion, our results suggest that populations ofA.striatusare geographically struc-tured as a result of stable historical demography during the evolutionary time and low disper-sion capacity across sandy soil patches. Isolation by distance appears to have a strong influence and suggests equilibrium between migration and genetic drift in this ant species. These results are consistent with the hypothesis that the Pampas and the coastal region of southern Brazil were not strongly affected by the expansion of forests during the interglacial periods. Due to the diversity of responses observed in species inhabiting open vegetation environments, more species from such environments need to be studied to better understand the general processes that governed the diversification of these ecosystems.
Supporting Information
S1 Fig. Geographical distribution and genealogical relationship ofAcromyrmex striatus.
The haplotype network (Fig 2) of the mitochondrial COI gene ofA.striatusis superimposed on the map (Fig 1) approximately on the sampling points.
(TIF)
S2 Fig. Mismatch distributions for the population MOTD ofAcromyrmex striatus. Histo-grams represent the observed frequencies of the pair-to-pair differences between haplotypes and lines represent the simulated curve for the population MOTD under the demographic expansion (solid line) and spatial expansion models (dashed line).
(TIF)
S1 Table. List of 311 new records of nests ofA.striatuscollected by us in Brazil and Argen-tina between February 2009 and August 2011.
(PDF)
S2 Table. Analysis of molecular variance (AMOVA) for theA.striatus, performed with three hierarchical levels, considering each 38 sites in Brazil e Argentina (populations), con-sidering the groups formed by SAMOVA (7 groups).
(PDF)
S3 Table. FSTvalues of pair-wise comparisons between populations ofAcromyrmex striatus, estimated from the mitochondrial COI gene.Values shown in bold are significant (p<0.05).
Acknowledgments
The present work could not be accomplished without help of many people. We are grateful to Terezinha de Castro Della Lucia, Alci Loeck, Dionisio Link (in memory) and Stela Quiran for their help with field sampling. We would like to thank Christoph D. Schubart and Nicole Rivera for their help with population genetic analyses and comments on previous version of the manuscript, and Andreas Trindl and Doris Rothgänger for their support in the laboratory.
Author Contributions
Conceived and designed the experiments: MPC DCC. Performed the experiments: MPC DCC. Analyzed the data: MPC DCC JH. Contributed reagents/materials/analysis tools: MPC DCC TMFS JH. Wrote the paper: MPC DCC TMFS JH.
References
1. Avise JC. Phylogeography: The history and formation of species. Harvard University Press, Massa-chusetts, Cambridge; 2000.
2. Avise JC. Phylogeography: retrospect and prospect. J Biogeogr. 2009; 36: 3–15.
3. Hewitt GM. The genetic legacy of the Quaternary ice ages. Nature. 2000; 405: 907–913. PMID:
10879524
4. Hewitt GM. Genetic consequences of climatic oscillations in the Quaternary. Philos Trans R Soc Lond B Biol Sci. 2004; 359: 183–195. PMID:15101575
5. Haffer J. Speciation in Amazonian Forest Birds. Science. 1969; 165: 131–137. PMID:17834730
6. Vanzolini P, Williams E. The vanishing refuge: a mechanism for ecogeographic speciation. Pap Avul-sos Zool. 1981; 34: 251–255.
7. Carnaval AC, Moritz C. Historical climate modelling predicts patterns of current biodiversity in the
Bra-zilian Atlantic forest. J Biogeogr. 2008; 35: 1187–1201.
8. Carnaval AC, Hickerson MJ, Haddad CFB, Rodrigues MT, Moritz C. Stability predicts genetic diversity in the Brazilian Atlantic Forest hotspot. Science. 2009; 323: 785–789. doi:10.1126/science.1166955 PMID:19197066
9. Porto TJ, Carnaval AC, Rocha PLB. Evaluating forest refugial models using species distribution mod-els, model filling and inclusion: a case study with 14 Brazilian species. Divers Distrib. 2013; 19: 330– 340.
10. Solomon SE, Bacci M, Martins J, Vinha GG, Mueller UG. Paleodistributions and comparative molecular phylogeography of leafcutter ants (Attaspp.) provide new insight into the origins of Amazonian
diver-sity. PloS One. 2008; 3: e2738. doi:10.1371/journal.pone.0002738PMID:18648512
11. Resende HC, Yotoko KSC, Delabie JHC, Costa MA, Campiolo S, Tavares MG, et al. Pliocene and Pleistocene events shaping the genetic diversity within the central corridor of the Brazilian Atlantic For-est. Biol J Linn Soc. 2010; 101: 949–960.
12. Fitzpatrick SW, Brasileiro CA, Haddad CFB, Zamudio KR. Geographical variation in genetic structure of an Atlantic Coastal Forest frog reveals regional differences in habitat stability. Mol Ecol. 2009; 18: 2877–2896. doi:10.1111/j.1365-294X.2009.04245.xPMID:19500257
13. Thomé MTC, Zamudio KR, Giovanelli JGR, Haddad CFB, Baldissera FA, Alexandrino J. Phylogeogra-phy of endemic toads and post-Pliocene persistence of the Brazilian Atlantic Forest. Mol Phylogenet Evol. 2010; 55: 1018–1031. doi:10.1016/j.ympev.2010.02.003PMID:20139019
14. Behling H. South and southeast Brazilian grasslands during Late Quaternary times: a synthesis. Palaeogeogr Palaeocl. 2002; 177:19–27.
15. Behling H, Negrelle RRB. Tropical rain forest and climate dynamics of the Atlantic lowland, Southern Brazil, during the Late Quaternary. Quaternary Res. 2001; 56: 383–389.
16. Behling H, Jeske-Pieruschka V, Schüler L, Pillar VP. Dinâmica dos campos no sul do Brasil durante o Quaternário tardio. In: Pillar VP, Müller SC, Castilhos ZMS, Jacques AVÁ, Editors. Campos sulinos— conservação e uso sustentável da biodiversidade. Brasilia: Instituto do Meio Ambiente e dos Recursos Naturais Renováveis; 2009. p. 13–25.
17. González S, Maldonado JE, Leonard JA, Vilá C, Barbanti-Duarte JM, Merino M, et al. Conservation genetics of the endangered Pampas deer (Ozotoceros bezoarticus). Mol Ecol. 1998; 7: 47–56. PMID:
18. Gonzalez J, Wink M. Genetic differentiation of the Thorn-tailed RayaditoAphrastura spinicauda (Fur-nariidae: Passeriformes) revealed by ISSR profiles suggests multiple palaeorefugia and high recurrent gene flow. Ibis. 2010; 152: 761–774.
19. Ojeda AA. Phylogeography and genetic variation in the South American rodentTympanoctomys bar-rerae(Rodentia: Octodontidae). J Mammal. 2010; 91: 302–313.
20. Mapelli FJ, Mora MS, Mirol PM, Kittlein MJ. Effects of Quaternary climatic changes on the
phylogeogra-phy and historical demographylogeogra-phy of the subterranean rodentCtenomys porteousi. J Zool. 2012; 286: 48– 57.
21. Mora MS, Cutrera AP, Lessa EP, Vassallo AI, D’Anatro A, Mapelli FJ. Phylogeography and population genetic structure of the Talas tuco-tuco (Ctenomys talarum): integrating demographic and habitat histo-ries. J Mammal. 2013; 94: 459–476.
22. Sérsic AN, Cosacov A, Cocucci AA, Johnson LA, Pozner R, Avila LJ, et al. Emerging phylogeographi-cal patterns of plants and terrestrial vertebrates from Patagonia. Biol J Linn Soc. 2011; 103: 475–494.
23. Fregonezi JN, Turchetto C, Bonatto SL, Freitas LB. Biogeographical history and diversification of Petu-niaandCalibrachoa(Solanaceae) in the Neotropical Pampas grassland. Bot J Linn Soc. 2013; 171: 140–153.
24. Turchetto-Zolet AC, Pinheiro F, Salgueiro F, Palma-Silva C. Phylogeographical patterns shed light on evolutionary process in South America. Mol Ecol. 2013; 22: 1193–1213. doi:10.1111/mec.12164
PMID:23279129
25. Delabie JH, Alves H, Reuss-Strenzel G, Carmo A, Nascimento I. Distribuição das formigas cortadeiras dos gênerosAcromyrmexeAttano Novo Mundo. In: Della-Lucia T, Editor. Formigas cortadeiras: da bioecologia ao manejo. Viçosa: Editora Universidade Federal de Viçosa; 2011. p. 80–101.
26. Gonçalves CR. O gêneroAcromyrmexno Brasil (Hym. Formicidae). Studia Ent. 1961; 4: 113–180.
27. Kusnezov N. Zoogeografia de las hormigas en sudamerica. Acta zool Lilloana. 1963; XIX: 25–186.
28. Cristiano MP, Cardoso DC, Fernandes-Salomão TM. Cytogenetic and molecular analyses reveal a divergence betweenAcromyrmex striatus(Roger, 1863) and other congeneric species: taxonomic implications. PloS One. 2013; 8: e59784. doi:10.1371/journal.pone.0059784PMID:23527267
29. Fernandes-Salomão TM, Rocha RB, Campos LAO, Araújo EF. The first internal transcribed spacer (ITS-1) ofMelipona species(Hymenoptera, Apidae, Meliponini): characterization and phylogenetic analysis. Insect Soc. 2005; 52: 11–18.
30. Azuma N, Ogata K, Kikuchi T, Higashi S. Phylogeography of Asian weaver ants, Oecophylla smarag-dina. Ecol Res. 2006; 21: 126–136.
31. Ward PS, Downie DA. The ant subfamily Pseudomyrmecinae (Hymenoptera: Formicidae): phylogeny and evolution of big-eyed arboreal ants. Syst Entomol. 2005; 30: 310–335.
32. Abouheif E, Wray GA. Evolution of the gene network underlying wing polyphenism in ants. Science. 2002; 297: 249–252. PMID:12114626
33. Gordon D, Abajian C, Green P. Consed: A graphical tool for sequence finishing. Genome Res. 1998; 8: 195–202. PMID:9521923
34. Thompson JD, Higgins DG, Gibson TJ. CLUSTAL W: improving the sensitivity of progressive multiple sequence alignment through sequence weighting, position-specific gap penalties and weight matrix choice. Nucleic Acid Res. 1994; 22: 4673–4680. PMID:7984417
35. Tamura K, Peterson D, Peterson N, Stecher G, Nei M, Kumar S. MEGA5: Molecular Evolutionary Genetics Analysis using maximum likelihood, evolutionary distance, and maximum parsimony meth-ods. Mol Biol Evol. 2011; 28: 2731–2739. doi:10.1093/molbev/msr121PMID:21546353
36. Librado P, Rozas J. DnaSP v5: a software for comprehensive analysis of DNA polymorphism data. Bio-informatics. 2009; 25: 1451–1452. doi:10.1093/bioinformatics/btp187PMID:19346325
37. Dupanloup I, Schneider S, Excoffier L. A simulated annealing approach to define the genetic structure of populations. Mol Ecol. 2002; 11: 2571–2581. PMID:12453240
38. Excoffier L, Lischer HE. Arlequin suite ver 3.5: a new series of programs to perform population genetics analyses under Linux and Windows. Mol Ecol Res. 2010; 10: 564–567.
39. Mantel N. The detection of disease clustering and a generalized regression approach. Cancer Res. 1967; 27: 209–220. PMID:6018555
40. Miller MP. Alleles in space (AIS): computer software for the joint analysis of interindividual spatial and genetic information. J Hered. 2005; 96: 722–724. PMID:16251514
41. Fu YX. Statistical tests of neutrality of mutations against population growth, hitchhiking and background selection. Genetics. 1997; 147: 915–925. PMID:9335623
43. Seal JN, Kellner K, Trindl A, Heinze J. Phylogeography of the parthenogenic antPlatythyrea punctata: highly successful colonization of the West Indies by a poor disperser. J Biogeogr. 2011; 38: 868–882.
44. Drummond A, Rambaut A. BEAST: Bayesian evolutionary analysis by sampling trees. BMC Evol Biol. 2007; 214: 1–8.
45. Swofford DL. PAUP*. Phylogenetic analysis using parsimony (*and other methods). 2003.
46. Shapiro B, Rambaut A, Drummond AJ. Choosing appropriate substitution models for the phylogenetic analysis of protein-coding sequences. Mol Biol Evol. 2006; 23: 7–9. PMID:16177232
47. Rambaut A, Drummond AJ. 2007. Available:http://beast.bio.ed.ac.uk/Tracer.
48. Phillips SJ, Anderson RP, Schapire RE. Maximum entropy modeling of species geographic distribu-tions. Ecol Model. 2006; 190: 231–259.
49. Hijmans RJ, Cameron SE, Parra JL, Jones PG, Jarvis A. Very high resolution interpolated climate sur-faces for global land areas. Int J Climatol. 2005; 25: 1965–1978.
50. Bollazzi M, Kronenbitter J, Roces F. Soil temperature, digging behaviour, and the adaptive value of nest depth in South American species ofAcromyrmexleaf-cutting ants. Oecologia. 2008; 158: 165– 175. doi:10.1007/s00442-008-1113-zPMID:18668265
51. Raza A, Anderson RP. The effect of the extent of the study region on GIS models of species geographic
distributions and estimates of niche evolution: preliminary tests with montane rodents (genus Nephel-omys) in Venezuela. J Biogeogr. 2010; 37: 1378–1393.
52. Cardoso DC, Cristiano MP, Tavares MG, Schubart CD, Heinze H. Phylogeography of the sand dune ant Mycetophylax simplex along the Brazilian Atlantic Forest coast: remarkably low mtDNA diversity and shallow population structure. BMC Evol Biol. 2015; 15: 1–13.
53. Diehl E, De Araújo AM, Cavalli-Molina S. Genetic variability and social structure of colonies in Acromyr-mex heyeriandA.striatus(Hymenoptera: Formicidae). Braz J Biol. 2001; 61: 667–678. PMID:
12071324
54. Diehl-Fleig E, Rocha ES. Escolha de solo por fêmeas deAcromyrmex striatus(Roger) (Hymenoptera: Formicidae) para construção do ninho. An Soc Entomol Bras. 1998; 27: 41–45.
55. Freitas EM, Trevisan R, Schneider AA, Boldrini II. Floristic diversity in areas of sandy soil grasslands in Southwestern Rio Grande do Sul, Brazil. Rev Bras Biocienc. 2010; 8: 112–130.
56. Ramos-Fregonezi AMC, Fregonezi JN, Cybis GB, Fagundes NJR, Bonatto SL, Freitas LB. Were sea level changes during the Pleistocene in the South Atlantic Coastal Plain a driver of speciation inPetunia
(Solanacea)? BMC Evol Biol. 2015; 15: 92. doi:10.1186/s12862-015-0363-8PMID:25989835
57. Grant WAS, Bowen BW. Shallow population histories in deep evolutionary lineages of marine fishes: insights from sardines and anchovies and lessons for conservation. J Hered. 1998; 89: 415–426.
58. Fowler HG. Latitudinal gradients and diversity of the leaf-cutting ants (AttaandAcromyrmex) (Hyme-noptera: Formicidae). Rev Biol Trop. 1983; 31: 213–216.
59. Moritz C, Patton JL, Schneider CJ, Smith TB. Diversification of rainforest faunas: an integrated molecu-lar approach. Annu Rev Ecol Syst. 2000; 31: 533–563.