THE DISTRIBUTION
OF TETANUS
IN ARGENTINA1
Vicente
E. Mazz6fero,*
Mario
Boyer,S and Alvaro Moncayo-Medina4
SignifiCant numbers of tetanus cases and deaths from neonatal tetanus occur in Argentina evq year. Thti article desc7ibes climatic and seasonal factors af- fecting tetanus incidence there and points to areas (case registration and report- ing, immunization of pregnant women) where measures being taken against the problem could be improved.
Introduction
The incidence of tetanus can be analyzed in
terms of population variables (such as age and
place of residence) and also in terms of envi-
ronmental conditions (such as soil type and
climate), thus shedding light on some of the
disease’s epidemiologic features (I). Indeed,
information about the occurrence of tetanus in
a country’s various political subdivisions, and
about tetanus morbidity and mortality in dif-
ferent age groups, provides an essential basis
for settkg control program implementation
and evaluation priorities (2).
tween 1.2 and 1.7 cases per 100,000 although in 1967 the rate rose to 3.1 per lOO,OOO-
apparently as a result of an important reorga-
nization and temporary improvement of the
national reporting system.
Table 2 shows average rates by political
subdivision for the period 1967-1977. The
overall incidence for the whole country in this period was 1.6 cases per 100,000 population, but large differences occurred in various po-
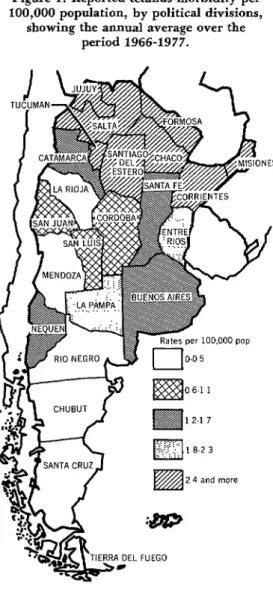
litical subdivisions. By and large, the lowest
rates were found in the southern parts of the
country. Figure 1 indicates the variations in
data reported from different areas.
Geographic, Climatic, and Seasonal Variations
Table 1. Reported tetanus cases in Argentina
Geography and incidence per 100,000 population, for 1965-1977. by year,
Table 1 shows the number of tetanus cases No. of Population per 100,000 Incidence
reported in Argentina during the years 1965- Ye?X cases (in thousands)a population
1977, the estimated population in the middle 1965 454 21,595 1.2
of each year, and the tetanus incidence per 1966 565 21,928 1.5
100,000 population (3). As can be seen, ;he 1967 706 22,266 3.1
reported incidence generally fluctuated be- 1968 405 22,602 1.7
1969 348 22,940 1.5
1970 399 23,316 1.7
1971 336 23,722 1.4
‘Also appearing in Spanish in the B&fin de la OJcina 1972 341 24,138 1.4
&~nifark hmamericana 90(6):533-542, 1981. 1973 362 24,563 1.4
*Professor, Department of Preventive and Social Med- 1974 321 24,999 1.2
icine, School of Medicine, University of Buenos Aires, 1975 331 25,383 1.3
Paraguay 2155, Buenos Aires, Argentina. 1976 376 25,719 1.5
3PAHO/WH0 Area III Consultant, P.O. Box 383, 1977 335 26,056 1.3
Guatemala City, Guatemala.
4PAHO/WH0 Area VI Epidemiologist, Marcelo T de aEstnnates based on adjustments to the demographic census of
Alvear 684, Buenos Aires, Argentina. 1970.
328 PAHO BULLETIN l vol. 15, no. 4, 1981
Climate
As many authors have pointed out, high
tetanus incidences are closely associated with hot, humid climates and fertile soil. Thus, the
highest tetanus morbidity and mortality are
generally observed in tropical countries,
where the cold seasons encountered elsewhere
do not exist (I).
Table 2 also shows the influence of climate.
Although provincial incidences within a given
climatic zone may be very different, a general
comparison of rates by type of climate shows
that the highest rates are associated with the
subtropical region, the intermediate rates tend
to be associated with the temperate region,
and the lowest rates occur in the cold region.
Rainfall in Argentina tends to decrease as
one moves from east to west and from north to
south. Whether the countryside consists of
farmlands, grazing areas, or uncultivated ter-
rain depends largely on these rainfall patterns (4). Though it is not possible to precisely cor-
relate the reported incidence rates with such
rainfall and land use patterns, Figure 1 shows that the provinces with the lowest reported in- cidences are in the arid western or southern regions. It should also be noted, however, that
some of the variations found-particularly be-
tween areas with similar climates and land use
patterns-presumably relate to underreport-
ing of the disease.
The Seasons
Epidemiologic studies in various countries
have shown a definite seasonal distribution of
tetanus cases that seems associated with
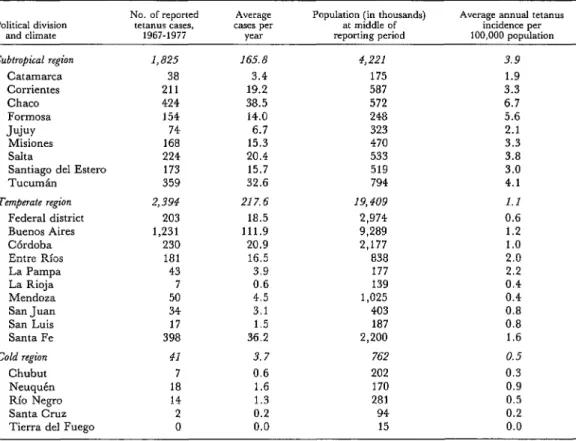
Table 2. Reported tetanus cases by province in 1967-1977, showing basic climatic divisions, average number of cases per year, provincial populations at the middle of the reporting period,
and the average annual tetanus incidence per 100,000 population.
Political division and climate
No. of reported Average Population (in thousands) Average annual tetanus tetanus cases, cases per at middle of incidence per
1967-1977 year reporting period 100,000 population
Subtropical region Catamarca Corrientes Chaco Formosa JOY
Misiones Salta
Santiago de1 Ester-o
TUClUtl~ll
1,825 165.8 4,221 3.9
38 3.4 175 1.9
211 19.2 587 3.3
424 38.5 572 6.7
154 14.0 248 5.6
74 6.7 323 2.1
168 15.3 470 3.3
224 20.4 533 3.8
173 15.7 519 3.0
359 32.6 794 4.1
Temperate region 2,394 217.6 19,409 1.1
Federal district 203 18.5 2,974 0.6
Buenos Aires 1,231 111.9 9,289 1.2
Cordoba 230 20.9 2,177 1.0
Entre Rios 181 16.5 838 2.0
La Pampa 43 3.9 177 2.2
La Rioja 7 0.6 139 0.4
Mendoza 50 4.5 1,025 0.4
San Juan 34 3.1 403 0.8
San Luis 17 1.5 187 0.8
Santa Fe 398 36.2 2,200 1.6
Cold region 41 3.7 762 0.5
Chubut 7 0.6 202 0.3
Neuqutn 18 1.6 170 0.9
Rio Negro 14 1.3 281 0.5
Santa Cruz 2 0.2 94 0.2
Figure 1. Reported tetanus morbidity per 100,000 population, by political divisions,
showing the annual average over the period 1966-1977.
weather, humidity, and farming activities. In
the United States, for example, the highest
tetanus incidence occurs in the summer
months, and this trend is more evident in the northern and western areas than in the south- eastern part of the country.
Heath et al. feel that this difference results
from seasonal variations in the climate and ac-
companying changes in the degree of exposure
to the agent. That is, in the southeastern
United States, where seasonal variations are
less marked, the degree of exposure to the
agent changes less throughout the year (5). In
a similar fashion, Japanese data show that
more patients with tetanus are admitted to
hospitals during the summer months (1). A similar trend can be found by examining hospital admissions for tetanus in the city of
Buenos Aires during the period 1968-1973
(S), as shown in Table 3. If one considers these admissions by quarter, as defined below, the average number of admissions was highest in the first and fourth quarters and lowest in
the second and third. In conformity with the
seasonal pattern of the Southern Hemisphere,
the first quarter includes the hottest months
and the third quarter includes the coldest.
Average no. of Quarter admissions annually,
1968-1973
First (December-February) 38.3
Second (March-May) 32.5
Third (June-August) 27.2
Fourth (September-November) 34.3
Total 132.2
The data thus show a clear seasonal trend,
with maximum values occurring in the sum-
mer months, as shown in Figure 2.
Buenos Aires Morbidity and Mortality
During the 1968-1973 period there were
1,160,028 hospital discharges in the city of
Buenos Aires. The final diag-noses of these
municipal hospital cases indicated that the
cause of admission was tetanus in 802 cases
(0.06 per cent). The case-fatality ratio for tet-
anus in the same hospitals was 35.8 per cent.
One facility, the Muiiiz Hospital, accounted
for 83.3 per cent of all the discharged tetanus patients in this period, even though this hos- pital only cared for 1.3 per cent of the patients
discharged by municipal hospitals in Buenos
Aires. The case-fatality ratio for tetanus cases
at the Muiiiz Hospital in this period was 32.5
per cent (7). Comparable data are not avail-
able for the period 1973-1977 because of seri-
330 PAHO BULLETIN l vol. 15, no. 4, 1981
Table 3. Distribution of tetanus cases admitted to municipal hospitals in Buenos Aires by month, showing seasonal variations.
No of cases per month indicated
Year Jan. Feb. March April May June July Aug. Sept Ott NW Dec.
1968 10
1969 10
1970 17
1971 16
1972 17
1973 8
Total
cases 78
Monthly average 13.0
10 4 6 13 6 8 12 14 11 10 8
15 13 11 19 7 11 7 14 20 15 17
10 11 21 8 15 12 13 14 8 21 23
16 13 10 11 4 10 9 4 12 5 13
8 4 16 9 11 4 14 6 13 11 10
11 9 9 8 7 6 7 10 10 7 11
70 54 73 68 50 51 62 62 74 69 82
11.7 9.0 12.2 11.3 8.3 8.5 10.3 10.3 12.3 11.5 13.7
The Buenos Aires hospital data also show from 8.5 to 17.1 chances in 100,000 of dying
that mortality was many times greater among from tetanus in the first 15 days of life. Such
infants less than 15 days old than it was among findings, together with evidence that neonatal
the population as a whole (Table 4). Accord- tetanus produces a very high case-fatality
ing to these data, the average Buenos Aires ratio, constitute the main reason for advo-
resident had anywhere from 1.3 to 2.3 chances cating prevention of the disease among new-
in 100,000 of dying from tetanus in a year, borns through full immunization of pregnant
while the average newborn had anywhere women.
Figure 2. Seasonal variations in the number of tetanus patients admitted to municipal hospitals in Buenos Aires, by quarter-year, for 1968-1973.
58 +
56 - 54 - 52 - 50 - 48 - i 46- 2 44- ‘% s 42 -
s 40- 5 38 - z 36- z 34- o 32- = 30- 28 - 26 - 24 - 22 - 20 -
. values for writer months l values for summer months
I I I I I I I I I # I t I 0 I I I 1 I I I I I
234 12 34 12 34 12 34 12 34 12 34 - Quarters
Table 4. Tetanus mortality among newborns and the general population at municipal hospitals in Buenos Aires, 1968-1973, by year.
YFAI
1968 1969 1970 1971 1972 1973
Population < 15 days of age Total population
No. of deaths in No. of Deaths per 100,000 No. of deaths Buenos Aires Deaths per 100,000
first I5 days of life newborns newborns per year population population
11 78,666 14.0 40 2,969,974 1.3
9 83,860 10.7 51 2,970,791 1.8
15 87,928 17.1 67 2,893,299 2.3
8 94,128 8.5 44 2,900,284 1.5
9 91,892 9.8 40 2,907,236 1.4
10 - - 45 2,914,204 1.5
Conclusions
The annual incidence of reported tetanus
cases in Argentina, for the period 1965-1977,
ranged from 1.2 to 1.7 per 100,000 inhabit- ants in every year except 1967. The data for
the latter year show a higher incidence (3.1
cases per lOO,OOO), apparently because of a
temporary improvement in the reporting
system. In a similar vein, there is a close cor-
relation between average annual tetanus in-
cidence and major climatic regions, the inci-
dence being highest in the subtropical region,
intermediate in the temperate region, and
lowest in the colder region. Nevertheless, the
data reported by individual provinces within
each region show wide fluctuations from one
province to the next. These two things, the in- creased incidence of 1967 and the provincial
rate variations, both suggest significant defi-
ciencies in the system for registering and re-
porting tetanus cases within the country.
Data from the municipal hospitals of Bue-
nos Aires for 1968-1973 show that the number of tetanus patients tended to increase during the warmer months. They also indicate high
mortality from tetanus among infants less
than 15 days of age. Virtually all of such neo-
natal tetanus morbidity and mortality could
be prevented by immunization of pregnant
women-who at present do not receive satis-
factory tetanus immunization coverage.
SUMMARY
Available data on tetanus in Argentina for the period 1965-1977 indicate an overall national case- rate generally ranging from 1.2 to 1.7 cases per 100,000 inhabitants per year. A close correlation can also be observed between tetanus incidence and climate, the incidence tending to be higher in warmer and wetter areas. In addition, data from Buenos Aires hospitals indicate that a dispropor- tionate share of tetanus cases occur during the sum-
mer (December-February) months.
Taking a closer look at these data, it may be seen that considerable fluctuations occurred among dif- ferent provinces in the same climatic region and
that an unusually high national case-rate of 3.1
cases per 100,000 population was reported in one
year (1967). These findings suggest significant deli- ciencies in the system for registering and reporting tetanus cases in Argentina.
Finally, the Buenos Aires hospital data indicated relatively high mortality from neonatal tetanus, on the order of 9-17 deaths per 100,000 live births, among infants O-14 days of age. Illness and death from this cause could be prevented by immunizing
pregnant women-who at present do not receive
332 PAHO BULLETIN 9 vol. 15, no. 4, 1981
REFERENCES
(1) Bytchenko, B. Geographical distribution of
tetanus in the world, 1951-1960: A review of the
problem. Bull WHO 34:71-104, 1966.
(2) Hawitt, R. L., H. B. Wren, and E. T. Kre- mentz. Recent trends in tetanus. Arch Surg 88:768- 773, 1964.
(3) Argentina, Secretaria de Estado de Salud
Ptiblica. Boletin de notificaciones semanales de enferme- dades transmisibles de la Dire&n de Enfermedades Transmisibles (1965-1977). Buenos Aires, 1965- 1978.
(4) Argentina, Secretaria de Agricultura y Ga- naderia. Informe de la Comisidn de Utilizacidn y Conser- vaci& de1 Suelo, de1 Grupo Mixto Gobierno Argentino- Naciones Unidas, noviembre de 1956. Publication No.
56, Instituto National de Tecnologia Agropecuaria (INTA), Buenos Aires, 1963.
(5) Heath, C. W., J. Zusman, and I. Sherman.
Tetanus in the United States, 1950-1960. Am J
Public Health 54:769-779, 1964.
(6) Argentina, Municipalidad de Buenos Aires.
Boletin de la Dire&k de Estadistica (1968-1973). Buenos Aires, 1968-1974.
(7) Hospital F. J. Muiiiz. Registros clinicos y de la Unidad de Terapia Intensiva Respiratoria para el tttanos (1968-1973). Buenos Aires, 1968-1973.
(8) Argentina, Secretaria de Estado de Salud
Pfiblica, Departamento de Estadistica. Personal
communication, 1978.
HUMAN PLAGUE IN 1980
A total of 505 plague cases and 56 plague-related deaths were reported to
the World Health Organization in 1980. The corresponding figures for
1979 were 881 and 30, respectively. Most of the reported 1980 cases (283)
and deaths (29) occurred in Asia; 80 cases and 20 deaths were reported in
Africa; and 142 cases and seven deaths were reported in the Americas.
The 1980 figures for the Americas indicate a recrudescence since 1979,
when 23 cases and two deaths were reported. The increase in morbidity was
due to an outbreak in Brazil (98 cases but no deaths), which was most
marked in the northeastern states of Ceara, Bahia, and Pernambuco.
Between September and November 1980 a total of 26 cases, two of them
fatal, were observed in Bolivia’s La Paz Department, in the localities of
Mohima (20 cases) and Culata (6 cases) in Franz Tamayo Province. A high
density of the flea Pulex irritans was found in these two localities.
In the United States, the three states of New Mexico, Nevada, and Cali-
fornia reported 18 cases and five deaths in 1980. Thirteen of these cases oc-
curred in six New Mexico counties between May and September.