FREE THEMES
1 Instituto de Nutrição, Universidade do Estado do Rio de Janeiro. R. São Francisco Xavier 524/12º/ Bloco E/sala 12.007, Maracanã. 20559-900 Rio de Janeiro RJ Brasil. [email protected] 2 Instituto de Saúde e Sociedade, Universidade Federal de São Paulo. São Paulo SP Brasil.
Dietary practices of quota and non-quota students
at a Brazilian public university
Abstract Abstract: Dietary practices of college students were described and examined according to the means by which they were admitted to the university (quota and non-quota students). A cross-sectional study was conducted with under-graduates (n = 1336) at a public university using a self-administered and identified questionnaire that inquired about their habits of eating breakfast and substituting lunch and/or dinner with snacks as well as the regular consumption (≥ 5 times a week) of markers for healthy and unhealthy eat-ing. Analysis of the association between means of admission to the university and dietary practices was done using univariate and multivariate logis-tic regression models. It was observed that signifi-cant proportions of the students did not eat break-fast; substituted dinner with snacks; had low fruit, vegetable and bean consumption; and frequently consumed sugary beverages, sweets, cookies and packaged salty snacks. The quota students were found to more frequently consume beans, cookies and packaged salty snacks and less frequently sub-stitute dinner with snacks and consume vegetables and fruits. Quota and non-quota students had some similarities in their dietary practices that were unhealthy. The differences observed between the two groups were largely more unfavorable for the quota students, with the exception of bean consumption.
Key words Food consumption, Dietary habits,
Students, Public policy Patrícia Maria Périco Perez 1
P
e
r
ez PMP
Introduction
The promotion of healthy dietary practices is currently a priority on the public policy
agen-da for health, food and nutrition in Brazil1. The
dietary practices of young adults (on which this study focuses) are influenced by the environment in which they are placed, as occurs with other
population groups2. Promoting these practices in
organizational settings is an action highlighted
in the National Food and Nutrition Policy1, the
National Health Promotion Policy3, affirmative
action policies4, and the National Food and
Nu-trition Security System5, in accordance with
poli-cies proposed by the World Health Organization, which point to school, community and work settings as important places that are strategic to
promoting healthy eating6.
The university setting merits particular at-tention, as many dietary habits that students ac-quire there continue into adult life, representing
a unique opportunity to promote healthy eating7.
For many students, attending a university rep-resents the first occasion in which they need to take responsibility for their own housing, food and time and financial management. An inabil-ity to handle such tasks may result in skipping meals and eating snacks, thus leading to the
nutritional inadequacy of the food consumed8.
Studies focusing on university students are still scarce. However, various studies have suggested that such students exhibit inappropriate dietary
patterns8-11.
In Brazil in recent years, the university set-ting has become even more strategic as a place to promote healthy eating and food and
nutrition-al security4, as affirmative action measures have
been implemented that provide university access to individuals who have historically been
exclud-ed12. This has been achieved through systems that
prioritize admission according to various criteria: economic (income), racial (black people), school-ing (havschool-ing studied in public schools) and others. The most well-known practice is the system in which university spaces are reversed via quotas. Studies have shown that these policies have been successful in enabling admission to universities but that they have been less effective in ensuring that the students will remain in the institutions
until graduatoin4,12. An effective policy to ensure
that students admitted through the quota system remain enrolled presupposes a guarantee of ac-cess to permanence scholarships, meals (in a uni-versity restaurant), student housing, books and
media in general, among other resources12.
In 2003, the State University of Rio de Janeiro – SURJ (the location of the present study) im-plemented a quota system for admissions via en-trance exam. It was the first Brazilian public uni-versity to adopt this affirmative action measure. In 2011 (the year the present study was conduct-ed), measures were developed to promote the permanence of quota students at the university, including the provision of books and the offer-ing of permanence scholarships. Food provision measures such as opening a university restaurant were not considered.
Until the time of the present study, no study had been published about the dietary practices of the groups affected by this affirmative action measure in Brazil that could support measures aimed at ensuring food and nutritional security as an element of an effective permanence policy. The present study aimed to describe the dietary prac-tices of SURJ students and examine them accord-ing the means by which they were admitted to the university (through quotas or otherwise) with the objective of identifying whether or not there were differences in relation to these practices.
Methods
Study design and population
This is a cross-sectional study aimed at the environment of students who enrolled in the first semester of 2011 in 31 undergraduate disciplines among the 24 academic units located on the cen-tral SURJ campus and who took classes in the second period of the day at the time of data col-lection. These students were selected due to the fact that their academic activities were concen-trated on campus at the beginning of their col-lege studies. In addition, they were already accus-tomed to life at SURJ since they had experienced the university setting for at least six months and thus had adapted their dietary routines to this new stage in their lives.
Data collection
aúd
e C
ole
tiv
a,
21(2):531-542,
2016
The lists of the students enrolled in the ac-ademic departments as well as the class days, times and locations for each major included in the study were accessed through the university’s Undergraduate Academic System and with the assistance of the department coordinators.
At the beginning of each class, trained re-searchers gave self-applied questionnaires to the students who had agreed to participate and had signed the Free and Clear Consent Form. The students took between 10 and 15 minutes to complete the questionnaire. The classes were vis-ited an average of 5.3 times in different depart-ments and at different times in order to include as many students as possible.
Questionnaire
The data collection instrument was a self-ad-ministered questionnaire that was developed based on the instruments used in surveillance systems for risk factors directed at the youth of
other countries13,14, Brazilian adolescents15, and
Brazilian adults16.It had previously been tested
with nutrition students who were enrolled in the university in the second semester of 2010 (n = 21). Terms and/or words that were not clearly understood by the students were revised (e.g. the definitions of lunch, dinner and sweets). The final version of the questionnaire was comprised of 39 questions that inquired about the identification and characterization of the student and his/her dietary practices, including dietary routine and consumption of certain foods (including food groups or preparations) in the seven days pre-ceding the data collection. The question’s struc-ture was: “In the last seven days, on how many days did you eat (type of food)?” The response options were: “It did not eat (type of food) in the last seven days”, “On one day in the last seven days”, “On two days in the last seven days”, “On three days in the last seven days”, “On four days in the last seven days”,
“On five days in the last seven days”, “On six days in the last seven days” and “Every day in the last seven days”.
The dietary routines considered were: 1) eat-ing each of the three meals and 2) substituteat-ing lunch and/or dinner with a snack. Eating each of the three meals was included as a study topic based on the Food Guide for the Brazilian Pop-ulation in effect at the time, which recommend-ed eating three meals per day, interspersrecommend-ed with
small snacks17. Furthermore, there is evidence
that eating breakfast frequently is associated with
a lower risk for overweight and obesity18 and an
improvement in scholastic performance19. The
practice of substituting lunch and/or dinner with a snack was also examined because this prac-tice has been shown to be associated with
over-weight and obesity10,20. The foods selected were
those considered to be markers for healthy eating (HEM) and unhealthy eating (UHEM). This se-lection was based on nutritional recommenda-tions for a healthy diet as well as evidence that suggests an association between these variables
and risk factors for chronic disease6,21,22.
Study variables and indicators
The following socio-demographic variables were studied: means of admission to the uni-versity (with or without a reserved space, in which two categories were adopted: quota stu-dents and non-quota stustu-dents, assuming that the quota students had a lower socio-economic level in light of the criteria set for the space res-ervation policy previously described); sex; age
(categorized as ≤ 18; 19; 20 - 22; > 22 years old
a posteriori, according to the age distribution observed for the group of students studied); do-mestic arrangement in regard to the sharing of housing (living alone, with family, with friend(s) or with partner); mother’s schooling (none, did not complete elementary school, completed el-ementary school, did not complete high school, completed high school, did not complete college and completed college); and the presence of the following possessions and services: landline tele-phone, computer, home internet access and hav-ing a bathroom in the home. These possessions and services were selected due to their greater discriminatory power in relation to others (e.g. refrigerator, television and stove) as evidenced in the the 2009 National School Health Study da-tabase, which serves as a basis for the risk factor and health protection monitoring system for ad-olescents and includes students in the last year of elementary school.
P
e
r
ez PMP
adopted as a healthy eating marker (HEM) while the habit of substituting lunch and/or dinner with a snack was adopted as an unhealthy eating marker (UHEM).
In regard to food consumption, 13 foods, food groups and preparations were analyzed for the seven days preceding the study inside and/ or outside the academic environment: beans; vegetables in general (excluding roots and tu-bers); raw vegetables; cooked vegetables; fruits in their natural form; French fries and/or fried snacks; hamburger and/or sausage; packaged salty snacks; crackers; cookies; sweets (candy, chocolate, gum, lollipops, etc.); soft drinks; and sugary drinks,, excluding drinks containing milk or yogurt and including soft drinks, juices, mate tea, natural guaraná, other teas, coffee, flavored waters, sports drinks and soy-based drinks. The first five foods were considered to be healthy eat-ing markers (HEM) while the last eight foods were considered to be unhealthy eating markers (UHEM).
Based on the weekly frequency that each of the foods, food groups and/or selected prepara-tions was consumed, two types of indicators were created: (1) percentage distribution of weekly frequency of consumption of each food and (2) proportion of the students who consumed each food more regularly (on at least five of the seven days preceding the data collection) and less regu-larly (on between zero and four of the preceding
seven days)23. Similar indicators were developed
for the dietary routines.
Data Analysis
The students’ socio-economic conditions were characterized according to their means of admission to the university. The frequencies of food consumption and of the variables about the students’ dietary routines were estimated for the total population and according to the means of university admission. The statistical significance of the differences between the quota students and the non-quota students in regard to their socio-demographic characteristics was assessed using the chi-square test. The critical level for identifying significant differences was 0.05.
Analysis of the association between means of university admission (independent variable) and
each of the regular dietary practices ((≥ 5 days in
the week) (dependent variable) was done using univariate and multivariate logistical regression models (the latter considered student sex and age group as co-variables), which generated gross
and adjusted odds ratios and their respective 95% confidence intervals.
Data entry was done by independent typists
and was double-verified using Microsoft Excel®
2007. Data analysis was performed with the sup-port of the Statistical Package for the Social Sci-ences (SPSS) v. 21.0.
Ethical aspects
The present study was approved by the Ethics Commission of the office of the SURJ Vice-Chancellor for Post-Graduate Studies and Research under Opinion No. 037/2011. Students who participated in the study agreed to do so and signed a Free and Clear Consent Form.
Results
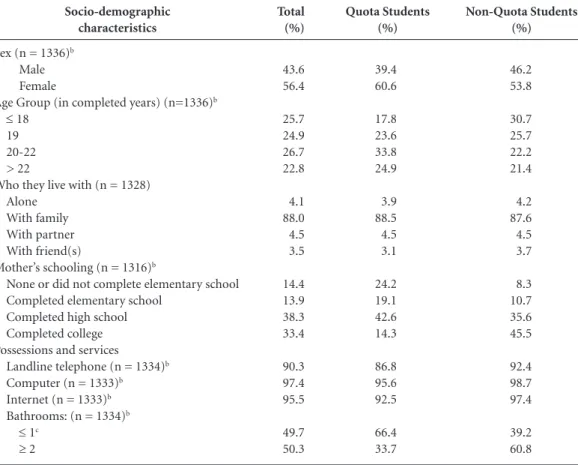
Of the 1508 students who enrolled in the first se-mester of 2011 (according to official SURJ data), 1336 (88.6%) were studied. Reasons for non-par-ticipation in the study were an inability to locate a student (n = 138) and refusal to participate (n = 34). Of all the individuals studied, 38.8% were quota students and 61.2% were non-quota stu-dents. Their socio-demographic characteristics are presented in Table 1. Most of them were fe-male (56.4%); lived with their families (88%); had a landline telephone, computer and internet access at home (more than 90%); had a mother who had at least completed high school (71.7%); and around half (50.6%) were aged 19 or less and had at least two bathrooms at home (50.3%).
With the exception of domestic arrangement in regard to the sharing of housing, the two stud-ied groups differed in regard to all of the socio-de-mographic variables studied. The group of quota students had a greater proportion of females and a lesser proportion of individuals whose mothers had completed high school (56.9% of the quota students vs. 81.1% of the non-quota students), who had the possessions and services studied and who had at least two bathrooms at home. In ad-dition, a greater proportion of the quota students were 20 years of age or older (Table 1). The mean age of this group was 21.61 (SD = 5.04) while the mean age of the non-quota students was 21.47 (SD = 6.00) – i.e. there was no significant statisti-cal difference between the two groups.
aúd
e C
ole
tiv
a,
21(2):531-542,
2016
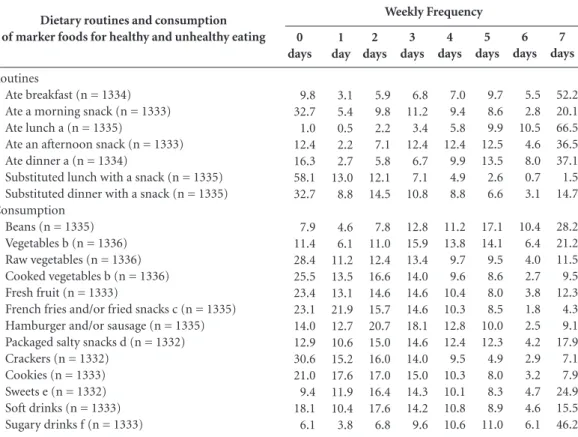
(37.1%) ate dinner daily. It was also found that the practice of having an afternoon snack was more common than having a morning snack and that substituting dinner with a snack was more common than substituting lunch with a snack (Table 2).
In terms of food consumption, a lower dai-ly consumption frequency was observed for the HEM foods (beans, vegetables and fruits). It merits highlighting the proportion of students who reported not eating any of these foods or eating them on only one or two days of the week (20.3%, 28.5% e 51.1%, respectively). On the other hand, the daily consumption of sugary drinks (46.2%), sweets (24.9%), and packaged salty snacks (17.9%) was found to be common (Table 2).
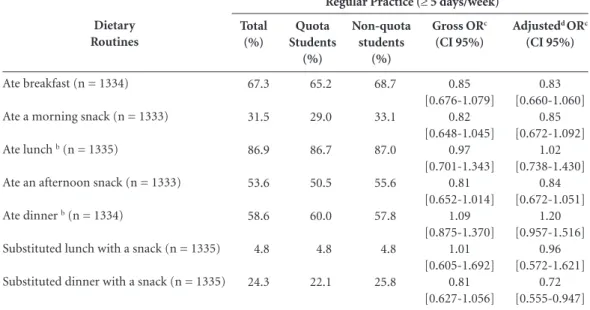
Eating breakfast, substituting lunch with a snack and substituting dinner with a snack on
at least five days of the week were recorded for 67.3%, 4.8% and 24.3% of the students, respec-tively. No statistically significant differences were observed between the quota and non-quota stu-dents in the univariate regression models. These results held up after adjustment, with the excep-tion of substituting dinner with a snack, which was less common among the quota students
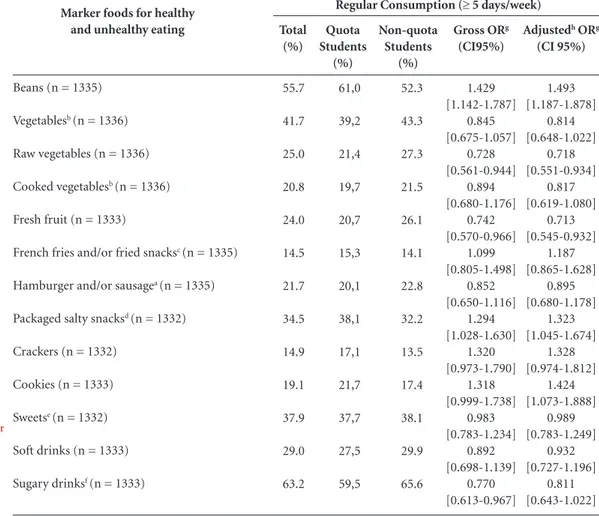
(Table 3).The frequency of regularly eating (≥ 5
days/week) the HEM foods varied from 20.8% (cooked vegetables) to 55.7% (beans). The con-sumption frequency for the UHEM foods varied from 14.5% (French fries and/or fried snacks) to 63.2% (sugary drinks). A greater proportion of the quota students regularly ate beans and pack-aged salty snacks while a greater proportion of the non-quota students regularly ate raw vegeta-bles, fruit and sugary drinks (showing statistical-ly significant differences) (Table 4). These results
Non-Quota Students (%)
46.2 53.8
30.7 25.7 22.2 21.4
4.2 87.6 4.5 3.7
8.3 10.7 35.6 45.5
92.4 98.7 97.4
39.2 60.8
Socio-demographic characteristics
Sex (n = 1336)b Male Female
Age Group (in completed years) (n=1336)b
≤ 18
19 20-22 > 22
Who they live with (n = 1328) Alone
With family With partner With friend(s)
Mother’s schooling (n = 1316)b
None or did not complete elementary school Completed elementary school
Completed high school Completed college Possessions and services
Landline telephone (n = 1334)b Computer (n = 1333)b Internet (n = 1333)b Bathrooms: (n = 1334)b
≤ 1c
≥ 2
Table 1. Socio-demographic characteristics of students who enrolled in the State Unitversity of Rio de Janeiro in the first semester of 2011, according to means of admissiona to the university. Rio de Janeiro, Brasil, 2012.
Total (%)
43.6 56.4
25.7 24.9 26.7 22.8
4.1 88.0 4.5 3.5
14.4 13.9 38.3 33.4
90.3 97.4 95.5
49.7 50.3
Quota Students (%)
39.4 60.6
17.8 23.6 33.8 24.9
3.9 88.5 4.5 3.1
24.2 19.1 42.6 14.3
86.8 95.6 92.5
66.4 33.7
P
e
r
ez PMP
held up after adjusting for confounding factors, except for sugary drinks and cookies.
Discussion
The following unhealthy practices were observed in significant proportions of the young adults studied: not eating breakfast; substituting dinner for a snack; low consumption of fruit, vegetables and beans; and frequent consumption of sugary drinks, sweets and packaged salty snacks. Quota students and non-quota students presented gen-erally similar dietary practices. However, when differences did exist, they usually tended to be less favorable for the quota students. Although this group ate beans more frequently and sub-stituted dinner with a snack less frequently, it was observed that they ate fruit and vegetables less frequently and ate packaged salty snacks and cookies more frequently.
The comparison of our findings for the group of individuals studied with those of other studies is limited due to differences in the socio-demo-graphic characteristics of the groups studied, the questionnaire and the construction of the dietary and socio-economic indicators used. Even so, certain results merit highlighting. In general, our findings agree with those of the 2008-2009
Fam-ily Budget Survey24, which showed that the
tradi-tional Brazilian diet has been largely displaced by a diet rich in ultra-processed ready-to-consume
products25,26 in all population age groups and at
different socio-economic levels.
Studies conducted with university students in relation to HEM foods have shown that the insufficient consumption of fruit and vegetables has also been recorded in various settings both
in Brazil and in other countries8,9,11,27,28. Only one
study (conducted in the Brazilian state of
Ser-gipe)27 analyzed the frequency of bean
consump-tion among university students. Its results show
Dietary routines and consumption of marker foods for healthy and unhealthy eating
Routines
Ate breakfast (n = 1334) Ate a morning snack (n = 1333) Ate lunch a (n = 1335)
Ate an afternoon snack (n = 1333) Ate dinner a (n = 1334)
Substituted lunch with a snack (n = 1335) Substituted dinner with a snack (n = 1335) Consumption
Beans (n = 1335) Vegetables b (n = 1336) Raw vegetables (n = 1336) Cooked vegetables b (n = 1336) Fresh fruit (n = 1333)
French fries and/or fried snacks c (n = 1335) Hamburger and/or sausage (n = 1335) Packaged salty snacks d (n = 1332) Crackers (n = 1332)
Cookies (n = 1333) Sweets e (n = 1332) Soft drinks (n = 1333) Sugary drinks f (n = 1333)
Table 2. Percentage distribution of the weekly frequency of dietary routines and consumption of marker foods
for healthy and unhealthy eating in the previous seven days. Students who enrolled in the State University of Rio de Janeiro in the first semester of 2011. Rio de Janeiro, Brasil, 2012.
0 days 9.8 32.7 1.0 12.4 16.3 58.1 32.7 7.9 11.4 28.4 25.5 23.4 23.1 14.0 12.9 30.6 21.0 9.4 18.1 6.1
a Meal containing rice with beans and/or meat and salad and/or cooked vegetables; soup; pasta, among others, excluding sandwiches. b Excluding potatoes, cassava and yams (roots and tubers). c Excluding packaged potato chips. d Including packaged potato chips. e Sweets, candies, gum, lollipops, chocolates, etc. f Soft drinks, juices, mate tea, natural guaraná, other teas, coffee, flavored waters, sports drinks and soy-based drinks, excluding drinks with milk and yogurt.
aúd
e C
ole
tiv
a,
21(2):531-542,
2016
that a greater proportion of students in Sergipe regularly consume this food compared with uni-versity students in Rio de Janeiro.
In regard to UHEM foods, our findings agree with other studies conducted with university students that report a high level of consumption
for sweets/soft drinks8-11,27, cookies and other
ul-tra-processed foods10.
The finding that about one-third (32.7%) of the individuals studied did not regularly eat breakfast was similar to those of other studies with university students conducted in Viçosa, MG and Campinas, SP, Brazil, between 1998 and
20049,29. The finding that a significant portion
of the group studied substituted dinner with a snack agrees with the findings of a study con-ducted with university students in the state of Minas Gerais, in which 49% of the students pre-ferred to have a snack instead of eating dinner, even when this meal was offered to them at the
university restaurant at a subsidized price9.
Studies have shown that the university en-vironment and routine can make it difficult to have a healthy diet due to various factors (e.g. tight scheduling of activities, behavioral changes, inappropriate time management and economic
difficulties). These conditions lead to students opting for quick snacks to the detriment of healthy preparations, having meals at irregular
times and skipping meals8,26,29,30.
Our findings also agree with those of Vigitel – a surveillance system of risk factors for and pro-tection against chronic diseases aimed at adults
in the Brazilian federal and state capitals16. To
en-hance the comparability of Vigitel’s results with ours, we have extracted information from its 2010 database (available at: http://tabnet.datasus. gov.br/cgi/dh.exe?vigitel/vigitel10.def) about the regular consumption of four of the seven foods/ food groups examined in our study [beans, fruits, vegetables and sugary drinks (soft drinks and ar-tificial juices)] for young adults aged 18-24 and for young adults aged 18-24 with twelve or more years of schooling in Brazil as a whole and in the areas available on the system [region (in this case, the Southeast) and city (in this case, Rio de Ja-neiro)].
In general, the proportion of students who regularly consumed beans and vegetables was smaller than that of young adults aged 18-24 both in the Brazilian capitals and in the two ar-eas examined. This difference may be partially
Dietary Routines
Ate breakfast (n = 1334)
Ate a morning snack (n = 1333)
Ate lunch b (n = 1335)
Ate an afternoon snack (n = 1333)
Ate dinner b (n = 1334)
Substituted lunch with a snack (n = 1335)
Substituted dinner with a snack (n = 1335)
Table 3. Frequency (%) of regular healthy and unhealthy routines (≥ 5 days in the week) according to means of
admissiona to the university. Students who enrolled in the State University of Rio de Janeiro in the first semester of 2011. Rio Janeiro, Brasil, 2012.
Total (%)
67.3
31.5
86.9
53.6
58.6
4.8
24.3
a Quota students – students admitted to the university by entrance exam through a system of reserving spaces according to quotas based on racial and social criteria. Non-quota students – students admitted to the university by entrance exam through the standard system. b Meal containing rice with beans and/or meat and salad and/or cooked vegetables; soup; pasta, among others, excluding sandwiches. c Odds ratio. d Adjustment according to sex and age group, considering non-quota students as the base category.
Quota Students
(%)
65.2
29.0
86.7
50.5
60.0
4.8
22.1
Non-quota students
(%)
68.7
33.1
87.0
55.6
57.8
4.8
25.8
Gross ORc
(CI 95%)
0.85 [0.676-1.079]
0.82 [0.648-1.045]
0.97 [0.701-1.343]
0.81 [0.652-1.014]
1.09 [0.875-1.370]
1.01 [0.605-1.692]
0.81 [0.627-1.056]
Adjustedd ORc
(CI 95%)
0.83 [0.660-1.060]
0.85 [0.672-1.092]
1.02 [0.738-1.430]
0.84 [0.672-1.051]
1.20 [0.957-1.516]
0.96 [0.572-1.621]
0.72 [0.555-0.947]
P
e
r
ez PMP
explained by the fact that the two groups do not necessarily have the same age distribution. In our study, for example, close to half of the students were under 20 years of age and may have had di-etary practices that are more similar to those of adolescents than of young adults. The results of various national and international studies con-ducted with adolescents have conclusively shown that the dietary practices adopted by these young adults are characterized by diets rich in fat, sug-ar and sodium and a low consumption of fruit, vegetables, milk and dairy products compared to
older adults31-33.
Also in regard to the dietary profile of the set of individuals studied, a deepening of the dis-cussion about the consumption of sugary drinks (including soft drinks) is merited. The high fre-quency (63.2%) of sugary drink consumption found is in accordance with the findings of other national and international studies, which indi-cate that the majority of young adults consume
excessive amounts of these products34,35.
Furthermore, it is noteworthy that our study found the regular consumption of sugary drinks to be nearly twice as frequent as that of soft drinks. These findings corroborate evidence that
Marker foods for healthy and unhealthy eating
Beans (n = 1335)
Vegetablesb (n = 1336)
Raw vegetables (n = 1336)
Cooked vegetablesb (n = 1336)
Fresh fruit (n = 1333)
French fries and/or fried snacksc (n = 1335)
Hamburger and/or sausagea (n = 1335)
Packaged salty snacksd (n = 1332)
Crackers (n = 1332)
Cookies (n = 1333)
Sweetse (n = 1332)
Soft drinks (n = 1333)
Sugary drinksf (n = 1333)
Table 4. Frequency (%) of regular consumption (≥ 5 days in the week) of marker foods for healthy and
unhealthy eating, according to means of admissiona to the university. Students who enrolled in the State University of Rio de Janeiro in the first semester of 2011. Rio Janeiro, Brasil, 2012.
Total (%)
55.7
41.7
25.0
20.8
24.0
14.5
21.7
34.5
14.9
19.1
37.9
29.0
63.2
a Quota students – students admitted to the university by entrance exam through a system of reserving spaces according to quotas based on racial and social criteria. Non-quota students – students admitted to the university by entrance exam through the standard system. b Excluding potatoes, cassava and yams (roots and tubers). c Excluding packaged potato chips. d Including packaged potato chips. e Sweets, candies, gum, lollipops, chocolates, etc. f Soft drinks, juices, mate tea, natural guaraná, other teas, coffee, flavored waters, sports drinks and soy-based drinks, excluding drinks with milk and yogurt. g Odds ratio. h Adjustment according to sex and age group, considering non-quota students as the base category.
Quota Students
(%)
61,0
39,2
21,4
19,7
20,7
15,3
20,1
38,1
17,1
21,7
37,7
27,5
59,5
Non-quota Students
(%)
52.3
43.3
27.3
21.5
26.1
14.1
22.8
32.2
13.5
17.4
38.1
29.9
65.6
Gross ORg
(CI95%)
1.429 [1.142-1.787]
0.845 [0.675-1.057]
0.728 [0.561-0.944]
0.894 [0.680-1.176]
0.742 [0.570-0.966]
1.099 [0.805-1.498]
0.852 [0.650-1.116]
1.294 [1.028-1.630]
1.320 [0.973-1.790]
1.318 [0.999-1.738]
0.983 [0.783-1.234]
0.892 [0.698-1.139]
0.770 [0.613-0.967]
Adjustedh ORg
(CI 95%)
1.493 [1.187-1.878]
0.814 [0.648-1.022]
0.718 [0.551-0.934]
0.817 [0.619-1.080]
0.713 [0.545-0.932]
1.187 [0.865-1.628]
0.895 [0.680-1.178]
1.323 [1.045-1.674]
1.328 [0.974-1.812]
1.424 [1.073-1.888]
0.989 [0.783-1.249]
0.932 [0.727-1.196]
0.811 [0.643-1.022]
Regular Consumption (≥ 5 days/week)
aúd
e C
ole
tiv
a,
21(2):531-542,
2016
soft drink consumption is being displaced by the consumption of other sugary drinks of low
nu-tritional value34,36.
An examination of the results presented here according to the students’ means of admission leads us to reflect on the relationship between socio-economic level and dietary practices. Not-withstanding the methodological differences be-tween our study and others, we observe conver-gent results with studies conducted with youth and adults. Similarly to our study, other studies have shown that individuals (adolescents and/or adults) at higher socio-economic levels
general-ly consume more fruits5,28,37,38, vegetables15,28,37,38
and—to a lesser extent--beans15,37 compared to
those of lower socio-economic levels. On the other hand, we found controversial results in re-gard to the consumption of sweets. While our findings showed similar consumption patterns between the two groups, we identified a study that showed more frequent consumption among
adolescents of higher socio-economic levels39 and
another study that indicated a more frequent con-sumption among those of lower socio-economic
levels15. Furthermore, while we observed that the
practice of eating breakfast was similar between the two groups, other studies have observed a di-rect association between socio-economic level and
this practice among adolescents and adults15,38.
Another aspect that merits comment is the fact that our study found soft drink and sug-ary drink consumption to be similar between quota students and non-quota students while other studies have found a higher consumption of these products among individuals of higher
socio-economic status15,37,39. In addition, we
ob-served an inverse association between the regular consumption of cookies and socio-economic lev-el while other studies have found a direct
associ-ation between the two15,38.
In summary, our results converge with those of other studies in regard to the association be-tween socio-economic level and the consump-tion of fruits and vegetables (direct) and of beans (inverse). This finding demonstrates the com-plexity of the relationship between socio-eco-nomic level and dietary practices as well as the influence that different life contexts and phases can exert on them. It also points to the impor-tance of understanding how this association plays out in different realities.
With regard to this study’s methodological aspects, it is worth mentioning the limitations and choice potentiality of a closed questionnaire covering specific foods to characterize the dietary
practices of the studied group. On one hand, it is a fact that such a questionnaire doesn’t cover the entire dietary scope of the studied group. On the other hand, similar questionnaires that have focused on the consumption of healthy and un-healthy eating marker foods on the seven days preceding data collection have demonstrated great discriminatory power in characterizing
di-etary practices among adults16 as well as dietary
practices and patterns among adolescents40,41.
Instruments structured as described above have
been recently validated among adults42 and
ad-olescents43. In addition, the application of these
questionnaires has operational advantages in the context of the study presented here—i.e. the use of a self-administered questionnaire togeth-er with a large numbtogeth-er of individuals in a short period of time.
A positive aspect of this study is that it covered a significant proportion (88.6%) of the group to be studied. Another favorable aspect is that the proportionality between the quota students and the non-quota students in the study (38.8% vs. 61.2%) is similar to that of the entire university
student body (35.7% vs. 64,3%)44, which suggests
that there was no selective loss.
Nevertheless, it is worth commenting on the fact that this study was limited to the students attending courses offered at the university’s cen-tral campus. Although this campus accounts for 75.0% of all students enrolled in the university, the present study did not consider those students who attend other campuses that are located in cities with different characteristics from those of Rio de Janeiro. These cities generally have a low-er quality of life, as measured by the Municipal Human Development Index (MHDI), such as in the case of the cities of Duque de Caixas and São Gonçalo (which have MHDI scores of 0.711 and 0.739, respectively, compared with 0.799 for Rio
de Janeiro)45, or are located in more outlying
ar-eas of the metropolitan region, as is the case for the cities of Nova Friburgo and Resende. There-fore, one cannot rule out the possibility that the students at these campuses have different dietary practices from those of the group studied.
P
e
r
ez PMP
eating and food and nutritional security for this population group. From this perspective, it is worth noting that, following the completion of this study, SURJ opened a university restaurant that offers meals at subsidized prices for all
stu-Collaborations
PMP Perez and IRR Castro contributed to de-signing the study, supervising the field work, an-alyzing the database and revising the manuscript. AS Franco participated in supervising the field work, analyzing the database and revising the manuscript. DH Bandoni participated in design-ing the study, analyzdesign-ing the database and revisdesign-ing the manuscript. DB Wolkoff participated in de-signing the study, supervising the field work and revising the manuscript.
Acknowledgements
We would like to thank the Nutrition Institute of the State University of Rio de Janeiro (SURJ) for its logistical support for our field work, as well as the undergraduate students in the SURJ Nu-trition Department who served as volunteer re-searchers for the field work.
aúd
e C
ole
tiv
a,
21(2):531-542,
2016
Brasil. Ministério da Educação, Ministério da Saúde (MS). Gabinete do Ministro. Guia alimentar para a população brasileira: promovendo a alimentação sau-dável. Brasília: MS; 2005. Série A. Normas e Manuais Técnicos.
Levin KA, Kirby J. Irregular breakfast consumption in adolescence and the family environment: Underlying causes by family structure. Appetite 2012; 59(1):63-70. Nicklas TA, Morales M, Linares A, Yang SJ, Baranowski T, De Moor C, Berenson G. Children’s meal patterns have changed over a 21-year period: the Bogalusa heart study. J Am Diet Assoc 2004; 104(5):753-761.
Brunt AR, Rhee YS. Obesity and lifestyle in U.S. college students related to living arrangements. Appetite 2008; 51(3):615-621.
Malik VS, Schulze MB, Hu FB. Intake of sugar-sweet-ened beverages and weight gain: a systematic review. Am J Clin Nutr 2006; 84(2):274-288.
Dauchet L, Amouyel P, Hercberg S, Dallongeville J. Fruit and vegetable consumption and risk of coronary heart disease: a meta-analysis of cohort studies. J Nutr 2006; 136(10):2588-2593.
Castro IRR, Cardoso LO, Engstrom EM, Levy RB, Mon-teiro CA. Vigilância de fatores de risco para doenças não transmissíveis entre adolescentes: a experiência da cidade do Rio de Janeiro, Brasil. Cad Saude Publica 2008, 24(10):2279-2288.
Instituto Brasileiro de Geografia e Estatística (IBGE). Pesquisa de Orçamentos Familiares 2008-2009 - Avalia-ção nutricional da disponibilidade domiciliar de alimen-tos no Brasil. Rio de Janeiro: IBGE; 2010.
Monteiro CA, Levy RB, Claro RM, Castro IRR, Cannon G. A new classification of foods based on the extent and purpose of their processing. Cad Saude Publica 2010;26(11):2039-2049.
Brasil. Ministério da Saúde (MS). Secretaria de Aten-ção à Saúde. Departamento de AtenAten-ção Básica. Guia alimentar para a população brasileira. 2ª ed. Brasília: MS; 2014.
Feitosa EPS, Dantas CAO, Andrade-Wartha ERS, Mar-cellini PS, Mendes-Netto RS. Hábitos alimentares de estudantes de uma universidade pública no nordeste, Brasil. Rev Alim Nutr 2010; 21(2):225-230.
Ramalho AA, Dalamaria T, Souza OF. Consumo regu-lar de frutas e hortaliças por estudantes universitários em Rio Branco, Acre, Brasil: prevalência e fatores asso-ciados. Cad Saude Publica 2012; 28(7):1405-1413 Alves HJ, Boog MCF. Comportamento alimentar em moradia estudantil: um espaço para promoção da saú-de. Rev Saude Publica 2007; 41(2):197-204.
Fabián C, Pagán I, Rios JL, Betancourt J,Cruz SY, Gon-zález AM, Palacios C, GonGon-zález MJ, Rivera-Soto WT. Dietary patterns and their association with sociode-mographic characteristics and perceived academic stress of college students in Puerto Rico. PR Health Sci J 2013; 32(1):36-43.
Leal GVS, Philippi ST, Matsudo SMM, Toassa EC. Con-sumo alimentar e padrão de refeições de adolescentes, São Paulo, Brasil. Rev Bras Epidemiol 2010; 13(3):457-467.
Hoppu U, Lehtisalo J, Tapanainen H, Pietinen P. Di-etary habits and nutrient intake of Finnish adolescents. Public Health Nutr 2010; 13(6):965-972.
17.
18.
19.
20.
21.
22.
23.
24.
25.
26.
27.
28.
29.
30.
31.
32. References
Brasil. Ministério da Saúde (MS). Secretaria de Aten-ção à Saúde. Departamento de AtenAten-ção Básica. Política Nacional de Alimentação e Nutrição. 3ª ed. Brasília: MS; 2012. Série B. Textos Básicos de Saúde.
Van Der Horst K, Oenema A, Ferreira I, Wendel-Vos W, Giskes K, Van Lenthe F, Brug J. A systematic review of environmental correlates of obesity-related dietary be-haviors in youth. Health Educ Res 2007; 22(2):203-226. Brasil. Ministério da Saúde (MS). Secretaria de Atenção à Saúde. Departamento de Atenção Básica. Política Na-cional de Promoção da Saúde. 3 ed.. Brasília: MS; 2010. Série B. Textos Básicos de Saúde.
Sousa LP, Portes EA. As propostas de políticas/ações afirmativas das universidades públicas e as políticas/ ações de permanência nos ordenamentos legais. Rev Bras Estud Pedagog 2011; 92(232):516-541.
Brasil. Presidência da República. Casa Civil. Lei nº 11.346, de 15 de setembro de 2006. Cria o Sistema Na-cional de Segurança Alimentar e NutriNa-cional - SISAN com vistas em assegurar o direito humano à alimen-tação adequada. Brasília: Diário Oficial da União 2006; 18 set.
World Health Organization (WHO). Diet, nutrition and the prevention of chronic diseases. Geneva: WHO; 2003.
Haberman S, Luffey D. Weighing in college students’ diet and exercise behaviors. J Am Coll Health 1998; 46(4):189-191.
Duarte FM, Almeida SDS, Martins KA. Alimentação fora do domicílio de universitários de alguns cursos da área da saúde de uma instituição privada. O Mundo da Saúde 2013; 37(3):288-298.
Vieira VCR, Priore SE, Ribeiro SMR, Franceschini SCC, Almeida LP. Perfil socioeconômico, nutricional e de saúde de adolescentes recém-ingressos em uma uni-versidade pública brasileira. Rev Nutr 2002; 15(3):273-282.
Papadaki A, Hondros G, Scott JA, Kapsokefalou M. Eat-ing habits of University students livEat-ing at, or away from home in Greece. Appetite 2007; 49(1):169-176. Marcondelli P, Costa THM, Schmitz BAS. Nível de atividade física e hábitos alimentares de universitários do 3º ao 5º semestres da área da saúde. Rev Nutr 2008; 21(1):39-47.
Santos JT. Ações afirmativas e educação superior nas universidades brasileiras: um balanço crítico da pro-dução. Rev Bras Estud Pedagog 2012; 93(234):401-422. Kann L, Kinchen SA, Williams BI, Ross JG, Lowry R, Grunbaum JA, Lloyd J. Youth Risk Behavior Surveil-lance - United States. MMWR 1999; 49(5):1-96. Freedman DS, Khan LK, Dietz WH, Srinivasan SR, Berenson GS. Relationship of childhood obesity to coronary heart disease risk factors in adulthood: The Bogalusa Heart Study. Pediatrics 2001; 108(3):712-718. Instituto Brasileiro de Geografia e Estatística (IBGE). Pesquisa Nacional de Saúde Escolar- 2009. Rio de Janei-ro: IBGE; 2009.
Brasil. Ministério da Saúde (MS). Secretaria de Vigilân-cia em Saúde Secretaria de Gestão Estratégica e Partici-pativa. Vigitel Brasil 2010. Vigilância de fatores de risco e proteção para doenças crônicas por inquérito telefônico. Brasília: MS; 2011. Série G. Estatística e Informação em Saúde
1.
2.
3.
4.
5.
6.
7.
8.
9.
10.
11.
12.
13.
14.
15.
P
e
r
ez PMP
Veiga GV, Costa RS, Araújo MC, Souza AM, Bezerra IN, Barbosa FS, Sichieri R, Pereira RA. Inadequação do consumo de nutrientes entre adolescentes brasileiros. Rev Saude Publica 2013; 47(Supl. 1):212S-221S. Popkin BM. Patterns of beverage use across the lifecy-cle. Physiol Behav 2010; 100(1):4-9.
Feferbaum R, Abreu LC, Leone C. Fluid intake patterns: an epidemiological study among children and adoles-cents in Brazil. BMC Public Health 2012; 12:1-7. Sichieri R, Trotte AP, de Souza RA, Veiga GV. School randomized trial on prevention of excessive weight gain by discouraging students from drinking sodas. Public Health Nutr 2009; 12(2):197-202.
Souza AM, Pereira RA, Yokoo EM, Levy RB, Sichieri R. Alimentos mais consumidos no Brasil: Inquérito Na-cional de Alimentação 2008-2009. Rev Saude Publica 2013; 47(Supl. 1):190S-199S.
Delva J, Johnston LD, O’Malley PM. The Epidemi-ology of overweight and related lifestyle behaviors racial/ethnic and Socioeconomic Status differences among American Youth. Am J Prev Med 2007; 33(Supl. 4):S178-S186.
Nunes MMA, Figueiroa JN, Alves JGB. Excesso de peso, atividade física e hábitos alimentares entre adolescentes de diferentes classes econômicas em Campina Grande (PB). Rev Ass Med Bras 2007; 53(2):130-134.
Levy RB, Castro IRR, Cardoso LO, Tavares LF, Sardinha LMV, Gomes FS, Costa AWN. Consumo e comporta-mento alimentar entre adolescentes brasileiros: Pesqui-sa Nacional de Saúde do Escolar (PeNSE), 2009. Cien Saude Colet 2010; 15(2):3085-3097.
Tavares LF, Castro IRR, Levy RB, Cardoso LO, Claro RM. Padrões alimentares de adolescentes brasileiros: resultados da Pesquisa Nacional de Saúde do Escolar (PeNSE). Cad Saude Publica 2014; 30(12):2679-2690. Monteiro CA, Moura EC, Jaime PC, Claro RM. Valida-de Valida-de indicadores do consumo Valida-de alimentos e bebidas obtidos por inquérito telefônico. Rev Saude Publica 2008; 42(4):582-589.
Tavares LF, Castro IRR, Levy RB, Cardoso LO, Passos MD, Brito FSB. Validade relativa de indicadores de prá-ticas alimentares da Pesquisa Nacional de Saúde do Es-colar entre adolescentes do Rio de Janeiro, Brasil. Cad Saude Publica 2014; 30(5):1029-1041.
DataUERJ 2012. Anuário estatístico - base de dados 2011. Núcleo de Informação e Estudos de Conjuntu-ra- NIESC. [acessado 2011 ago 9]. [cerca de 356p.]. Disponível em: http://www2.datauerj.uerj.br/pdf/DA-TAUERJ_2012.pdf.
Programa das Nações Unidas para o Desenvolvimento (PINUD). Atlas do desenvolvimento humano no Bra-sil. [acessado 2014 set 17]. [cerca de 5p.]. Disponível em http://www.pnud.org.br/IDH/Default.aspx?indice-Accordion=1&li=li_AtlasMunicipios.
Article submitted 3/3/2015 Approved 16/6/2015
Final version submitted 18/6/2015 33.
34. 35.
36.
37.
38.
39.
40.
41.
42.
43.
44.