AbstrAct: This cross-sectional study identiied the factors associated with adult feeding practices in Goiânia, the capital of the state of Goiás, in the Midwestern region of Brazil, by means of telephone interviews with 2,002 adults (≥ 18 years old). Information about demographic aspects, lifestyle, nutritional status, and food consumption was collected, leading to a sum of healthy food choices. It was observed that men and women have an average of two healthy food choices and low frequency of fruit intake (5.4% of men; 8.5% of women), as well as the consumption of legumes and vegetables (18.1% of men; 22.6% of women). The hierarchical multiple regression analysis revealed that the mean healthy food choice among men increases with age and physical practice, and among women, with paid work. The prevalence of unhealthy food choices associated with other risk behaviors favors the development of chronic diseases. Multi-strategy and intersectorial actions are necessary to overcome this situation.
Keywords: Nutritional epidemiology. Feeding behavior. Adult. Food consumption. Life style. Food.
Factors associated with the feeding practices of
the adult population of Goiânia, Goiás, Brazil
Fatores associados às práticas alimentares da
população adulta de Goiânia, Goiás, Brasil
Veruska Prado AlexandreI, Maria do Rosário Gondim PeixotoI, Bethsáida de Abreu Soares SchmitzII, Erly Catarina de MouraIII
IFaculdade de Nutrição da Universidade Federal de Goiás – Goiânia (GO), Brasil. IIDepartamento de Nutrição da Universidade de Brasília – Brasília (DF), Brasil. IIIFundação Oswaldo Cruz, Fiocruz – São Paulo (SP), Brasil.
Corresponding author: Maria do Rosário Gondim Peixoto. Faculdade de Nutrição da Universidade Federal de Goiás. Rua 227, Quadra 68, s/n, Setor Leste Universitário, CEP: 74605-080, Goiânia, GO, Brasil. E-mail: [email protected]
Conlict of interests: nothing to declare – Financial support: National Council of Scientiic and Technological Development (CNPq). Edital CT – Health/MCT/MS/CNPq, n.30/2004 – Feeding and Nutrition.
INTRODUCTION
The speciic role of feeding in the development of Noncommunicable Chronic Diseases (NCCD) is hard to interpret, especially because of the multicausality of this group of conditions1. In this sense, several studies have proven the association between an inadequate
diet, such as excessive saturated fat and insuicient intake of fruits, legumes and vegetables (FLV), as well as the genesis of the NCCD2-5.
In Brazil, data from the Family Budget Survey (POF) indicate the main changes in food availability between 1974/75 and 2002/03: the increased fat, sugar and protein content in feeding, and the reduced intake of complex carbohydrates, associated with the maintenance of FLV in the diet (3 to 4% of the total energy value)6. This scenario characterizes nutritional
transition, which produces important indings for the interpretation of risk factors for NCCD when associated with demographic and epidemiological transitions2.
A study carried out by the Ministry of Health7 identiied the intake of fruit at least ive
days a week in 47% of the population in the capitals of the Brazilian states and in the Federal District. A variation of 23.3 and 62.1% was found for the intake of legumes and vegetables, being the latter obtained for the city of Goiânia.
Several cross-sectional studies have used the information “intake of FLV ive times a week or more” as a protection indicator for NCCD4,7,8. Likewise, some risk indicators are identiied,
such as the frequent intake of total fat and saturated sources, as well as simple sugar7.
In Brazil, from 2006 on, with the implementation of the telephone-based Surveillance of Risk and Protective Factors for Chronic Diseases (VIGITEL)7, the continuous surveillance
resumO: Os fatores associados à prática alimentar da população adulta de Goiânia foram identiicados por meio de estudo transversal realizado através de entrevistas telefônicas com 2.002 adultos (≥ 18 anos). Foram coletadas informações sociodemográicas, de estilo de vida, estado nutricional e consumo alimentar. Construiu-se um somatório de escolhas alimentares saudáveis. Foi observado que homens e mulheres realizam, em média, duas escolhas alimentares saudáveis, sendo baixa a frequência de consumo de frutas (5,4% homens; 8,5% mulheres) e legumes e verduras (18,1% homens; 22,6% mulheres). A análise de regressão múltipla hierarquizada revelou que a média de escolhas alimentares saudáveis entre os homens aumenta com a idade e com a prática de atividade física e, entre as mulheres, com o relato de trabalho remunerado. O predomínio de escolhas alimentares não saudáveis, associado a outros comportamentos de risco, favorece o desenvolvimento de doenças crônicas. Ações multiestratégicas e intersetoriais são necessárias para a superação deste cenário.
FActors AssociAted with the Feeding PrActices oF the Adult PoPulAtion oF goiâniA, goiás, BrAzil
of risk and protective factors for NCCD began. Surveillance systems concerning feeding and nutrition are essential to explain the relations between nutrition and health, besides addressing the deinition of the main actions for the ield of feeding and nutrition9, therefore
helping the construction and the consolidation of knowledge about feeding practices on NCCD3,10. In this context, this article aims at identifying the sociodemographic and behavioral
factors related to the feeding practice of the adult population in the city of Goiânia.
METHODS
For the performance of this research, data from the study “SIMTEL – CINCO CIDADES: implantação, avaliação e resultados de um sistema municipal de monitoramento de fatores de risco nutricionais para doenças crônicas não transmissíveis a partir de entrevistas telefônicas em cinco municípios brasileiros” were used. This study was approved and inanced by the National Council of Scientiic and Technological Development (CNPq) and conducted by the Group of Epidemiological Studies in Nutrition and Health (NUPENS), of the School of Public Health at Universidade de São Paulo (USP), together with the League of Arterial Hypertension/Universidade Federal de Goiás (UFG). This study was conducted in 2005, in ive Brazilian cities: Belém, Florianópolis, Goiânia, Salvador and São Paulo. This article presents data related to the city of Goiânia.
A population-based cross-sectional study was performed from May to December 2005 and involved a probability sampling of the adult population (≥ 18 years old) living in households assisted by the telephone service of the city of Goiânia (GO). The minimum number of 2,000 interviews was considered in order to estimate the prevalence of any risk factor for NCCD11 with a 95% conidence interval (95%CI) and maximum error of 3 percentage points.
The efectively studied sample was constituted of 2,002 individuals.
The research was conducted by means of telephone interviews. The sample was deined in two stages, and a rale was stratiied by neighborhoods and systematically (1/44 fraction) for the deinition of the telephone lines in the base (n = 7000), and simple random rale for the selection of the interviewees. In each household, a resident (≥ 18 years old) was invited to answer the interview. More details about the methodological procedures can be obtained in other publications11,12.
The instrument used to obtain the information was comprised of 76 inter-related questions and, depending on the answers, many of them were not asked. The fox-pro language was used to build the questionnaire, which enabled the reading and the direct insertion on the computer screen, as well as the automatic fulillment of the data base in the d-base format. Aiming at quality control, after the interviewees’ consent, the content of the interview was recorded. The questionnaire approached questions related to sociodemographic characteristics, as well as those concerning lifestyle, health and food intake.
The studied characteristics related to lifestyle were: practice of physical activities (no or yes), considering active individuals the ones who reported some sort of physical activity during leisure time or at work, during commute to work or at household chores. Besides, smoking was observed, categorized in no or yes; the rusk levels of alcohol consumption, based on the reference of consumption of more than 5 doses at least once in the past month (no or yes)13; and the report of diet follow-up for weight loss in the past 12 months (no or yes).
The body mass index (BMI) was used as a health variable, calculated by the ratio weight (kg) to square height (m), both self-reported. Nutritional status was classiied, according to the World Health Organization (WHO)14, as low weight (BMI < 18.5 kg/m2), eutrophic (BMI between
18.5 and 24.9 kg/m2), pre-obese (BMI between 25 and 29.9 kg/m2) and obese (BMI ≥ 30 kg/m2).
Data concerning dietary intake were obtained by direct questions, therefore identifying consumption (no or yes), on ive or more weekdays, of fruits, legumes/vegetables and beans, or only the report of preferential intake of whole milk, apparent fat (apparent fat on meat and/or chicken skin) and soft drink with sugar, categorized into no or yes.
The construction of dietary intake variables was based on the guidelines of the Dietary Guide for the Brazilian Population15 and on the recommendations by WHO2. Foods were
classiied into protection or risk to the development of NCCD, according to the observations available in literature13,15. Therefore, the intake of fruit, legumes and vegetables higher than
or equal to three times a day, at least ive days a week, and, for beans, the report of regular intake (≥ 5 days/week), were considered as indicators of protective intake.
The risky diet was considered as the intake of whole milk, apparent fat and soft drinks with sugar, therefore characterizing an unhealthy feeding practice.
The feeding practice assessment was built by a sum of healthy dietary choices; the zero value (0) was considered for unhealthy choices, and one (1) for healthy choices. Healthy choices included: the intake of fruit higher than or equal to three times/day, on at least ive weekdays, the intake of legumes and vegetables higher than or equal to three times/day on ive weekdays, the intake of beans higher than or equal to ive weekdays, the report of skimmed and semi-skimmed milk intake, the practice of removing the apparent fat and the poultry skin and the non-consumption of soft drinks with sugar. Therefore, the sum ranged from zero to six, and the highest values indicated the prevalence of healthy dietary choices. The sum was categorized into four groups of healthy dietary choices: 0 and 1; 2; 3 and 4 to 6 choices. It was chosen to aggregate categories 0 and 1, and also 4 to 6 dietary choices, due to the low number of observations found in the lowest (0) and the highest (6) values.
Data processing and analyses were performed with the assistance of the Statistical Software for Professionals (STATA), version 7.0, by using the set of commands “svy”, considering the complexity of the sample. An adjustment procedure was applied to expand the results to the total adult population of the city, as described by Monteiro et al.11.
Statistical analyses were conducted by gender; results were expressed by frequencies, with 95%CI, and means with standard deviation. In order to verify the statistical signiicance, the
χ2 test, the trend test, the analysis of variance and the Student’s t-test, considering p < 0.05.
FaCToRs assoCiaTed WiTH THe FeedinG pRaCTiCes oF THe adUlT popUlaTion oF GoiÂnia, GoiÁs, BRaZil
and anthropometric ones), as well as the outcome (number of healthy dietary choices), a simple linear regression was conducted. Variables that showed association (p < 0.20) were tested by the simple hierarchical multiple linear regression. In the i nal model, only the variables associated with the outcome were maintained (p < 0.05).
Multiple linear regression suggests that the variables of interest be grouped into blocks, which can be arranged according to the inl uence on the outcome16,17. The hierarchical
conceptual model used in this study is presented in Figure 1. The variables of block 1 are considered as more distal inl uencing factors, while the variables in the last block are seen as most proximal factors. In this study, three blocks of variables that have inl uence on the adoption of healthy dietary choices were considered. In the i rst block, there are socioeconomic factors, such as schooling, marital status, paid work, age, self-reported skin color. In the second block, there are the behavioral variables, such as the practice of physical activity, smoking, alcohol consumption, diet in the past 12 months, who impact over dietary choices is inl uenced by the i rst block of factors, which was not studied here. In the most proximal block, BMI was included as an anthropometric variable analyzed in this study and in this model.
As to ethical aspects, since interviews were made by telephone, the informed consent form was replaced by the verbal consent, which was obtained and recorded at the time of telephone conversations. This project was analyzed and approved by the Research Ethics Committee of the School of Public Health at USP, according to the guidelines of resolution 196/96, of the National Health Council, and i nanced by CNPq, report n. 30/2004. The authors declare there was no conl ict of interest in the conduction of this study.
RESULTS
Two thousand and two interviews were conducted from 2,738 eligible telephone lines, which led to a 73.1% success rate. The main causes that prevented the interviewes were:
Figure 1. Theoretical model for hierarchical analysis of healthy food choices. SOCIODEMOGRAPHIC VARIABLES
(Schooling, marital status, paid work, age, self-reported color)
BEHAVIORAL VARIABLES
(Physical activity, smoking, alcohol, diet in the past 12 months)
ANTHROPOMETRIC VARIABLE (Body Mass Index)
refusal (6.8%); impossibility to make contact after 10 attempts to call (10.1%), on varied days and periods; and lines that were out of service or non-existent (2.8%)12.
With regard to sociodemographic characteristics, it was observed that the sample was mainly composed of women (53.4%, n = 1,239) and by individuals aged from 18 to 44 years old (men, 86.1%, and women, 84.5%), with no diferences concerning gender. Mean age for men was of 37.6 years old (± 15.2 years old), and for women, 38.2 years old (± 15.4 years old). Mean schooling for men and women was, respectively, 8.2 (± 4.4) and 8.3 (± 4.5) schooling years. Most men (78.8%) and women (53.6%) reported working, with diferences between genders. With regard to skin color, the prevalence of the self-reported non-white color (61.6% of men and 56.4% of women) was observed, as well as the report of stable union among 57.7% of the men and 51.9% of the women, with no statistical diference.
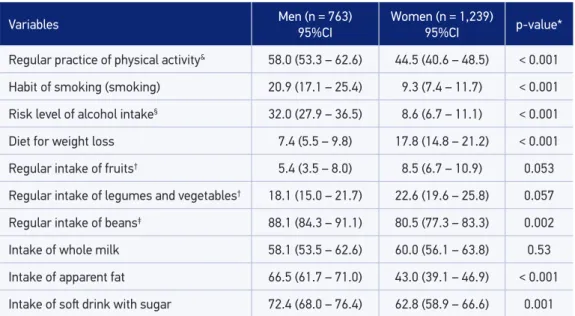
Table 1 presents the characteristics related to lifestyle and dietary intake, by gender. The frequencies of physical activities, smoking and risky levels of alcohol consumption were higher for men (p < 0.001). The habit of being on a diet in order to reduce weight was more frequent among women (p < 0.001). The analysis of dietary intake indicates that men and women eat little fruit, and that women tend to eat legumes, vegetables and whole milk more frequently. However, these diferences were not statistically signiicant. The higher intake of beans, apparent meat fat and soft drinks with sugar was observed among men (p < 0.05) (Table 1). As to nutritional status, men presented higher frequencies of pre-obesity (33.6%) and obesity (9.7%) than women (21.7% of pre-obesity and 8.7% of obesity).
Table 1. Sample distribution# according to lifestyle and food consumption variables, by gender. Goiânia, Brazil, 2005 (n = 2,002).
Variables Men (n = 763)
95%CI
Women (n = 1,239)
95%CI p-value*
Regular practice of physical activity& 58.0 (53.3 – 62.6) 44.5 (40.6 – 48.5) < 0.001
Habit of smoking (smoking) 20.9 (17.1 – 25.4) 9.3 (7.4 – 11.7) < 0.001
Risk level of alcohol intake§ 32.0 (27.9 – 36.5) 8.6 (6.7 – 11.1) < 0.001
Diet for weight loss 7.4 (5.5 – 9.8) 17.8 (14.8 – 21.2) < 0.001
Regular intake of fruits† 5.4 (3.5 – 8.0) 8.5 (6.7 – 10.9) 0.053
Regular intake of legumes and vegetables† 18.1 (15.0 – 21.7) 22.6 (19.6 – 25.8) 0.057
Regular intake of beans‡ 88.1 (84.3 – 91.1) 80.5 (77.3 – 83.3) 0.002
Intake of whole milk 58.1 (53.5 – 62.6) 60.0 (56.1 – 63.8) 0.53
Intake of apparent fat 66.5 (61.7 – 71.0) 43.0 (39.1 – 46.9) < 0.001
Intake of sot drink with sugar 72.4 (68.0 – 76.4) 62.8 (58.9 – 66.6) 0.001
*χ2 between genders. #Adjusted to “represent” the total adult population; &At leisure or occupation or household cleaning or commuting; §Alcohol: consumption ≥ 5 drinks at least one day in the past month; †Consumption of more than 3 times/
FActors AssociAted with the Feeding PrActices oF the Adult PoPulAtion oF goiâniA, goiás, BrAzil
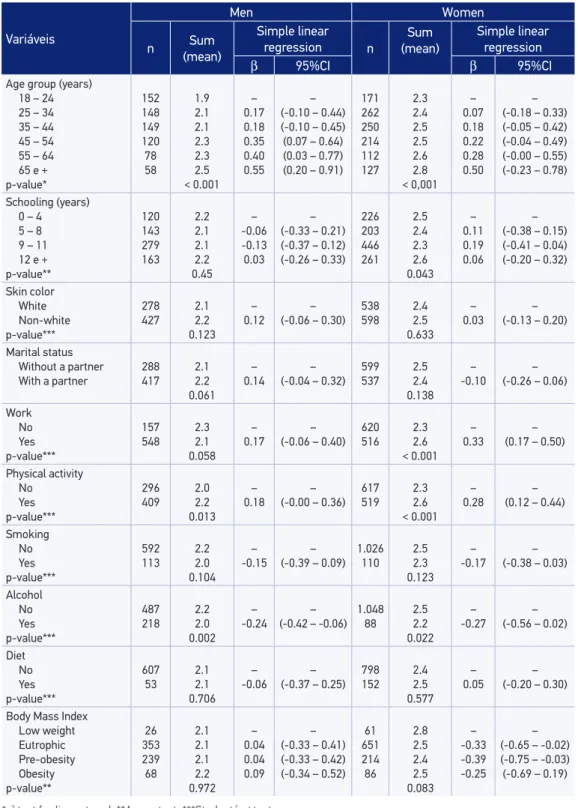
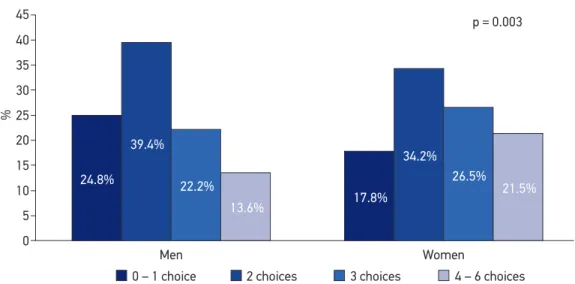
According to a previous description, a sum of healthy dietary choices was built and considered protective factors for NCCD (Figure 2). It was observe that only 13.6% of the interviewed men and 21.5% of the women presented between 4 and 6 healthy choices. Table 2 presents the mean of healthy dietary choices according to the studied variables and the simple linear regression coeicients, according to independent variables. For both genders, it was observed that age and practice of physical activity were directly associated with the sum of healthy dietary choices, since the risky level of alcohol consumption was inversely associated. Among women, the presence of paid work also had a direct association with healthy dietary choices. The other researched variables did not present a signiicant association with the sum of healthy dietary choices.
The simple hierarchical multiple linear regression tested the following variables among men: age group, skin color, marital status, paid work, practice of physical activity, smoking and risky levels of alcohol consumption. For women, the following variables were tested: information about age group, schooling, marital status, paid work, practice of physical activity, smoking, risky levels of alcohol consumption and BMI. Such variables presented p < 0.20 in the simple linear regression analysis (Table 2).
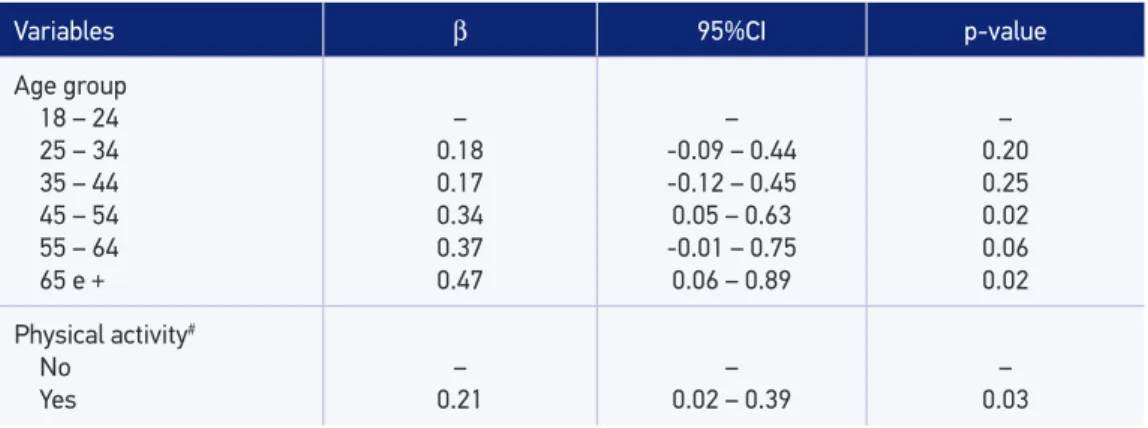
Tables 3 and 4 present the coeicients of variables that remained in the model after adjustments by blocks, for the male and the female gender, respectively. For men, it was observed that β increased with age and the practice of physical activities. For women, a direct increase of the coeicient was noticed with age, with the report of paid work and with the practice of physical activity, while the increased BMI was inversely related to the sum of healthy dietary choices.
DISCUSSION
In this study, the intake of fruits and the consumption of legumes and vegetables ≥ 5 days a week, three times/day, present low distribution for both genders. With regard to foods that are seen as risk, the more frequent intake of whole milk was observed among women, and meat with apparent fat, among men. Another important aspect refers to the direct relationship between healthy choices and other protective behaviors, such as the practice of physical activities, which indicates the relationship of behaviors that promote health.
The foods studied here are currently mentioned in several epidemiological studies as being inluential to the development of NCCD3,7,15,19.
It is a known fact that the reliability of the self-reported information relies on the ability to remember them, as well as on the schooling of the participants of the study. Schooling inluences the choice of food because of mechanisms that allow the better understanding of messages concerning the importance of a healthy diet20. This habit, when associated to the
Table 2. Association between sociodemographic characteristics and lifestyle with the sum of healthy food choices according to gender. Goiânia, Brazil, 2005 (n = 2002).
Variáveis Men Women n Sum (mean) Simple linear regression n Sum (mean) Simple linear regression
β 95%CI β 95%CI
Age group (years) 18 – 24 25 – 34 35 – 44 45 – 54 55 – 64 65 e +
p-value* 152 148 149 120 78 58 1.9 2.1 2.1 2.3 2.3 2.5 < 0.001 – 0.17 0.18 0.35 0.40 0.55 – (-0.10 – 0.44) (-0.10 – 0.45) (0.07 – 0.64) (0.03 – 0.77) (0.20 – 0.91)
171 262 250 214 112 127 2.3 2.4 2.5 2.5 2.6 2.8 < 0,001 – 0.07 0.18 0.22 0.28 0.50 – (-0.18 – 0.33) (-0.05 – 0.42) (-0.04 – 0.49) (-0.00 – 0.55) (-0.23 – 0.78)
Schooling (years) 0 – 4 5 – 8 9 – 11 12 e +
p-value** 120 143 279 163 2.2 2.1 2.1 2.2 0.45 – -0.06 -0.13 0.03 – (-0.33 – 0.21) (-0.37 – 0.12) (-0.26 – 0.33)
226 203 446 261 2.5 2.4 2.3 2.6 0.043 – 0.11 0.19 0.06 – (-0.38 – 0.15) (-0.41 – 0.04) (-0.20 – 0.32)
Skin color White Non-white p-value*** 278 427 2.1 2.2 0.123 – 0.12 – (-0.06 – 0.30)
538 598 2.4 2.5 0.633 – 0.03 – (-0.13 – 0.20)
Marital status Without a partner With a partner
288 417 2.1 2.2 0.061 – 0.14 – (-0.04 – 0.32)
599 537 2.5 2.4 0.138 – -0.10 – (-0.26 – 0.06)
Work No Yes p-value*** 157 548 2.3 2.1 0.058 – 0.17 – (-0.06 – 0.40)
620 516 2.3 2.6 < 0.001 – 0.33 – (0.17 – 0.50)
Physical activity No Yes p-value*** 296 409 2.0 2.2 0.013 – 0.18 – (-0.00 – 0.36)
617 519 2.3 2.6 < 0.001 – 0.28 – (0.12 – 0.44)
Smoking No Yes p-value*** 592 113 2.2 2.0 0.104 – -0.15 – (-0.39 – 0.09)
1.026 110 2.5 2.3 0.123 – -0.17 – (-0.38 – 0.03)
Alcohol No Yes p-value*** 487 218 2.2 2.0 0.002 – -0.24 – (-0.42 – -0.06)
1.048 88 2.5 2.2 0.022 – -0.27 – (-0.56 – 0.02)
Diet No Yes p-value*** 607 53 2.1 2.1 0.706 – -0.06 – (-0.37 – 0.25)
798 152 2.4 2.5 0.577 – 0.05 – (-0.20 – 0.30)
Body Mass Index
Low weight Eutrophic Pre-obesity Obesity p-value** 26 353 239 68 2.1 2.1 2.1 2.2 0.972 – 0.04 0.04 0.09 – (-0.33 – 0.41) (-0.33 – 0.42) (-0.34 – 0.52)
61 651 214 86 2.8 2.5 2.4 2.5 0.083 – -0.33 -0.39 -0.25 – (-0.65 – -0.02) (-0.75 – -0.03) (-0.69 – 0.19)
FActors AssociAted with the Feeding PrActices oF the Adult PoPulAtion oF goiâniA, goiás, BrAzil
Table 3. Factors associated with the sum of healthy food choices through hierarchical multiple linear regression among adult men. Goiânia, Brazil, 2005 (n = 2002).
Variables β 95%CI p-value
Age group 18 – 24 25 – 34 35 – 44 45 – 54 55 – 64 65 e +
– 0.18 0.17 0.34 0.37 0.47 – -0.09 – 0.44 -0.12 – 0.45 0.05 – 0.63 -0.01 – 0.75
0.06 – 0.89
– 0.20 0.25 0.02 0.06 0.02
Physical activity#
No Yes
– 0.21
– 0.02 – 0.39
– 0.03
#Age group + Physical activity.
Table 4. Factors associated with the sum of healthy food choices through hierarchical multiple linear regression among adult women. Goiânia, Brazil, 2005 (n = 2002).
Variables β 95%CI p-value
Age group#
18 – 24 25 – 34 35 – 44 45 – 54 55 – 64 65 e +
– 0.11 0.24 0.22 0.22 0.38 – -0.14 – 0.36
0.01 – 0.47 -0.04 – 0.48 -0.07 – 0.52 0.06 – 0.70
– 0.39 0.04 0.09 0.14 0.02 Paid work No Yes – 0.33 – 0.16 – 0.50
– < 0.001
Physical activity&
No Yes
– 0.32
– 0.16 – 0.48
– < 0.001 Alcohol No Yes – -0.31 – -0.53 – -0.11
– 0.003
Body Mass Index§
Low weight Eutrophic Pre-obesity Obesity – -0.40 -0.59 -0.43 – -0.71 – 0.10 -0.96 – -0.22 -0.86 – -0.01
– 0.01 0.002 0.046
#Age group + Paid work; &Age group + Paid work + Physical Activity + Alcohol consumption; §Age group + Paid work +
Figure 2. Percentage distribution of the sum of healthy food choices by gender. Goiânia, Brazil, 2005 (n = 2002).
Men
0 – 1 choice 2 choices
p = 0.003
24.8% 39.4%
22.2%
13.6% 17.8%
34.2% 26.5%
21.5%
Women
3 choices 4 – 6 choices
45
40
35
30
25
20
15
10
5
0
%
In the case of studies that choose to use the estimated FLV intake, by means of the simpliied method, Serdula et al.24 observed that the mean daily intake measured
by the telephone survey is usually similar to the estimated intake by dietary recall, however, it is lower than the one obtained by the expanded food frequency questionnaire. Peixoto et al.12 point out that the diferences between estimates for the frequency of risk
and protective factors observed in the adult population with telephone lines and the total adult population in the city of Goiânia are low and non-systematic, in a publication with the same sample as the one in this study.
In this sample, the intake of fruit at least ive times a week, three times/day, presented low distribution for men and women (5.4 and 8.5%, respectively), which indicates that part of the studied population presents compatible reports with the higher risk of inadequate intake of protective foods and, consequently, of nutrients, which are important to prevent NCCD. This fact becomes even more worrisome when we observe that the report of legume and vegetable intake, on ive or more days/week, 3 or more times/day, does not reach 25% of the male or the female studied population. In the analysis by gender, it is observed that women tend to consume these foods more frequently.
Some cross-sectional studies found higher frequencies of FLC intake among females8,25,26,
older individuals25 and those with higher schooling26,27 and socioeconomic level25.
Beans are also considered to be a protective food for NCCD, since they are a source of vegetable proteins, ibers and with low glycemic index19. In this study, the daily intake was
reported by more than 80% of the population, therefore, it can be considered to be high when compared to other studies, such as the one by Newmann, Shirassu and Fisberg18, who
FActors AssociAted with the Feeding PrActices oF the Adult PoPulAtion oF goiâniA, goiás, BrAzil
traditional foods was observed, which included beans, as well as the increasing intake of foods with sugar and fats (snacks, bread, sausage and hot dogs) among women aged more than 35 years old28. The same consumption pattern was identiied in the POF conducted
in 2002/200329.
Data presented by VIGITEL7 indicate higher frequencies of the consumption of whole
milk and meat with apparent fat in the male population, while this study found a similar result only concerning the intake of meat with apparent fat, once women in this study consumed more whole milk. These frequencies are considered to be high, considering the beneits obtained by the healthier dietary choices, such as skimmed milk and lean meat15.
Other results corroborate the indings in this study, which identiied more consumption of fat and sugar among men. Results by Fonseca, Chor and Valente30 and Thompson et al.27
also identiied the higher intake of fat and sugar among men.
Studies have related the intake of soft drinks with sugar to increasing weight and tooth decays, besides the low use of foods that are sources of calcium31,32. According to POF
2002-2003, there was a 400% increase in the participation of soft drinks in the Brazilian household food acquisition, and this number is higher among lower income classes6. Besides the
damaging efects of sugar, this increase is also associated with a dietary intake pattern that is characterized by the increasing calorie participation of fats and the reduced participation of other carbohydrates in the diet33.
The analysis of the sum of healthy dietary choices showed higher frequencies for up to two healthy dietary choices in the total population, and the non-prevalence for healthier options was considered to be a risk for the development of NCCD. It is worth to mention that, among protective foods, lower frequencies were observed for the intake of FLV.
With regard to schooling, no statistically signiicant diferences were observed. From the mean of risky and protective food intake, Neumann, Shirassu and Fisberg18 reported that
the mean of risky food intake is statistically higher among individuals with basic schooling in comparison to those with mid or upper education.
In general, studies point to a relationship between dietetic ingestion and lifestyle characteristics. The higher intake of fruits, legumes and vegetables is observed among non-smokers22,27,34,35, people who do not drink alcohol27 and those who are physically
active28,27,34,35. With regard to the intake of fat, it tends to be lower when followed by other
healthy practices27,36.
In this research (Table 2), analyses associating the means of healthy dietary choices and sociodemographic and lifestyle characteristics demonstrated higher means in comparison to older age groups and to the practice of physical activities, in both genders. These indings are important to project the perspective of promoting healthier lifestyles. These data are corroborated by the hierarchized multiple analysis, in which, for both men and women, the number of healthy dietary choices increases with the practice of physical activities, even after the adjustment by age group.
design of the study, which does not allow the establishment of the cause-efect relationship between the studied events. However, in this study, indings referring to healthy dietary choices may have been inluenced by the access to information about the importance of adopting healthy dietary habits, due to the previous diagnosis of some disease.
CONCLUSION
The conclusion is that the studied population mostly makes unhealthy dietary choices (low FLV intake; preference for the consumption of whole milk, apparent fat and soft drinks with sugar), and associations with sociodemographic and lifestyle characteristics were identiied, both for the risk and protection for the development of NCCD.
The data presented here can be used, in the city of Goiânia and other urban centers, to disseminate information for health professionals and the general population and to support the planning of speciic programs addressed to the prevention and reduction of NCCD. It is also interesting in relation to a broader positive planning perspective in the feeding and nutrition ield, considering the proposal presented for the analysis of the referred feeding practices.
These results can also collaborate for the effective recommendation of the Global Strategy for the Promotion of Healthy Feeding, Physical Activity and Health, concerning the monitoring and surveillance of NDDC, therefore identifying paths for the reduction of morbimortality associated to these risk factors.
This study exposes the need to conduct health education actions based on the enlarged concept of health, in order to consolidate healthier choices that are more doable in the community, therefore considering the principles of health promotion.
It is important to use telephone-based surveillance systems considering their agility, low operational cost and ability to follow-up the evolution of risk and protective factors in the populations closely.
REFERENCES
1. Kumanyika S. Nutrition and Chronic Disease Prevention: Priorities for US minority Groups. Nutr Rev 2006; 64(2 Pt 2): S9-14.
2. World Health Organization. Diet, nutrition and prevention of chronic diseases. Report of a Joint WHO/FAO Expert Consultation. Geneva: World Health Organization; 2003 (WHO Technical Report Series 916).
3. Fung TT, Willett WC, Stampfer MJ, Manson JE, Hu FB. Dietary Patterns and the risk coronary heart disease in women. Arch Intern Med 2001; 161(15): 1857-62.
4. Jaime PC, Figueiredo ICR, Moura EC, Malta DC. Fatores associados ao consumo de frutas e hortaliças no Brasil, 2006. Rev Saúde Pública 2009; 43(supl 2): 57-64. 5. Martins MPSC, Gomes ALM, Martins MCC, Mattos MA,
Souza-Filho MDS, Mello DB et al. Consumo Alimentar, Pressão Arterial e Controle Metabólico em Idosos Diabéticos Hipertensos. Rev Bras Cardiol 2010; 23(3): 162-70. 6. Levy-Costa RB, Sichieri R, Pontes NDS, Monteiro CA.
FActors AssociAted with the Feeding PrActices oF the Adult PoPulAtion oF goiâniA, goiás, BrAzil
7. Brasil. Ministério da Saúde. Secretaria de Vigilância em Saúde. Secretaria de Gestão Estratégica e Participativa. Vigilância de Fatores de Risco e Proteção para Doenças Crônicas por Inquérito Telefônico. Brasília; 2007. 8. Jaime PC, Monteiro CA. Fruit and vegetable intake
by Brazilian adults, 2003. Cad Saúde Pública 2005; 21(suppl 1): 19-24.
9. Jerome NW, Ricci JA. Food and nutrition surveillance: an international overview. Am J Clin Nutr 1997; 65(suppl 1): 1198S-202S.
10. Jacques PF, Tucker K. Are dietary patterns useful for understanding the role of diet in chronic disease? Am J Clin Nutr 2001; 73(1): 1-2.
11. Monteiro CA, Moura ECD, Jaime PC, Lucca A, Florindo AA, Figueiredo ICR et al. Monitoramento de fatores de risco para doenças crônicas por meio de entrevistas telefônicas. Rev Saúde Pública 2005; 39(1): 47-57. 12. Peixoto MDRG, Monego ET, Alexandre VP, Souza
RGMD, Moura ECD. Monitoramento de fatores de risco para doenças crônicas por entrevistas telefônicas: experiência de Goiânia. Cad Saúde Pública 2008; 24(6): 1323-33.
13. World Health Organization. International Guide for Monitoring Alcohol Consumption and Related Harm. Geneva: World Health Organization; 2000. 14. World Health Organization. Physical status: The use
and interpretation of antropometry. Geneva: World Health Organization; 1995 (WHO Technical Report Series 854).
15. Brasil. Ministério da Saúde. Secretaria de Atenção à Saúde. Departamento de Atenção Básica. Coordenação Geral da Política de Alimentação e Nutrição. Guia alimentar para a população brasileira: promovendo a alimentação saudável. Brasília, DF; 2006.
16. Levin, J, Fox JA. Estatística para ciências humanas. São Paulo: Prentice Hall; 2004. 497p.
17. Victora CG, Huttly SR, Fuchs SC, Olinto MTA. The role of conceptual frameworks in epidemiological analysis: a hierarchical approach. Int J Epidemiol 1997; 26(1): 224-7.
18. Neumann AIDLCP, Shirassu MM, Fisberg RM. Consumo de alimentos de risco e proteção para doenças cardiovasculares entre funcionários públicos. Rev Nutr 2006; 19(1): 19-28.
19. World Health Organization. Report of a Joint FAO/ WHO Consultation. Preparation and use of food-based dietary guidelines. Geneva: World Health Organization; 1998 (WHO Technical Report Series 880).
20. Sichieri R. Dietary patterns and their associations with obesity in the Brazilian City of Rio de Janeiro. Obes Res 2002; 10(1): 1-6.
21. Turrell G, Hewitt B, Patterson C, Oldenburg B. Measuring socio-economic position in dietary research: is choice of socio-economic indicator important? Public Health Nutr 2003; 6(2): 191-200.
22. Peixoto MRG, Benício MHD, Jardim PCBV. Validade do peso e da altura auto-referidos: o estudo de Goiânia. Rev Saúde Pública 2006; 40(6): 1065-72.
23. Silveira EA, Araújo CL, Gigante DP, Barros AJD, Lima MS. Validação do peso e altura referidos para o diagnóstico do estado nutricional em uma população de adultos no Sul do Brasil. Cad Saúde Pública 2005; 21(1): 235-45. 24. Serdula M, Coates R, Byers T, Mokdad A, Jewell S, Chávez
N et al. Evaluation of a brief telephone questionnaire to estimate fruit and vegetable consumption in diverse study populations. Epidemiology 1993; 4(5): 455-63. 25. Neutzling MB, Rombaldi AJ, Azevedo MR, Hallal PC.
Fatores associados ao consumo de frutas, legumes e verduras em adultos de uma cidade no Sul do Brasil. Cad Saúde Pública 2009; 25(11): 2365-74.
26. Figueiredo ICR, Jaime PC, Monteiro CA. Fatores associados ao consumo de frutas, legumes e verduras em adultos da cidade de São Paulo. Rev Saúde Pública 2008; 42(5): 777-85.
27. Thompson FE, Midthune D, Subar AF, Mcneel T, Berrigan D, Kipnis V. Dietary intake estimates in the National Health Interview Survey, 2000: Methodology, results, and interpretation. J Am Diet Assoc 2005, 105(3): 352-61. 28. Pereira RA, Andrade RG, Sichieri R. Mudanças no
consumo alimentar de mulheres do Município do Rio de Janeiro, Brasil, 1995-2005. Cad Saúde Pública 2009; 25(11): 2419-32.
29. Instituto Brasileiro de Geograia e Estatística. Pesquisa de Orçamentos Familiares 2002-2003: análise da disponibilidade domiciliar de alimentos e do estado nutricional no Brasil. Rio de Janeiro: Fundação Instituto Brasileiro de Geograia e Estatística; 2004. 76p. 30. Fonseca MDJMD, Chor D, Valente JG. Hábitos
alimentares entre funcionários de banco estatal: padrão de consumo alimentar. Cad Saúde Pública 1999; 15(1): 29-39.
31. Schulze MBS, Manson JE, Ludwig DS, Colditz, GA, Stampfer MJ, Willett WC et al. Sugar-Sweetened beverages, weight gain, and incidence of type 2 diabetes in young and middle-aged women. J Am Diet Assoc 2004; 292(8): 927-34.
32. Touger-Decker R, Loveren CV. Sugars and dental caries. Am J Clin Nutr 2003; 78(4): 881S-92S. 33. Levy RB, Claro RM, Monteiro CA. Aquisição de açúcar
34. Ruowei L, Serdula M, Bland S, Mokdad A, Bowman B, Nelson D. Trends in fruit and vegetable consumption among adults in 16 US States: Behavioral Risk Factor Surveillance System, 1990-1996. Am J Public Health 2000; 90(5): 777-81. 35. Serdula MK, Gillespie C, Kettel-Khan L, Farris R,
Seymour J, Denny C. Trends in fruit and vegetable consumption among adults in the United States: Behavioral Risk Factor Surveillance System, 1994-2000. Am J Public Health 2004; 94(6): 1014-8.
36. Levy RB, Claro RM, Monteiro CA. Aquisição de açúcar e perfil de macronutrientes na cesta de alimentos adquirida pelas famílias brasileiras (2002-2003). Cad Saúde Pública 2010; 26(3): 472-80.
Received on: 02/19/2011
Final version presented on: 05/19/2011