© FECAP
RBGN
Received on August 11, 2014 Approved on June 22, 2015
1. Daniel Reed Bergmann Doctor in Business
Administration FEA-USP (Brazil)
2.José Roberto Ferreira Savoia
Doctor in Business Administration FEA-USP (Brazil)
3.Bruno de Melo Souza Degree in Business
Administration FEA-USP (Brazil)
[Bruno.de.melo.sousa@gmail. com]
4.Frederic de Mariz Master in International Relations
Columbia University (USA)
Review of Business Management
DOI:10.7819/rbgn.v17i56.2074
Evaluation of Merger and Acquisition
Processes in the Brazilian Banking Sector
by means of an Event Study
Daniel Reed Bergmann, José Roberto Ferreira Savoia
Bruno de Melo Souza
Administration Department, Universidade de São Paulo, SP, Brazil
Frederic de Mariz
Economic Policy, Columbia University, NY, USA
Responsible editor: André Saito, Dr. Evaluation process: Double Blind Review
ABSTRACT
Objective – Analyze the reactions of the stock market to M&A announcements, i.e. find out if there was value creation and consequently maximization of shareholder wealth or whether there was value destruction and consequently a decrease in the wealth of the shareholders of the acquiring companies in the short term.
Design/methodology/approach – Event study – Quantitative Method
Findings – It can neither be airmed that the acquisitions had a
signiicant impact on value creation for purchasers and banks, nor can it be denied. Given the lack of preponderance of either positive or negative returns, the transactions may have been perceived in diferent manners.
Practical implications – he results may be explained by the fact that the synergies that resulted from the M&A processes in the banking sector only helped consolidating major market players and consequently reduced competitiveness in that sector. he negative abnormal returns of M &A processes are due to the monopolistic market competition structure (Tabak, Fazio & Cajueiro, 2012).
Contributions – Event Study with robust errors
1 INTRODUCTION
he debate on the creation of value as a result of merger and acquisition operations (M&A) in academic literature has been inconclusive and the ambivalent and diferent results over time stimulate researchers to conduct further investigations.
he rationale for analyzing the response of stock prices in the M&A process in inancial institutions features widespread foundations in economic theory as per Berger, Demsetz and Strahan (1999), who point out ive major economic reasons that foster the consolidation of local banking systems: 1) technological progress; 2) improved inancial conditions; 3) inancial stress or excessive capacity in that industry; 4) consolidation of international markets; and 5) the deregulation of products.
M&A activities in the banking sector have increased in large waves since the beginning of Brazil’s economic restructuring process that started after the Real Plan. Today, this sector features a high degree of concentration, similar to other Latin American countries, but quite higher than in developed countries, such as the United States (Tabak, Fazio & Cajueiro, 2012). In Brazil, inancial stress was a major reason that led to the wave of consolidation of the 1990’s. he Real Plan and the subsequent normalization of inlation and interest rates stabilized the economy and this new scenario drastically changed the business model of banks, which started to increase their credit ofer and rely less on revenues from treasury operations.
The financial stress that led to bank consolidation was especially supported by government plans that aimed at reorganizing the public bank sector (Pinheiro & Moura, 2001). In the last decade, due to the expansion of the capital market, IPOs of several national banks took place, without any changes to the industry’s market structure. Today, that market features six major players, such as multiple banks and other smaller ones that operate in market niches.
In Brazil, studies such as Tabak, Fazio and Cajueiro (2012), Nakane (2002), Belaisch
(2003) and Petterini (2003) agree that the industry apparently doesn’t behave like a perfectly competitive market, except for a few periods of time or speciic regions. (It should be noted here that perfect competition is a type of market structure that is quite unusual in the main activities of modern economies, which are mostly led by large conglomerates). However, the banking market operates quite diferently from cartelized structures and we may conclude that imperfect market structures best characterize that sector.
he aim of this study is to analyze the proitability of the shares of the banks involved in mergers or acquisitions, i.e., to analyze the reactions of the stock market to M&A announcements and to find out if there was value creation and consequently maximization of shareholder wealth, or value destruction and consequently a decrease in the wealth of the shareholders of the acquiring companies in the short term.
2 MERGERS AND ACQUISITIONS AS
VALUE CREATION STRATEGIES
M&A transactions may be part of a strategy to expand the scope and activities of both the acquiring and the acquired companies. It has long been recognized that individual M&A operations are best understood when they are evaluated on a long-term basis, where companies choose among the various corporate arrangements according to the synergy they wish to obtain and the type of company to be acquired (Ahern, 2007). However, there are risks involved in achieving a business deal, such as changes to the results. Berkovitch and Narayanan (1993) state that among the most important risk causes are agency conlicts and overconidence, also called the hubris efect.
signiicant abnormal returns in almost all acquisitions, (ii) the shareholders of the acquiring companies didn’t obtain any significant abnormal returns, and (iii) the purchasing shareholders obtained negative abnormal returns in mergers.
Similar results were obtained by Andrade and Staford (2004) who showed that, following the announcement of tender ofers in the US market from 1973 to 1998, the shareholders of the acquired companies obtained an average gain of 16%. On the other hand, the shareholders of the acquiring companies showed an average loss of 0.7%.
he results for the Brazilian market are controversial. Camargos and Barbosa (2008) evaluated 72 M&A processes of Brazilian companies, from January 1996 to December 2004. They analyzed the impact of M&A transactions on the creation of operational synergies and on value creation for shareholders and concluded that the acquiring companies had the greater potential for value creation and for generating operating synergies when compared to the acquired companies, which shows that, in the cases analyzed, the acquisition made sense from the economic point of view.
However, Steinberg (2009) conducted a study including 33 M&A transactions of companies listed on BM&F Bovespa from January 1997 to May 2008. he abnormal returns of the shares of both the acquired and the acquiring companies are positive and statistically significant, where the ones of the acquired companies (average of 10.82% and median of 6.39%) are larger than those of the acquiring companies (average of 3.38% and median of 3.52%).
Simões et al. (2012) developed a study comparing the abnormal returns of stocks of companies from different sectors that were involved in mergers and acquisitions in Brazil, Argentina and Chile, by means of a robust event study. hey concluded that an increase took place
in Brazil, represented by abnormal returns during the days of the event, while in Argentina and Chile, the subsequent abnormal returns of the days of the announcement were not signiicant.
2.1 Mergers and acquisitions in the banking
sector
In the banking sector, Siems (1996) studied the consolidation of the banking market in the United States in 1995 applying the event study method. Taking into account nineteen M&A cases, the author concluded that in general, the abnormal returns of acquiring banks was signiicantly negative, while the abnormal returns of the acquired banks was signiicantly positive.
Nnadi and Tanna (2013) analyzed acquisitions above a billion pounds of European banks that took place between 1997 and 2007 and compared them with domestic and transnational (cross border) acquisitions by means of the TSAR (Total Standardized Abnormal Return) method. he results showed that transnational acquisitions generated positive abnormal returns over a longer period of time (more days after the date of the announcement) than domestic operations, revealing greater investor conidence in the eiciency of those operations.
Regarding the Brazilian banking sector, Pessanha et al. (2014), Batistella (2005), and Brito et al. (2004) published two studies on value creation in M&A using the event study method. he results show that no value was created by M&A in the banking sector. he M&A processes had no impact on market returns of inancial institutions in Brazil. Similarly, Siems (1996) stated that Brazilian acquirers didn’t receive any positive abnormal returns.
not economically reasonable in view of the risks incurred in operations. hat inding, apparently a paradox, shows that the results for the two groups of shareholders are not only unequal, but also contribute to the creation of an undesirable asymmetry that favors the shareholders of the acquired companies.
3 EVENT STUDY
he event study model seeks to understand and analyze the impact that a particular event generates on any given variable. In this article, the event study method is used to analyze the impact of M&A processes (speciic event) on the stocks of banks that were merged or acquired (variables) by applying the Corrado test and the TSAR test to ind out to what extent those processes contribute to value creation for the participating companies.
Campbell et al. (1997) deined a seven-step framework for the development of an event study: deinition of the event; sample selection; measurement of normal and abnormal returns; estimation procedures; test procedures; empirical results; interpretations and conclusions. The method is based on the assumed occurrence of an abnormal return after a particular event. hus, a normal return, which is expected if the event doesn’t occur, is calculated based on the projection of historical returns obtained before the event. After the event, the actual return is compared to the normal forecast and possible deviations are analyzed.
he returns of the analyzed stocks, the market indices (from 1994 to 2012, obtained by Standard & Poor’s CapitalIQ), and the risk-free rate of the Brazilian market, the SELIC (from 1999) published by the Central Bank of Brazil were collected to develop the study.
he second step was to deine the expected return of the asset for the analyzed time period. hree techniques are commonly used: average, factor model, and economic models. We adopted the factor model, which is justiied as we follow the vision of Brown and Weinstein (1985), who
claim that it is more accurate than the average and takes into account only one factor, unlike the multivariate economic models, which would not signiicantly beneit our approach.
he method developed is based on the analysis of stock returns of banks that took part in M&A processes in that period and by measuring the efects of these processes on value creation for the companies.
Campbell et al. (1997) state that, along with the study of interest, in this case the efective date of acquisition, there is need to describe the period in which the market value of the shares will be impacted by the event. hus, the event window must be deined close to the established date. In addition, according to the authors, after deining the studied windows, a criterion for the selection of the companies must be selected, taking into account their data availability and liquidity.
Based on that information, the event window is deined, i.e. the time interval before and after its occurrence. his allows us to detect abnormal price reactions after the event has occurred, or if there were leaks of information (insider trading) prior to the announcement of the transaction. he event window should be neither too short, which could exclude information leaks, nor too long, to avoid data collection being inluenced by other factors unrelated to the study.
Abnormal returns are defined as the difference between the observed return and the expected return. hey are measured by the log-returns to obtain a greater accuracy of the regression processes and of the comparison of the transactions. he expected return of asset i is given by the market model by Campbell, Lo and McKinlay (1997):
(1)
where:
E(Rit): expected return on asset i at t; αi: intercept;
βi: inclination to asset i;
he intercept coeicient and the slope coeicient are obtained through a simple linear regression via ordinary least squares (OLS), where the equation that relates the returns of assets to the market can be represented by a straight line, its intercept being αi and its inclination being βi. We used the Newey-West method (1987) in the regression model to correct the heteroscedasticity and the autocorrelation of model residuals.
After the calculation of returns, the measurement of abnormal returns was performed, considered ex-post through the subtraction between the actual return and the return estimated by the market model. he actual return is then measured by the stock price change:
(2)
hus, the abnormal return is given by:
(3)
where:
ARi: abnormal return on asset i
As an event usually doesn’t just impact on the date it takes place, but rather over a certain period of time, some criteria for aggregating abnormal returns must be established. According to Campbell, Lo and Mackinley (1997), abnormal returns need to be aggregated to be interpreted. To do so, we used the Cumulative Abnormal Return (CAR), obtained by the simple sum of all abnormal returns contained in an event window. he cumulative abnormal returns are obtained by applying the following formula:
(4)
where:
CARi: cumulative abnormal return on asset i; τ1: irst day of the event window;
τ2: last day of the event window;
CAR = 0 means that there was no diference between estimated returns and real returns.
CAR < 0 means that the cumulative returns at the time of the acquisitions were lower than estimated in the analysis period;
CAR > 0 means that the cumulative returns at the time of the acquisitions were higher than estimated in the analysis period.
However, Boehmer, Masumeci, and Poulsen (1991) found that SAR (Standardized Abnormal Return) should be given preference over CAR, due to the fact that SAR penalizes the systemic efects that may inlate the variance of stock prices on the days close to the studied events.
Brown, CaioAlvira, and Powers (2013) used the event study to ind out whether the financial recommendations of newspapers in circulation in the United States significantly impacted the prices of the respective shares. To this end, SAR (Standardized Abnormal Return) was chosen, according to the method by Boehmer, Masumeci, and Poulsen (1991):
(5)
where:
: standard deviation of asset i of abnormal returns during the estimation window
: number of trading days in the estimation period of stock i
: average market return during the event window
Boehmer, Masumeci, and Poulsen (1991) also showed that the use of abnormal returns (AR) provides a high probability of rejecting the null hypothesis when it is true. herefore, one may say that SAR is more robust than AR and that it also tends to capture the exclusive impacts of the event in question more accurately.
(6)
he TSAR (Total Standardized Abnormal Return) or Total of the Standardized Abnormal Return is obtained by dividing the sum of the standardized abnormal returns (SARs) by the number of companies analyzed by the event study. Brown, Caio-Alvira, and Powers (2013), as well as Boehmer, Masumeci, and Poulsen (1991), developed the Zstatistic to ind out whether the event in question has a signiicant inluence on stock prices or not. he Zstatistic is given by:
(7)
he statistical test by Corrado was also applied, a non-parametric statistical analysis, where the abnormal returns of every estimation and event window of each acquisition (events) are ranked in ascending order. he rank (K) is applied between the lowest and highest abnormal return value of the event windows in question. If there are equal values, an average rank for that date is adopted.
he expected rank for the day of the event is an average rank resulting from the sum of the total amount of abnormal returns (T), which varies according to the event window adopted, i.e.: in the case of -10 and +10 days, the total number of analyzed days is 71 (ifty days for the estimation window, twenty days for the event window, and one day for the event), plus one and divided by two (the same calculation was applied to diferent event windows: -7 and +7 days, -5 and +5 days, -3 and +3 days, +1 and -1 day, and D0, featuring diferent total amounts of returns):
(8)
he number of ranks is the same for all assets, thus the same expected rank is used for the
calculation of all assets, taking into account the same event window.
he Corrado test is used to deine whether the abnormal returns are statistically equal to zero, with a 95% conidence, on only one day of the event window, by applying the following formula:
(9)
where:
: rank of asset i at date t (event day)
: expected rank
: standard deviation
: sample size (number of acquisitions, in our case 40).
In turn, the standard deviation (s(K)) is calculated as follows:
(10)
: rank for asset i at date t;
: expected rank;
:: sample size (number of acquisitions; in our case 40).
: total value of abnormal returns (sum of the estimation window and of the event window, when the latter is -10 and +10 days, T = 71).
TSAR is calculated as the sum of the SARs on a given date of the event window. he Zstatistic is computed by dividing each TSAR by the root of the number of events, in our case 40 acquisitions. hus, it can be concluded that TSAR is statistically equal to zero, with a 95% conidence.
3.1 Sampling
he following criteria were adopted to deine the sample:
b) Shares traded with suicient liquidity to perform the necessary calculation.
c) Events considered a transfer of control, according to the oicial publication of the Central Bank of Brazil.
d) Only acquisitions and mergers among financial institutions or those which somehow represented operating scale gains were taken into account. Transactions of assets or acquisitions of parts of companies whose core activity is noninancial were considered investments; they could cause noise in the interpretation of the market
and consequently in the statistical test. e) Only transactions that occurred at
domestic level were taken into account, allowing us to identify a pattern of institutional and political organization (or habit) of information disclosure.
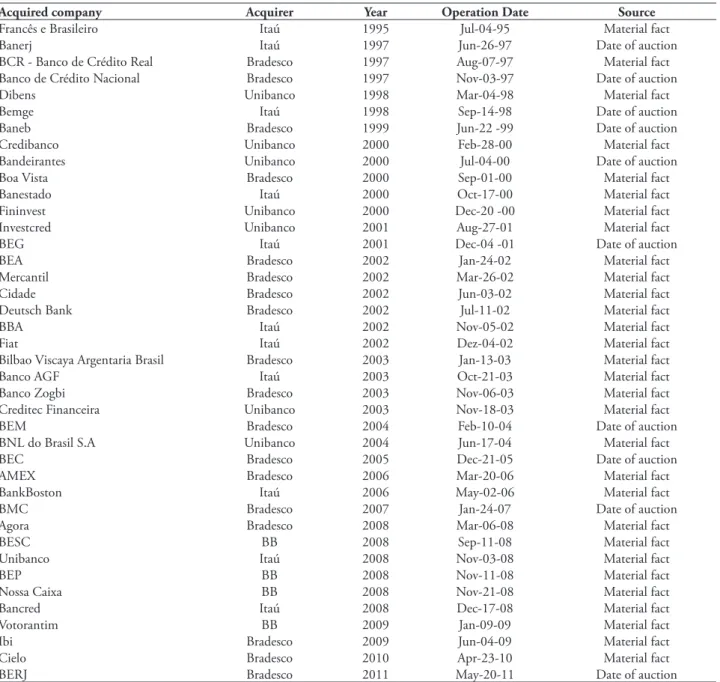
Once those prerequisites were met, the final sample was composed of 40 operations that became the object of the study. he sample contained only one oicially declared merger operation that took place between Itaú and Unibanco in 2008. he remaining operations are classiied and reported as acquisitions. All of them are displayed in the following table:
TABLE 1 – Acquisitions in the Brazilian banking sector 1994-2011
Acquired company Acquirer Year Operation Date Source
Francês e Brasileiro Itaú 1995 Jul-04-95 Material fact
Banerj Itaú 1997 Jun-26-97 Date of auction
BCR - Banco de Crédito Real Bradesco 1997 Aug-07-97 Material fact Banco de Crédito Nacional Bradesco 1997 Nov-03-97 Date of auction Dibens Unibanco 1998 Mar-04-98 Material fact
Bemge Itaú 1998 Sep-14-98 Date of auction
Baneb Bradesco 1999 Jun-22 -99 Date of auction Credibanco Unibanco 2000 Feb-28-00 Material fact Bandeirantes Unibanco 2000 Jul-04-00 Date of auction Boa Vista Bradesco 2000 Sep-01-00 Material fact
Banestado Itaú 2000 Oct-17-00 Material fact
Fininvest Unibanco 2000 Dec-20 -00 Material fact Investcred Unibanco 2001 Aug-27-01 Material fact
BEG Itaú 2001 Dec-04 -01 Date of auction
BEA Bradesco 2002 Jan-24-02 Material fact
Mercantil Bradesco 2002 Mar-26-02 Material fact Cidade Bradesco 2002 Jun-03-02 Material fact Deutsch Bank Bradesco 2002 Jul-11-02 Material fact
BBA Itaú 2002 Nov-05-02 Material fact
Fiat Itaú 2002 Dez-04-02 Material fact
Bilbao Viscaya Argentaria Brasil Bradesco 2003 Jan-13-03 Material fact
Banco AGF Itaú 2003 Oct-21-03 Material fact
Banco Zogbi Bradesco 2003 Nov-06-03 Material fact Creditec Financeira Unibanco 2003 Nov-18-03 Material fact
BEM Bradesco 2004 Feb-10-04 Date of auction
BNL do Brasil S.A Unibanco 2004 Jun-17-04 Material fact
BEC Bradesco 2005 Dec-21-05 Date of auction
AMEX Bradesco 2006 Mar-20-06 Material fact
BankBoston Itaú 2006 May-02-06 Material fact
BMC Bradesco 2007 Jan-24-07 Date of auction
Agora Bradesco 2008 Mar-06-08 Material fact
BESC BB 2008 Sep-11-08 Material fact
Unibanco Itaú 2008 Nov-03-08 Material fact
BEP BB 2008 Nov-11-08 Material fact
Nossa Caixa BB 2008 Nov-21-08 Material fact
Bancred Itaú 2008 Dec-17-08 Material fact
Votorantim BB 2009 Jan-09-09 Material fact
Ibi Bradesco 2009 Jun-04-09 Material fact
Cielo Bradesco 2010 Apr-23-10 Material fact
BERJ Bradesco 2011 May-20-11 Date of auction
3.2 Parameters adopted
a) Period
he analyzed period ranges from 1994 to 2011, featuring the greatest activity in terms of M&A processes in the Brazilian banking sector. It begins at the time of the consolidation of the Real and ends in the years that followed the global economic crisis of 2008.
b) Assets analyzed Bradesco: BBDC4 Itaú: ITAU4 Unibanco: UBBR4
Itaú+Unibanco: ITUB4 after their merger Banco do Brasil: BBAS3
c) Event Date
he day on which the event information is made known to the market, represented by D0. Only one single day is taken into account for all samples.
d) Market Portfolio
he Index of the São Paulo Stock Exchange (Bovespa) was used as the market portfolio parameter. he stocks of the institutions analyzed by our study are all traded on Bovespa.
he prices of assets (shares) and the market portfolio (IBovespa) were obtained by the Capital IQ tool database, the S&P risk monitoring agency. he daily closing prices were used, as well.
e) Estimation Window
his is the period preceding the date of the event, which was also used to calculate the alpha and beta coeicient. he estimation window takes into account the 50 days before the beginning of the event window.
f ) Period of each event
he event period is one single day; it’s always represented by D0.
g) Event Window
Following the pattern used by other studies, and to ensure the relevance of both the sampling period of each event and the statistical signiicance, we adopted the 21-day period (D-10 to D+10, including D0).
The test was repeated using the event windows (D-7 to D+7; D-5 to D+5; D3 to D+3, D-1 to D+1, and D0 alone).
4 RESULTS
The Corrado tests (Tc) yielded the following results:
TABLE 2 – Corrado Test Results
Window N Tc p-Value (0,0) 40 -0.2432 0.38732
(-1,+1) 40 -0.2564 0.38604
(-3,+3) 40 -0.2958 0.38186
(-5,+5) 40 -0.3123 0.37995
(-7,+7) 40 -0.3238 0.37856
(-10,+10) 40 -0.3898 0.36976
Source: Prepared by the authors
Note: Signiicance levels: *10% **5% ***1%. Diferentiated estimate windows were chosen for the Corrado test to check the robustness of the results.
Regarding α=5%, Tc should be higher than +1.64 to show signiicant positive abnormal returns or lower than -1.64 to show negative abnormal returns in a signiicant way.
None of the diferent windows analyzed showed statistically significant results, which therefore doesn’t allow us to state whether the analyzed acquisitions created value (prevalence of positive returns) or destroyed value (negative returns). hese results corroborate the results obtained by Batistella (2005) and by Brito et al. (2004) who also applied the Corrado test.
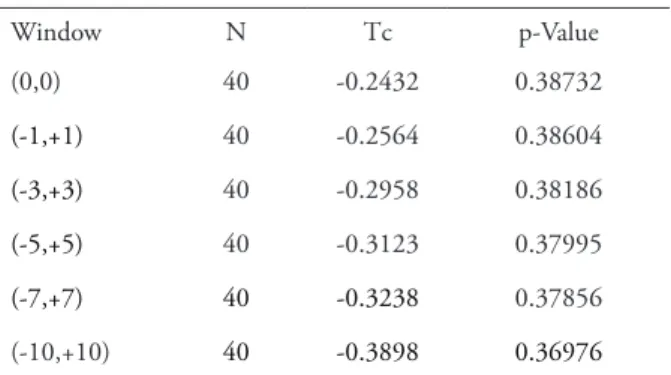
TABLE 3 – Results of the TSAR test for [-10;+10] days
t TSAR p-value
-10 0.091 0.938
-9 0.210 0.853
-8 0.011 0.993
-7 -0.004 0.997
-6 0.094 0.923
-5 0.175 0.869
-4 -0.224 0.840
-3 0.087 0.935
-2 -0.025 0.981
-1 -0.387 0.724
D0 0.129 0.855
1 -0.011 0.992
2 0.080 0.926
3 0.164 0.866
4 -0.121 0.924
5 0.010 0.992
6 0.062 0.951
7 -0.134 0.884
8 0.189 0.862
9 0.011 0.988
10 0.154 0.867
Source: Prepared by the authors
Note: Signiicance levels: *10% **5% ***1%. he results are more robust than those obtained by the Corrado test because they tend to capture the efects of M&A in the banking sector more exclusively, according to Boehmer, Masumeci, and Poulsen (1991). It is also worth noting that the results are robust to heteroskedasticity and to autocorrelation of model residuals.
TABLE 4 – Results of the TSAR test for [-7;+7] days
t TSAR p-value
-7 -0.005 0.996
-6 0.076 0.943
-5 0.178 0.869
-4 -0.217 0.849
-3 0.080 0.941
-2 -0.019 0.986
-1 -0.384 0.733
D0 0.127 0.860
1 -0.003 0.997
2 0.076 0.931
3 0.171 0.864
4 -0.120 0.926
5 0.000 1.000
6 0.067 0.948
7 -0.126 0.895
Source: Prepared by the authors
Note: Signiicance levels: *10% **5% ***1%. he results are more robust than those obtained by the Corrado test because they tend to capture the efects of M&A in the
banking sector more exclusively, according to Boehmer, Masumeci, and Poulsen (1991). It is also worth noting that the results are robust to heteroskedasticity and to autocorrelation of model residuals.
TABLE 5 – Results of the TSAR test for [-5;+5] days
t TSAR p-value
-5 0.181 0.866
-4 -0.217 0.846
-3 0.077 0.944
-2 -0.021 0.984
-1 -0.391 0.729
D0 0.122 0.868
1 -0.005 0.996
2 0.068 0.937
3 0.187 0.847
4 -0.125 0.922
5 0.003 0.998
Source: Prepared by the authors
Note: Signiicance levels: *10 % **5% ***1%. he results are more robust than those obtained by the Corrado test because they tend to capture the efects of M&A in the banking sector more exclusively, according to Boehmer, Masumeci, and Poulsen (1991). It is also worth noting that the results are robust to heteroskedasticity and to autocorrelation of model residuals.
TABLE 6 – Results of the TSAR test for [-3;+3] days
t TSAR p-value
-3 0.068 0.951
-2 -0.021 0.984
-1 -0.392 0.727
D0 0.108 0.886
1 -0.007 0.995
2 0.068 0.937
3 0.190 0.845
Source: Prepared by the authors
TABLE 7 – Results of the TSAR test for [-1;+1] days
t TSAR p-value
-1 -0.381 0.739
D0 0.085 0.913
1 -0.006 0.995
Source: Prepared by the authors
Note: Signiicance levels: *10 % **5% ***1%. he results are more robust than those obtained by the Corrado test because they tend to capture the efects of M&A in the banking sector more exclusively, according to Boehmer, Masumeci, and Poulsen (1991). It is also worth noting that the results are robust to heteroskedasticity and to autocorrelation of model residuals.
In all the results obtained in the previous tables, the TSAR test shows that the cumulative abnormal returns are statistically equal to zero, i.e. acquisitions in the banking sector has not signiicantly impacted the market value of the banks, with a 95% confidence. This fact is corroborated by the results obtained by Tabak, Fazio, and Cajueiro (2012) who state that the banking market in Latin America is dominated by monopolistic competition.
4 CONCLUSION
It can neither be affirmed that the acquisitions had a signiicant impact on value creation for purchasers and banks, nor can it be denied. Given the lack of preponderance of either positive or negative returns, the transactions may have been perceived in diferent manners.
In the event of positive returns, it is assumed that the market would see operational and inancial synergies, as well as scale gains or market share gains. However, those hypotheses are diicult to be veriied empirically.
Negative returns were interpreted as maximized administrator value, at the expense of maximized shareholder value, i.e. the market felt that the acquisitions were the result of inefficient decisionmaker rewarding systems. Negative returns could also be explained by payments of acquisition bonuses exceeding the
fair values appraised by the market, transferring the value of acquiring shareholders to the acquired shareholders, which indicates that there are other reasons behind the acquisition strategy.
The results may be explained by the fact that the synergies that followed the M&A processes in the banking sector only helped to consolidate major market players, which decreased the competitiveness in that sector. he negative abnormal returns in M &A are due to the monopolistic market competition structure (Tabak, Fazio, and Cajueiro, 2012)
REFERENCES
Ahern, K. R. (2007). Learning and strategy in mergers and acquisitions (Master dissertation). University of California, Los Angeles, CA, United States.
Andrade, G., & Staford, E. (2004). Investigating the economic role of mergers. Journal of Corporate Finance, 10(1), 1-36.
Batistella, F. D. (2005). Uma análise do valor gerado para acionistas de bancos brasileiros que izeram aquisições entre 1995 e 2004 (Dissertação de mestrado). Universidade de São Paulo, São Paulo, SP, Brasil.
Belaisch, A. (2003). Do Brazilian Banks Compete? [IMF Working Paper nº. 03/113]. International Monetary Fund, Washington, DC, United States.
Berger, A. N., Demsetz, R. S., & Strahan, P. E. (1999). he consolidation of the inancial services industry: Causes, consequences, and implications for the future. Journal of Banking & Finance, 23(2), 135-194.
Berkovitch, E., & Narayanan, M. P. (1993). Motives for takeovers: An empirical investigation.
Journal of Financial and Quantitative Analysis, 28(03), 347-362.
conditions of event-induced variance. Journal of Financial Economics, 30(2), 253-272.
Brito, G. A. S., Batistella, F. D., & Famá, R. (2005). Fusões e aquisições no setor bancário: Avaliação empírica do efeito sobre o valor das ações. Revista de Administração da Universidade de São Paulo, 40(4), 353-360.
Brown, S., Cao-Alvira, J. J., & Powers, E. (2013). Do investment newsletters move markets?
Financial Management, 42(2), 315-338.
Brown, S. J., & Weinstein, M. I. (1985). Derived factors in event studies. Journal of Financial Economics, 14(3), 491-495.
Camargos, M. A., & Barbosa, F. V. (2009). Fusões e aquisições de empresas brasileiras: criação de valor e sinergias operacionais. RAE - Revista de Administração de Empresas, 49(2), 206-220.
Campbell, J. Y., Lo, A. W. C., & MacKinlay, A. C. (1997). he econometrics of inancial markets
(Cap. 4, pp. 149-180). Princeton, NJ: Princeton University Press.
Loughran, T., & Vijh, A. M. (1997). Do long-term shareholders beneit from corporate acquisitions?
Journal of Finance, 52(5), 1765-1790.
Nakane, M. I. (2001). A test of competition in Brazilian banking [Working Paper Series 12].
Banco Central do Brasil, Brasília, DF, Brasil.
Newey, W. K., & West, K. D. (1987). A simple, positive semi-deinite, Heterokesdacitiy and to autocorrelation Consistent Covariance Matrix.
Econometrica, 55(3), 703-708.
Nnadi, M., & Tanna, S. (2013). Analysis of domestic and cross-border Mega-M&As of
European Commercial Banks. Managerial inance, 39(9), 848-862.
Petterini, F. (2003). Análise da competição dos bancos privados nacionais nas operações de crédito do sistema inanceiro nacional (Dissertação de mestrado). Universidade Federal do Ceará, Fortaleza, CE, Brasil.
Pessanha, G. R. G., Santos, T. A. D., Calegario, C. L. L., Sáfadi, T., & Alcântara, J. N. D. (2014). Influências das fusões e aquisições no valor de mercado das instituições bancárias adquirentes.
Contabilidade, Gestão e Governança, 17(3), 145-158.
Pinheiro, A. C., & Moura, A. (2003). Segmentation and the use of information in Brazilian credit markets. In M. J. Miller (Ed.), Credit reporting systems and the international economy (pp. 335-396). Cambridge, MA: he MIT Press.
Siems, T. F. (1996). Bank mergers and shareholder wealth: Evidence from 1995’s megamerger deals.
Financial Industry Studies, Federal Reserve Bank of Dallas, Dallas, TX, United States.
Simões, M. D., Macedo-Soares, T. D. L., Klotzle, M. C., & Pinto, A. C. F. (2012). Assessment of market eiciency in Argentina, Brazil and Chile: An event study of mergers and acquisitions. BAR-Brazilian Administration Review, 9(2), 229-245.
Steinberg, F. (2009). Governança corporativa e ganhos de sinergia de fusões e aquisições no Brasil
(Dissertação de mestrado). Universidade Federal do Rio de Janeiro, Rio de Janeiro, RJ, Brasil.
![TABLE 3 – Results of the TSAR test for [-10;+10] days t TSAR p-value -10 0.091 0.938 -9 0.210 0.853 -8 0.011 0.993 -7 -0.004 0.997 -6 0.094 0.923 -5 0.175 0.869 -4 -0.224 0.840 -3 0.087 0.935 -2 -0.025 0.981 -1 -0.387 0.724 D0 0.129 0.855 1 -0.011 0.992 2](https://thumb-eu.123doks.com/thumbv2/123dok_br/18914866.433152/9.871.74.412.110.514/table-results-tsar-test-days-tsar-value-d.webp)
![TABLE 7 – Results of the TSAR test for [-1;+1] days t TSAR p-value -1 -0.381 0.739 D0 0.085 0.913 1 -0.006 0.995](https://thumb-eu.123doks.com/thumbv2/123dok_br/18914866.433152/10.871.74.407.131.224/table-results-tsar-test-days-tsar-value-d.webp)
