T
O
ABSTRACT
RESUMO
EVALUATION OF WEIGHT LOSS AND SURFACE
ROUGHNESS OF COMPOMERS AFTER SIMULATED
TOOTHBRUSHING ABRASION TEST
AVALIAÇÃO DA PERDA DE MASSA E RUGOSIDADE SUPERFICIAL DE COMPÔMEROS
APÓS TESTE DE ABRASÃO POR ESCOVAÇÃO SIMULADA
Rafael Francisco Lia MONDELLI1, Linda WANG2, Fernanda Cristina Pimentel GARCIA3, Anuradha PRAKKI3
José MONDELLI4, Eduardo Batista FRANCO4, Aquira ISHIKIRIAMA4
1- DDS, MSc, PhD, Assistant Professor, Department of Operative Dentistry, Endodontics and Dental Materials, Bauru Dental School, University of São Paulo, Bauru, Brazil.
2- DDS, MSc, PhD, Assistant Professor, Department of Operative Dentistry, University North of Paraná (UNOPAR), Londrina, Brazil. 3- DDS, MSc, PhD, Graduate student (Doctor degree), Department of Operative Dentistry, Endodontics and Dental Materials, Bauru Dental School, University of São Paulo, Bauru, Brazil.
4-DDS, MSc, PhD, Associate Professor, Department of Operative Dentistry, Endodontics and Dental Materials, Bauru Dental School, University of São Paulo, Bauru, Brazil.
Corresponding address: Departamento de Dentística, FOB-USP - CxP. 73, Bauru, SP. Cep.: 17012-901-Brazil.
e-mail: [email protected] - Phone: 55 14 32358265 - Fax: 55 14 32241388
Received: June 28, 2004 - Modification: August 17, 2004 - Accepted: March 23, 2005
his study aimed at analyzing the compomers wear by an “in vitro” toothbrushing abrasion test. The null hypotheses tested were that there would be no differences in weight loss and no significant changes in surface roughness of the compomers after this test. The utilized commercial brands were Dyract (Dentsply), Dyract AP (Dentsply), Compoglass F (Vivadent), Freedom (SDI), F2000 (3M ESPE), which were compared to the two resin composites Z100 (3M ESPE) and Silux Plus (3M ESPE). Ten cylindrical specimens for each commercial brand were prepared with 5mm diameter and 3mm thickness. An appropriate machine with soft bristle tips containing dentifrice solution and deionized water was used. A total of 100,000 brushing cycles were performed. The amount of weight loss was measured by the percentage alteration between the initial (before toothbrushing) and final weight (after toothbrushing), measured by a Sartorius analytical balance. The surface roughness change was determined by the percentage difference between initial and final means after 5 tracings by a T 1000 Hommel Tester roughness meter on the specimen’s surfaces before and after toothbrushing abrasion test. The statistical analysis (Students paired t-test, ANOVA and Tukey, á=0.05) showed that all materials presented statistically significant weight loss and roughness increase after abrasion test. All compomers presented higher weight loss than resin composites. Freedom and Dyract AP presented the lowest weight loss among compomers. F2000 presented the worst abrasion resistance, without statistical differences with Dyract. For roughness changes, Dyract, Dyract AP, Z100, Compoglass F and Silux Plus showed the lowest surface roughness alteration, in increasing order, without statistical differences between them. Freedom was the statistically roughest material of the study.
Uniterms: Surface roughness; Wear; Toothbrushing abrasion; Compomer.
objetivo deste estudo foi avaliar a resistência ao desgaste de compômeros submetidos a um teste escovação simulada. A hipótese nula testada foi que não haveria diferenças em perda de massa e alterações de rugosidade superficial entre os compômeros após o teste. Os materiais empregados foram o Dyract (Dentsply), Dyract AP (Dentsply), Compoglass F (Vivadent), Freedom (SDI), F2000 (3M ESPE), comparados às resinas compostas Z100 (3M ESPE) e Silux Plus (3M ESPE). Para cada material, dez espécimes cilíndricos foram confeccionados com 5 mm de diâmetro e 3 mm de espessura. Para o teste de abrasão, uma máquina com escovas de cerdas macias e uma solução de dentifrício e água deionizada foi utilizada. Foram realizados 100.000 ciclos de escovação simulada. A perda de massa foi verificada através da diferença em porcentagem entre a massa inicial (antes da escovação) e massa final (após a escovação) através de uma balança analítica Sartorius. A alteração de rugosidade superficial foi determinada pela diferença em porcentagem entre as médias de rugosidade inicial e final, após 5 leituras aleatórias por espécime realizado pelo rugosímetro Hommel Tester T 1000 antes e depois do teste de abrasão. A análise estatística (Teste t pareado, ANOVA e Tukey, á=0,05) demonstrou que todos os materiais do estudo apresentaram perda de massa e aumento significante de rugosidade. Todos os compômeros apresentaram maior perda de massa em relação às resinas compostas. Entre os compômeros, Freedom e Dyract AP apresentaram a menor perda de massa. F2000 apresentou a maior alteração de massa sem diferenças estatísticas quando comparado ao Dyract. Quanto à rugosidade superficial, Dyract, Dyract AP, Z100, Compoglass F e Silux Plus se tornaram mais rugosos, porém sem diferenças estatísticas entre si. Freedom apresentou a maior alteração de rugosidade após o teste de escovação simulada.
INTRODUCTION
The association of composite resins and glass ionomer cement components determined a category of restorative materials called compomers7,15. Fluoride release, good
biocompatibility, adhesion to enamel and dentin are some of their benefits. They are light cured, easy to handle and present superior strength when compared to conventional glass ionomer cements. Compomer is classified as a resin composite modified by polyacid, because it does not present acid-base reaction like the ionomer cements20.
Wear is defined as progressive loss of substance from the surface of a material caused by a mechanical action10.
Clinically, wear of restorative materials can result in loss of contour, increase in surface roughness, staining and plaque retention27. Thus, evaluation of the mechanical
properties1,4,7,12,15,26,27,28,30 of restorative materials is necessary
to ascertain their indications and limitations. Some variables of compomers’ composition can create different wear rates, such as curing method, monomer system, particle size, filler treatment and the effect of aging3.
“In vitro” toothbrushing test is effective to achieve rapid comparative data and is reliable to evaluate the wear resistance of restorative materials under specific standardized conditions29,32. “In vivo” methods suffer from
certain disadvantages, which include lack of reproducibility and time involved. The aim of this study was to evaluate the wear resistance of five commercial compomers, Dyract (Dentsply), Dyract AP (Dentsply), Compoglass F (Ivoclar/ Vivadent), Freedom (SDI), F2000 (3M ESPE), compared to the resin composites Z100 (3M ESPE) and Silux Plus (3M ESPE) in relation to their weight loss and surface roughness alteration after simulated toothbrushing abrasion test. The null hypotheses were that there would be no differences in weight loss and no significant changes in surface roughness after simulated toothbrushing test.
MATERIAL AND METHODS
The materials utilized in this study are presented in Table 1. Ten cylindrical specimens for each commercial brand were prepared with 5mm diameter and 3mm thickness. The specimens were obtained from a silicon mold, which was filled in a single increment with the materials and covered with a polyester matrix. They were polymerized through the
matrix for 60 seconds on each side with a light intensity between 450 to 500 mW/cm2 by the curing unit XL 3000 (3M
ESPE). Afterwards, they were polished using Sof-Lex (3M ESPE) discs. Then, specimens were ultrasonically cleaned for 10 minutes and individually stored in deionized water at 37oC for 24h until first initial weight measurement.
The initial weight measurement was done on an analytical balance with 0.0001g accuracy (Sartorius-Werke A.G., Germany). Each specimen was dried with absorbent paper to remove excess water. The samples were weighted every 24 hours during 2 weeks until they reached a constant weight on three consecutive days of measurements. The mean of the last three measurements was considered the baseline weight. The superficial roughness analysis was determined using a Hommel Tester T 1000 roughness meter (Hommel Tester T 1000 – Hommelwerke). They were expressed in Ra values (Roughness average-µm). For each tested specimen surface, tracings were performed for five randomized directions in different locations. Baseline roughness was obtained by the arithmetic mean of these readings. The toothbrush abrasion machine was adapted by Vieira31 (1960),
with the cycle’s speed set at 374 strokes per minute. Soft nylon bristles toothbrushes heads (Colgate ClassicTM,
Colgate-Palmolive Co., Osasco, São Paulo, Brazil) were adjusted to the toothbrushing simulation machine. The amplitude of movement was 3.8cm with 200 grams of weight. The specimens were submitted to 100,000 strokes of toothbrushing, performing a total of four hours and forty-five minutes to each group of material. This period is correspondent to 4.2 years of toothbrushing6. Slurry was
prepared with 50 grams of Colgate MFP (Colgate-Palmolive Co., Osasco, São Paulo, Brazil) toothpaste and 100 grams of distilled water, according to the ISO specification8. During
the test, slurry was constantly renewed for each 10,000 strokes. The slurry pH was checked during the test and presented the value of 8.6 without changes. After 50,000 strokes the specimens were moved from the right to the left side in the testing machine. Following the test, the specimens were removed and ultrasonically cleaned with water for 10 minutes. Final weight and roughness measurements were made according to initial measurement protocols. Weight loss was obtained by the percentage alteration between initial and final measurements. Roughness alteration was observed by the percentage difference between baseline and final reading means23,29.
Student paired t-test was applied to the data to evaluate
Materials Manufacturer Batch Number Inorganic Filler (% weight)
Dyract Dentsply 9706000436 Not supplied
Dyract AP Dentsply 9803001441 73%
Compoglass F Vivadent 902646 77%
Freedom SDI 2239 77%
F2000 3M ESPE 23038 84%
Z100 3M ESPE 8004 71%
Silux Plus 3M ESPE 19970603 52%
differences between initial and final values of the analyzed properties. Analysis of variance (ANOVA) and Tukey test were made to compare roughness and weight changes between materials. The significance level was determined at a=0.05.
RESULTS
The Student paired t-test indicated that, after the abrasion test, all materials suffered significant weight loss (Table 2) and roughness increase (Table 3) (p<0.05). Table 2 presents the results of materials weight loss and Figure 1 graphically depicts the weight loss percentage for each experimental group. For all compomers, weight loss was higher than resin composites. Freedom and Dyract AP presented the lowest wear among compomers. There were no differences between Z100, Silux Plus and Freedom. F2000 presented the worst abrasion resistance results, without statistical differences with Dyract (p<0.05). The results of surface roughness alteration after toothbrushing can be observed in Table 3 and Figure 2. Dyract, Dyract AP, Z100, Compoglass F and Silux Plus showed the lowest surface roughness alteration, in increasing order, without differences between them. F2000 and Freedom showed the statistically highest alteration (p<0.05) when compared to other materials, presenting statistical differences between them.
DISCUSSION
Table 2 and Figure 1 present the weight changes of tested materials. All materials presented significant weight loss after the abrasion test. Although Z100 was the most resistant material (1.27%), it was not statistically different from Silux Plus (2.20%) and the compomer Freedom (2.86%). Neither there was any statistically significant difference between the compomers Freedom, Dyract AP, Compoglass F and Dyract. The weight loss of F2000 was statistically higher than the weight loss of other compomers, showing no statistical differences with Dyract. The weight loss of Z100 composite was expected to be lower than the compomers3,11,12,14,16,17,18,21,22 as they present 71% of filler
weight, protecting the organic matrix from abrasion6.
Clinically, this material also presents a better performance (compared to compomers) and is recommended to be utilized in areas with high masticatory load. In this study, 100,000 brushing cycles were done, corresponding to approximately 4.2 years of “in vivo” brushing5. Taking into consideration
that Dyract AP and Freedom presents 73% and 77% of filler weight, the good performance of Silux Plus must also be observed as this material presents only 52% of inorganic filler by weight.
Wear of the organic matrix, exposure of inorganic particles and loss of the filler particles probably explain the mechanism of abrasion in composites25. The toothbrushing
abrasion test provides contact between toothbrush bristles and dentifrices2,3,6,9,13 but does not include all mechanisms
of wear which restorative materials are subjected to in the oral cavity. Other types of wear are related to abrasion with foodstuff, load in occlusal areas of teeth and erosion24. They
can act on organic matrix, on the filler particles or on the matrix/filler interface24. Additionally, in high cariogenic
challenge conditions, acidic pH is established, leading to a decrease in wear resistance due to the abrasion test. This is in accordance with the findings of Attin, et al.1 (1998), in
which the compomers Dyract and Compoglass F presented higher levels of wear when submitted to brushing with acidic solution when compared to neutral pH solution.
For the aforementioned reasons, the present test is not
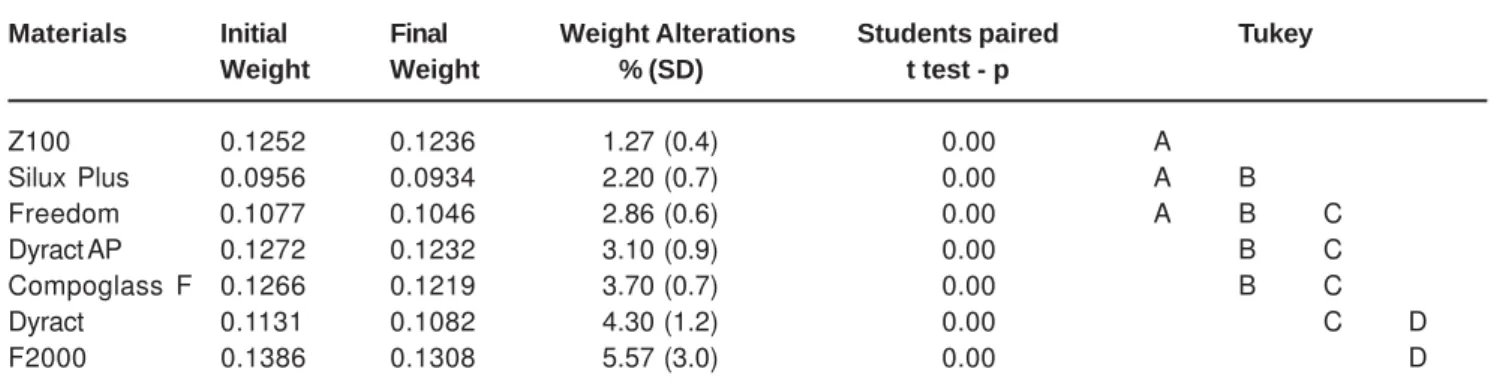
Materials Initial Final Weight Alterations Students paired Tukey Weight Weight % (SD) t test - p
Z100 0.1252 0.1236 1.27 (0.4) 0.00 A
Silux Plus 0.0956 0.0934 2.20 (0.7) 0.00 A B
Freedom 0.1077 0.1046 2.86 (0.6) 0.00 A B C
Dyract AP 0.1272 0.1232 3.10 (0.9) 0.00 B C
Compoglass F 0.1266 0.1219 3.70 (0.7) 0.00 B C
Dyract 0.1131 0.1082 4.30 (1.2) 0.00 C D
F2000 0.1386 0.1308 5.57 (3.0) 0.00 D
TABLE 2- Means of initial weight, final weight, weight alterations (%) and statistical analysis
n=12; p<0.05; Different letters indicate statistical differences.
able to simulate the wear performance that happens “in vivo”, but it is effective to provide rapid comparative data regarding abrasion wear resistance of restorative materials under specific standardized conditions19. For instance, in the
present study Z100 presented 1.27% of weight loss and Silux Plus 2.20%, which did not differ statistically. However, when the two materials are clinically compared, the microfiller composites (Silux Plus) do not present a superior performance as the hybrid composites in posterior teeth. On the other hand, they present low roughness and are largely used for anterior teeth and subgingival restorations. Beyond tested compomers, although F2000 presents 84% of filler weight, it showed the highest weight loss (5.57%). Freedom and Dyract AP had the lowest weight alteration and present 77% and 73% of filler weight respectively; these rates demonstrate that not always compomers with high percentage of inorganic filler in weight presents high abrasion resistance. Other composition characteristics must be taken into account, such as filler type/size and the silane treatment. The speculation that the deficient treatment of compomer filler particles, which connect them to the organic matrix, is one of the reasons to decrease the wear resistance of these materials must be considered. All compomers presented higher values of weight loss than composites.
The one-year clinical evaluation of the compomer Dyract in class I and II restorations in primary molars demonstrated
that this material presented mean wear of 100mm in the first 6-month evaluation and 90mm in the following 6 months, totalizing a mean wear of 190mm in one year26. The authors
observed loss of occlusal anatomy and proximal contacts. Hse and Wei7 (1997) observed similar results. This study
also evaluated Dyract’s clinical behavior in primary molars after one-year control. The authors showed that the restorations presented marginal discoloration and occlusal wear higher than hybrid resin composite restorations.
The roughness alteration results of the studied materials are shown in Table 3 and Figure 2. All materials were subjected to the same initial polishing treatment and presented a significant increase in surface roughness mean, but in different rates. The materials roughness alteration values were: Dyract (30%), Dyract AP (35%), Z100 (41%), Compoglass F (63%) and Silux Plus (77%). They were not statistically different. Comparable results to roughness changes after toothbrushing abrasion test were also observed by Gladys, et al.4 (1997), with similar roughness
alteration for Dyract and the resin composites Silux Plus and Z100, being statistically different from a conventional ionomer cement or resin-modified ionomer.
A compomer (Dyract), a resin-modified ionomer cement (Fuji II LC) and a hybrid resin composite (Pekafill) were clinically compared and evaluated for three years, in terms of marginal integrity, color alteration and surface roughness by Van Dikjen30 (1996). After this period, the author observed
that the resin composite presented the best marginal adaptation and the smallest roughness alteration. Dyract presented low color alteration and intermediate roughness alteration among materials. Fuji II LC presented the highest color and roughness changes.
In this present study, Z100 did not present great differences regarding the roughness changes when compared to Silux Plus and some of the tested compomers (Dyract, Dyract AP and Compoglass F). These materials can be indicated for class V cavities, non-carious cervical lesions and areas adjacent to periodontal tissues. Regarding Freedom, it yielded statistically higher alterations than all tested materials. This can lead to more plaque accumulation, irritating periodontal tissues if inserted near them. According to the manufactuer, F2000 presents 84% of filler particles by weight and also showed high weight loss (5.57%). The
Materials Initial Final Roughnes Alterations Students paired Tukey Roughnes Roughnes % (SD) t test - p
Dyract 0.679 0.889 30.0 (21.0) 0.00 A
Dyract AP 0.605 0.816 35.0 (17.0) 0.00 A
Z100 0.679 0.950 41.0 (27.0) 0.00 A
Compoglass F 0.659 1.074 63.0 (53.0) 0.00 A
Silux Plus 0.325 0.575 77.0 (36.0) 0.00 A
F2000 0.602 1.709 184.0 (70.0) 0.00 B
Freedom 0.540 2.030 276.0 (102.0) 0.00 C
TABLE 3- Means of initial roughness, final roughness, roughness changes (%) and statistical analysis
n=12; p<0.05; Different letters indicate statistical differences.
indication of this material must be carefully revised, as the reason for this increased roughness may be the higher dislodgement of inorganic particles, determining low abrasion resistance.
Long-term clinical evaluations are necessary to better indicate this category of materials that were introduced in the market to combine the advantages of resin composites and ionomer cements.
CONCLUSIONS
Based on the results of this study, the anticipated null hypotheses were rejected:
· All tested materials showed statistically significant weight loss and surface roughness increase after toothbrushing abrasion test.
· All compomers presented higher weight loss than resin composites (Z100 and Silux Plus) after brushing abrasion test.
REFERENCES
1- Attin T, Buchalla W, Trett A, Hellwig E. Toothbrushing abrasion of polyacid-modified composites in neutral and acid buffer solutions. J Prosthet Dent. 1998; 80:148-50.
2- De Gee AJ, Ten Harkel-Hagenaar HC, Davidson CL. Structural and physical factors affecting the brushing wear of dental composites. J Dent. 1985;13:60-70.
3- Ehrnford L. Surface microstructures of composite resins after toothbrush-dentifrices abrasion. Acta Odont Scand. 1983;41:241-5.
4- Gladys S, Van Meerbeek B, Braem M, Lambrechts P, Vanherle G. Comparative physico-mechanical characterization of new hybrid restorative material with conventional glass-ionomer and resin composite restorative materials. J Dent Res. 1997;76:883-94.
5- Harrington E, Jones PA, Fisher SE, Wilson HJ. Toothbrush-dentifrice abrasion. Br Dent J. 1982;153:135-8.
6- Heath JR, Wilson HJ. Abrasion of restorative materials by toothpaste. J Oral Rehab. 1976;3:121-38.
7- Hse MYK, Wei SHY. Clinical evaluation of compomer in primary teeth: 1-year results. J Amer Dent Ass. 1997;128:1088-96.
8- International Organization for Standization. Technical specification 14569-1. Dental Materials – guidance on testing of wear resistance – Part 1: wear by tooth brushing. Switzerland, ISO; 1999.
9- Jones PA, Fisher SE, Wilson HJ. Abrasivity of dentifrices on anterior restorative materials. Br Dent J. 1985;158:130-3.
10- Jones DW, Jones PA, Wilson HJ. A simple abrasion test for composites. J Dent. 1972;1:28-34.
11- Jorgensen KD. In vitro wear tests on macro-filled composite restorative materials. Aust Dent J. 1982;27:153-8.
12- Jorgensen KD. Restorative resins: abrasion vs. mechanical properties. Scand J Dent Res. 1980;88:557-68.
13- Kanter J, Koski RE, Martin D. The relationship of weight loss to surface roughness of composite resins from simulated toothbrushing. J Prosthet Dent. 1982;47:505-13.
14- Krejci I, Lutz F, Zedler Z. Effect of contact area size on enamel and composite wear. J Dent Res. 1992;71:1413-6.
15- Lavis JF, Peters TC, Makinson OF, Mount GJ. Changes to Dyract restorative resin immersed in various media. Am J Dent. 1997;10:133-6 .
16- Leinfelder KF. et al. Five-year clinical evaluation of anterior and posterior restorations of composite resin. Oper Dent. 1980;5:57-65.
17- Leinfelder KF, Wilder AD Jr, Teixeira LC. Wear rates of posterior composite resins. J Amer Dent Ass. 1986;112:829-33.
18- Macchi RL, Beigelis AA, Ribas LM. Wear in three different composite resins. Acta Odontol Latinoamer. 1984;1:37-40.
19- McKinney JE, Wu W. Chemical softening and wear of dental composites. J Dent Res. 1985;64:1326-31.
20- McLean JW, Nicholson JW, Wilson AD. Proposed nomenclature for glass ionomer dental cements and related materials. Quintessence Int. 1994;25:587-9.
21- Mitchem JC, Gronas DG. In vivo evaluation of the wear of restorative resins. J Amer Dent Assoc. 1982;104:333-5.
22- Mondelli RFL. Uso clínico das resinas compostas em dentes posteriores. Maxiodonto Dentística.1995;3:1-58.
23- Mondelli RFL, Prakki A, Cilli R, Navarro MFL, Mondelli J. Surface roughness and electron microscopic observations of resin luting agents. J Appl Oral Sci. 2003;11:327-31.
24- Nagem Filho H. Materiais dentários: resinas compostas. Bauru: Artes Gráficas; 1999. p.84.
25- O’brien WJ, Yee Jr J. Microstructure of posterior restorations of composite resin after clinical wear. Oper Dent. 1980;5:90-4.
26- Peters TCB, Roeters JJM, Frankenmolen FWA. Clinical evaluation of Dyract in primary molars: 1-year results. Amer J Dent 1996;9:83-7.
27- Peumans M, Van Meerbeek B, Lambrechts P, Vanherle G, Quirynen M. The influence of direct composite additions for the correction of tooth form and/or position on periodontal health. A retrospective study. J Periodontol. 1998;69:422-7.
28- Peutzfeldt A, Asmussen E. Modulus of resilience as predictor for clinical wear of restorative resins. Dent Mater. 1992;8:146-8.
29- Rios D, Honório HM, Araujo PA, Machado MAAM. Wear and superficial roughness of glass ionomer cements used as sealants, after simulated tooth brushing. Pesq Odontol Bras. 2002;16:343-8.
30- Van Dijken JWV. 3-year clinical evaluation of a compomer, a resin-modified glass ionomer and resin composite in class III restorations. Amer J Dent. 1996;9:195-8.
31- Vieira DF. Studies on hardness and abrasion resistance of acrylic resins. Thesis - Master, Indianapolis, Indiana. July 1960. p101.