ABSTRACT:Objective: To estimate the prevalence of underweight, overweight, and obesity among children who were beneiciaries of the Brazil’s conditional cash transfer program Bolsa Família during 2010, according to gender and health in the state of Mato Grosso do Sul, Brazil. Methods: Descriptive epidemiological study was conducted with a secondary database of Datasus/Sisvan. The data from 19,289 children (9,451 girls and 9,838 boys), aged 5 to 10 years, who beneited from the program Bolsa Família in the state of Mato Grosso do Sul in 2010 were collected. The variables were body weight and height. Body mass index was analyzed with Z-scores of normative tables from the World Health Organization. Results: The prevalence of underweight was 4.8% among female and 5.6% among male participants. The prevalence of overweight and obesity was, respectively, 14.8 and 9.1% for female participants and 16.1 and 11.9% for male participants. The prevalence of underweight and obesity was lower in cities/towns with a lower Human Development Index, for female and male individuals. The prevalence of overweight in cities/towns with a lower Human Development Index was lower among female participants and higher among male participants. Conclusions: The higher prevalence of overweight among individuals of lower socioeconomic status indicates the need for understanding macro-factors that can inluence the children’s nutritional status.
Keywords: Nutritional status. Child. Poverty. Anthropometry. Risk factors. Prevalence.
Prevalence of underweight, overweight and
obesity in poor children from Mato Grosso do Sul
Prevalência de baixo peso, sobrepeso e obesidade em crianças pobres do
Mato Grosso do Sul
Diego Augusto Santos SilvaI, Heloyse Elaine Gimenes NunesI ARTIGO ORIGINAL / ORIGINAL ARTICLE
IGraduate Program in Physical Education, Study Group in Cineanthropometry and Human Performance, Universidade Federal de Santa Catarina – Florianópolis (SC), Brazil.
INTRODUCTION
Changes in the Brazilian historical and socioeconomic context led to changes in the population’s behavior, which, in turn, resulted in processes of demographic, epidemiological, and nutritional transition1. According to a survey from the Ministry of Health, in Brazilian capitals, from 2006 to 2009, the proportion of people with excess weight increased from 42.7 to 46.6%, and the percentage of obese people increased from 11.4 to 13.9% in the same period2.
The analysis of nutritional status among children aged from 5 to 9 years old can be observed by comparing the data from the National Study on Family Expenses – ENDEF (1974 – 1975), the National Survey on Health and Nutrition (PNSN) (1989), and the Household Budget Survey – POF (2008 – 2009). The data from ENDEF showed the prevalence of underweight to be 5.7% for male and 5.4% for female participants; PNSN presented 2.2% for the male and 1.5% for the female gender; and POF showed the same to be 4.3% for male and 3.9% for female individuals3-5.
Regarding overweight, data from ENDEF showed the prevalence to be 10.9% for male and 8.6% for female individuals; PNSN, 15% for male and 11.9% for female participants; and POF, 34.8% for male and 32% for female individuals3-5. For obesity, the data from ENDEF presented the prevalence of 2.9% for male and 1.8% for female gender; PNSN, of 4.1% for male and 2.4% for female individuals; and POF, 16.6% for
RESUMO:Objetivo: Estimar a prevalência de baixo peso, sobrepeso e obesidade em crianças de cinco a dez anos de idade que vivem na condição de pobreza e extrema pobreza, de acordo com o sexo e com as mesorregiões geográicas, no estado de Mato Grosso do Sul. Métodos: Estudo epidemiológico descritivo construído com base em banco de dados secundário, proveniente do Sisvan Bolsa Família/Datasus. A amostra consistiu de 19.289 crianças (9.451 do sexo feminino e 9.838 do masculino), de cinco a dez anos de idade, do estado de Mato Grosso do Sul, beneiciárias do Programa Bolsa Família no ano de 2010. Para classiicar o estado nutricional das crianças, utilizou-se escore Z do Índice de Massa Corporal, e, como referência, os pontos de corte do World Health Organization. Resultados: A prevalência de baixo peso foi presente em 4,8% do sexo feminino e 5,6% do sexo masculino. O sobrepeso e a obesidade tiveram prevalência, respectivamente, de 14,8 e 9,1% para o sexo feminino e de 16,1 e 11,9% para o sexo masculino. As prevalências de baixo peso e obesidade foram menores em municípios com menor desigualdade de distribuição de renda, para ambos os sexos. Quanto ao sobrepeso no sexo feminino, foi menor nos municípios de menor desigualdade, e no sexo masculino, a maior prevalência foi encontrada nos municípios de menor desigualdade em distribuição de renda. Conclusão: A alta prevalência de excesso de peso em indivíduos de baixo nível socioeconômico aponta para a necessidade da compreensão de fatores macroestruturais que podem inluenciar o estado nutricional de crianças.
male and 11.8% for female participants3-5. It is worth to mention that the Center-West region had the highest level of variation of boys with excess 8 in 10 years, from 13.8%, in 1989, to 37.9%, in 2008 – 20094,5.
The concern with overweight and obesity is owed to the fact that these are commonly associated with comorbidities such as type 2 diabetes mellitus, dyslipidemia, systemic arterial hypertension, cardiovascular diseases, osteoarthritis, and liver changes, and patients who are overweight or obese are more prone to developing psychosocial problems6. Being underweight also causes serious health conditions, such as the appearance of infectious diseases due to the low immunity originated from the lack of nutrients, increasing rates of children’s mortality, delayed growth and psychomotor development, diiculties in school performance, and reduced productive capacity in adulthood7.
Brazil is one of the most unfair countries in the world when it comes to the social division of the produced wealth. However, a recent report from the Brazilian Institute of Geography and Statistics has shown that unequal socioeconomic conditions between regions and income strata do not play the same role they did in the past concerning geographic and social distribution, because malnutrition was seen in the poorest strata whereas obesity was a characteristic of the richest8.
Overweight and obesity were found among children who live in conditions of poverty and extreme poverty, beneitting from the cash transfer program Bolsa Família (PBF) in the state of Sergipe, Brazil; higher prevalence was found in cities with lower Human Development Index (HDI)9. Other studies with people living in poverty and extreme poverty beneitting from PBF are rare in Brazil; therefore, it is not possible to infer if people living in poverty and extreme poverty are more underweight, overweight, or obese.
This study aimed at estimating the prevalence of underweight, overweight, and obesity among children aged from ive to ten years old, living in conditions of poverty and extreme poverty according to gender and geographic mesoregions of the state of Mato Grosso do Sul, Brazil.
METHODS
This descriptive epidemiological analysis was based on a secondary database from Sisvan Bolsa Família/Datasus, public domain, which can be accessed by the internet10. Because of no direct implications for human beings, there was no need to consult with ethics committees.
of programs related to the improvement of dietary patterns and nutritional status of the population assisted by SUS11.
Sisvan Bolsa Família records the nutritional status of the beneficiaries of the PBF. The software TabNet enables the access to information regarding the nutritional status of the beneiciaries of the PBF, whose data are recorded in the system and sent by the internet at the end of the validity of the program11,12.
Data about children aged from 5 to 10 years old in the state of Mato Grosso do Sul, PBF beneiciaries in 2010, were collected for this study. In that year, information was available of about 19,289 children aged from 5 to 10 years old, being 9,415 girls and 9,838 boys.
Mato Grosso do Sul is one of the 27 federating units of Brazil. It has high HDI, of 0.802, gross domestic product (GDP) of R$ 43,514,000, life expectancy of 74 years, illiteracy rate of 8.1%, and mean Gini coeicient of 0.43. Mato Grosso do Sul has 27 cities with high Municipal Human Development Index13. It is in the south of the Center-West region and borders the states of Goiás, Minas Gerais, Mato Grosso, Paraná, and São Paulo, besides Bolivia and Paraguay. Its area is of 357,124,962 km2. In 2012, its estimated population was of 2,505,088 inhabitants. It has 79 cities, distributed into 4 mesoregions:
1. Center-North (formed by 16 cities); 2. East (formed by 17 cities);
3. Southeast (formed by 38 cities); and 4) Pantanais Sul-Mato-Grossenses (formed by 7 cities).
The Center-North mesoregion of Mato Grosso do Sul gathers two microregions (Alto Taquari and Campo Grande), with HDI of 0.752, GDP of R$ 2,867,682.69, and mean Gini coeicient of 0.4313. The Eastern mesoregion of Mato Grosso do Sul groups four microregions (Cassilândia, Nova Andradina, Paranaíba, and Três Lagoas), with HDI of 0.756, GDP of R$ 411,161.84, and mean Gini coeicient of 9.4313. The Southeast mesoregion of Mato Grosso do Sul groups three microregions (Bodoquena, Dourados, and Iguatemi), with HDI of 0.730, GDP of R$ 286,645.76, and mean Gini coeicient of 0.4313. The mesoregion of Pantanais Sul-Mato-Grossenses gathers two microregions (Aquidauana and Baixo Pantanal), with HDI of 0.734, GDP of R$ 635,563.36, and mean Gini coeicient of 0.4613.
Body mass index (BMI) was used to classify the nutritional status of children who were beneficiaries of PBF, calculated by dividing body mass (kg) by the square height (m). References were the cutoff points from the World Health Organization14,15, which have been used by Sisvan since 2008. Anthropometric measurements were collected
and registered according to the standards from Sisvan16. Body mass is measured
the Z-scores was used because they were calculated by Sisvan. Six cutoff points were established for BMI, based on the Z-score (15):
a. accented thinness (Z-score -3);
b. thinness (> Z-score -3 and < Z-score -2); c. eutrophy (> Z-score -2 and < Z-score +1); d. overweight (> Z-score +1 and < Z-score +2); e. obesity (> Z-score +2 and < Z-score +3); and f. severe obesity (Z-score +3).
For this study, the categories described by letters (a) and (b) were grouped as “underweight”; (c) was grouped as eutrophy; (d) remained as the “overweight” category, and letters (e) and (f ) were grouped as “obesity.”
For statistical treatment, the TabWin software was used to download the data from the Datasus website and to analyze the information descriptively (absolute and relative frequencies). The software MedCalc was used to calculate the χ2 test to identify diferences between proportions. In all the analyses, a 5% signiicance level was adopted. To analyze the prevalence of underweight, eutrophy, overweight, and obesity according to the income distribution of the cities in Mato Grosso do Sul, the Gini coeicient of each one of the 79 cities was analyzed. The Gini coeicient is a commonly used measurement of inequality to calculate the unequal income distribution. It consists of a number between 0 and 1, in which 0 corresponds to complete income equality (everyone has the same income) and 1 corresponds to complete inequality (one person has higher income, and the rest have nothing)17. The Gini coeicient was divided into tertiles: the irst one corresponded to cities whose Gini coeicient was up to 0.43, known for its “low inequality” (n = 25 cities); the second tertile was formed by cities whose Gini coeicient was 0.43 to 0.44, called “medium inequality” (n = 34 cities); and the third tertile was formed by cities with Gini coeicient higher than 0.44, being called “high inequality” (n = 20 cities).
RESULTS
The prevalence of underweight, overweight, and obesity among the investigated children is given in Table 1. Regarding the female gender, the prevalence of underweight was 4.8% whereas that of overweight and obesity was, respectively, 14.8% and 9.1%. Besides, there was statistical diference (p < 0.05) in the analysis of underweight, overweight, and obesity according to the mesoregions of the state of Mato Grosso do Sul. The mesoregion of
Pantanais presented higher prevalence of underweight (5.5%), overweight (16.4%), and
obesity (11.2%), when compared to the other mesoregions (p < 0.01).
between the mesoregions of the state of Mato Grosso do Sul, the highest prevalence was found in the mesoregion of Pantanais (6.5%). The prevalence of overweight and
obesity also presented differences between the mesoregions (p < 0.01). The highest prevalence of overweight (18.2%) was found in the Southeastern mesoregion, and the highest prevalence of obesity (12.2%) was found in the Center-North mesoregion. Besides, by comparing the prevalence between genders, there was a difference between boys and girls only for obesity, which indicates that obesity was higher among boys than among girls (p < 0.05).
Table 2 shows the prevalence of underweight, overweight, and obesity according to the unequal income distribution in the cities of Mato Grosso do Sul (Gini
Table 1. Prevalence rates of underweight, overweight, and obesity among poor children from Mato Grosso do Sul, Brazil, according to mesoregion.
*p ≤ 0.05 – χ2 test – comparison between genders. Mesoregion
Underweight Normal weight Overweight Obesity
Female Male Female Male Female Male Female Male
n (%) n (%) n (%) n (%) n (%) n (%) n (%) n (%)
Center-North 146 (4.7) 178 (6.0) 1482 (73.1) 1510 (68.0) 332 (15.3) 356 (13.8) 190 (6.9) 317 (12.2)
East 62 (4.6) 78 (5.3) 1006 (72.4) 983 (68.0) 210 (12.8) 223 (15.3) 184 (10.2) 235 (11.4)
Southeast 214 (4.3) 221 (4.7) 3126 (73.1) 2838 (65.1) 668 (14.5) 832 (18.2) 395 (8.1) 568 (12.0)
Pantanais 75 (5.5) 93 (6.5) 964 (66.9) 966 (64.4) 245 (16.4) 261 (17.1) 152 (11.2) 179 (12.0)
p < 0.01 p < 0.01 p < 0.01 p < 0.01
Total 497 (4.8) 570 (5.6) 6578 (71.4) 6297 (66.4) 1455 (14.8) 1672 (16.1) 921 (9.1) 1299 (11.9)*
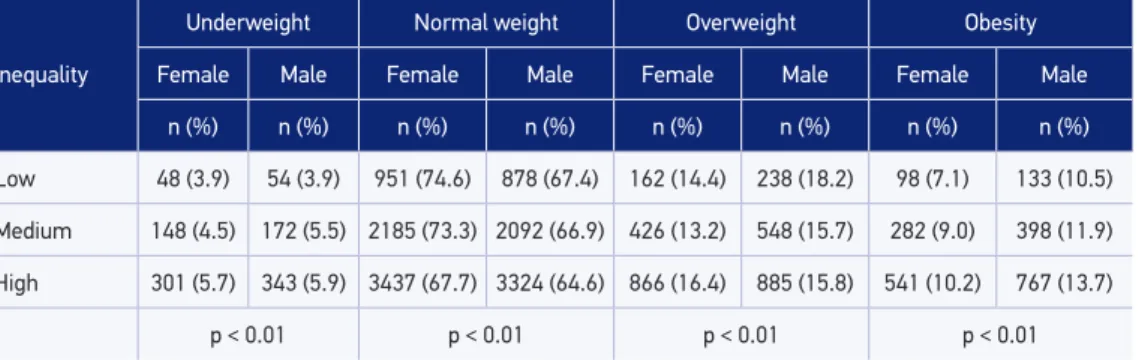
Table 2. Prevalence rates of underweight, normal weight, overweight, and obesity in poor children according to inequality in income distribution in municipalities from Mato Grosso do Sul, Brazil.
Inequality
Underweight Normal weight Overweight Obesity
Female Male Female Male Female Male Female Male
n (%) n (%) n (%) n (%) n (%) n (%) n (%) n (%)
Low 48 (3.9) 54 (3.9) 951 (74.6) 878 (67.4) 162 (14.4) 238 (18.2) 98 (7.1) 133 (10.5)
Medium 148 (4.5) 172 (5.5) 2185 (73.3) 2092 (66.9) 426 (13.2) 548 (15.7) 282 (9.0) 398 (11.9)
High 301 (5.7) 343 (5.9) 3437 (67.7) 3324 (64.6) 866 (16.4) 885 (15.8) 541 (10.2) 767 (13.7)
coefficient). Statistical differences were observed between nutritional status and the unequal income distribution for both genders (p < 0.05). Among girls, cities with low income inequality presented lower prevalence of underweight (3.9%), overweight (14.4%), and obesity (7.1%) in comparison to cities with medium and high inequality in income distribution (p < 0.01). For boys, the prevalence of underweight and obesity was lower in cities with fewer inequalities in income distribution when compared to cities with higher inequality (p < 0.01). Also, a difference was observed for overweight among boys, and the highest prevalence was found in cities with less unequal income distribution.
DISCUSSION
This study observed that underweight, overweight, and obesity had been present among children who are beneiciaries of the PBF in the state of Mato Grosso do Sul. Besides, for the female gender, the highest prevalence of underweight, overweight, and obesity was observed in the mesoregions with higher income distribution inequalities. However, for the male gender, the prevalence of overweight was higher in places with less uneven income distribution, whereas the prevalence of underweight and obesity was more common in the mesoregions with higher income distribution inequalities. Besides, the boys presented higher prevalence of obesity than the girls.
International studies carried out in middle- to low-income countries pointed out that the problem of malnutrition and underweight is clearer in places with lower socioeconomic index. A study conducted among 1,599 children and teenagers aged from 5 to 18 years old in 4 urban cities to the south of Nigeria found the prevalence of underweight to be 13.0%18. Another study veriied the prevalence of underweight to be 50.9% among children aged from 1 to 6 years old living in forest reserves in Malaysia19. In the study conducted by Nguyen et al.20 among students aged from 6 to 19 years old, in Ethiopia, the prevalence of underweight was found to be 20.8%.
The indings in this study showed the prevalence of overweight to be three times higher than that of underweight, whereas the prevalence of obesity was found to be the double of that of underweight. These data conirm the tendency of nutritional transition that has been happening since 1980, with reduced levels of malnutrition and underweight and increasing levels of overweight and obesity3-5. Although the reduction in malnutrition and underweight can be justiied by the improved life conditions, the higher coverage of health, and the reduced fecundity, the evolution of excess weight was mainly caused by urbanization and its impact on dietary patterns and physical activities23. A study conducted by Silveira et al.21 found the prevalence of overweight and obesity in 11.3% of the residents of slums in Maceió. A study by Silva9, including 32,351 children aged from 5 to 10 years old, PBF beneiciaries in the state of Sergipe, 2010, found the prevalence of overweight to be 13.1% among girls and 13.3% among boys, and the prevalence of obesity to be 11.2% among girls and 14.5% among boys; in this study, the prevalence of overweight was 14.8% among girls and 16.1% among boys. Concerning the prevalence of obesity, there was a diference between genders, being higher among boys (11.2%) than among girls (9.1%).
Other studies presented data on obesity, with higher prevalence among male than among female participants5,24. In the study by Pereira et al.24, conducted among 871 children (aged from 0 to 10 years old) from Santa Catarina, obesity was prevalent in 1% of the girls and 3.9% of the boys, but there was no diference (p = 0.182). Data presented in POF 2008 – 2009 indicated the prevalence of obesity in children aged from 5 to 9 years old being 11.8% for female and 16.6% for male participants5. However, a study conducted by Pelegrini et al.25 showed inconsistencies in literature regarding the prevalence of obesity between genders. Obesity has a multifactorial etiology; however, this study did not aim at investigating the factors that may be associated with obesity. Some studies indicated that its highest prevalence can be associated with low maternal schooling, children of obese parents, heavy weight at birth, early wean, and inadequate habits26. It is suggested that new studies with PBF beneiciaries should be conducted and analyze such factors.
The high prevalence of excess weight has been reported in individuals with low purchasing power, both in developing and in developed countries9,27. By analyzing the data presented in this study, it was observed that, among girls, overweight and obesity were more prevalent in regions with more unequal income distribution. However, among boys, the prevalence of overweight was higher in regions with less uneven income distribution.
Because the data in this study belong to secondary databases, the researcher cannot control possible typing and record errors, which is a limitation of this study.
CONCLUSION
With these results, lower prevalence of underweight was observed in relation to the prevalence of overweight and obesity, even in poorer populations, showing that the socioeconomic status has influenced the overweight and obesity status of children. The prevalence of obesity was higher among boys than among girls. Besides, the higher prevalence of underweight and obesity was found in regions with higher income inequalities for both genders; however, higher prevalence of overweight was found in regions with less uneven income among boys and in regions of higher inequality among girls.
1. Brasil. Ministério da Saúde. Saúde Brasil 2008: 20 anos de Sistema Único de Saúde (SUS) no Brasil. Brasília: Ministério da Saúde; 2009.
2. Brasil. Ministério da Saúde. Secretaria de Vigilância em Saúde. Vigilância de Fatores de Risco e Proteção para Doenças Crônicas por Inquérito Telefônico. Ministério da Saúde. Secretaria de Vigilância em Saúde (VIGITEL) 2009. Brasília: Ministério da Saúde; 2010.
3. Brasil. Instituto Brasileiro de Geograia e Estatística. Estudo nacional de despesa familiar. Dados preliminares: consumo alimentar - antropometria. Rio de Janeiro: IBGE; 1978.
4. Brasil. Instituto Nacional de Alimentação e Nutrição. Pesquisa Nacional sobre Saúde e Nutrição, PNSN, 1989. Brasília: INAN; 1990.
5. Brasil. Instituto Brasileiro de Geograia e Estatística. Pesquisa de Orçamentos Familiares - POF 2008-2009. Despesas, rendimentos e condições de vida. Rio de Janeiro: IBGE; 2010.
6. Ludwig DS. Childhood obesity - the shape of things to come. N Engl J Med 2007; 13(23): 2325-7.
7. Osterbauer B, Kapisi J, Bigira V, Mwangwa F, Kinara S, Kamya MR et al. Factors associated with malaria parasitaemia, malnutrition, and anaemia among HIV-exposed and unHIV-exposed Ugandan infants: a cross-sectional survey. Malar J 2012; 11: 432.
8. Brasil. Instituto Brasileiro de Geografia e Estatística. Pesquisa de Orçamentos Familiares - POF 2002-2003.
Análise da disponibilidade domiciliar de alimentos e do estado nutricional no Brasil. Rio de Janeiro: IBGE; 2004.
9. Silva DAS. Sobrepeso e obesidade em crianças de cinco a dez anos de idade beneiciárias do Programa Bolsa Família no estado de Sergipe, Brasil. Rev Paul Pediatr 2011; 29(4): 529-35.
10. Brasil [homepage on the Internet]. DATASUS. Disponível em: http://www2.datasus.gov.br/ DATASUS/index.php. (acessado em 03 de junho de 2013).
11. Brasil [homepage on the Internet]. SISVAN. Disponível em: http://200.214.130.94/nutricao/sisvan.php. (acessado em 03 de junho de 2013).
12. Brasil [homepage on the Internet]. SISVAN Bolsa Família. Estado nutricional dos beneficiários do Programa Bolsa Família. Disponível em: http://tabnet. datasus.gov.br/cgi-win/BOLSA/CNV/notas_bfa. html. (acessado em 03 de junho de 2013).
13. United Nations [homepage on the Internet]. Atlas of Human Development in Brazil, 2013. Disponível em: http://www.pnud.org.br/IDH/Atlas2013. aspx?indiceAccordion=1&li=li_Atlas2013. (acessado em 09 de setembro de 2013).
14. de Onis M, Onyango AW, Borghi E, Siyam A, Nishida C, Siekmann J. Development of a WHO growth reference for school-aged children and adolescents. Bull World Health Organ 2007; 85(9): 649-732.
15. World Health Organization. Multicentre Growth Reference Study Group. WHO Child Growth Standards. Length/height-for-age, age, weight-for-length, weight-for-height and body mass index-for-age: methods and development. Geneva: WHO; 2006.
16. Brasil. Ministério da Saúde. Secretaria de atenção à saúde. Departamento de atenção básica. Vigilância alimentar e nutricional - SISVAN. Orientações básicas para a coleta, o processamento, a análise de dados e a informação em serviços de saúde. Brasília: Ministério da Saúde; 2004.
17. Gini C. Variabilità e Mutabilità. Bologna; 1912.
18. Ene-Obong H, Ibeanu V, Onuoha N, Ejekwu A. Prevalence of overweight, obesity, and thinness among urban school-aged children and adolescents in southern Nigeria. Food Nutr Bull 2012; 33(4): 242-50.
19. Ey Chua EY, Zalilah MS, Ys Chin YS, Norhasmah S. Dietary diversity is associated with nutritional status of Orang Asli children in Krau Wildlife Reserve, Pahang. Malays J Nutr 2012; 18(1):1-13.
20. Nguyen NL, Gelaye B, Aboset N, Kumie A, Williams MA, Berhane Y. Intestinal parasitic infection and nutritional status among school children in Angolela, Ethiopia. J Prev Med Hyg 2012; 53(3): 157-64.
21. Silveira KBR, Alves JFR, Ferreira HS, Sawaya AL, Florêncio TMMT. Associação entre desnutrição em crianças moradoras de favelas, estado nutricional materno e fatores socioambientais. J Pediatr 2010; 86(3): 215-20.
22. Brasil. Secretaria de Atenção à Saúde. Departamento de Atenção Básica. Avaliação do Programa Bolsa-Alimentação: segunda fase. Brasília: Ministério da Sáude; 2005.
23. Monteiro CA, Freitas IC. Secular trends in socioeconomic determinants of child health in S. Paulo city, Brazil (1984-1996). Rev Saúde Pública 2000; 34(6): 8-12.
24. Pereira LL, Furlanetto C, Ferreira LM, Trespach SS, Silva MA, Ceretta LB. Prevalência de sobrepeso e obesidade infantil entre lactentes, pré-escolares e escolares em uma área de abrangência do PET-SAÚDE. Arq Catarin Med 2012; 41(4): 09-14.
25. Pelegrini A, Silva DAS, Petroski EL, Gaya ACA. Sobrepeso e obesidade em escolares brasileiros de sete a nove anos: dados do projeto Esporte Brasil. Rev Paul Pediatr 2010; 28(3): 290-5.
26. Danielzik S, Czerwinski-Mast M, Langnäse K, Dilba B, Müller MJ. Parental overweight, socioeconomic status and high birth weight are the major determinants of overweight and obesity in 5-7 y-old children: baseline data of the Kiel Obesity Prevention Study (KOPS). Int J Obes Relat Metab Disord 2004; 28(11): 1494-502.
27. Ogden CL, Lamb MM, Carroll MD, Flegal KM. Obesity and socioeconomic status in children and adolescents: United States, 2005-2008. NCHS Data Brief 2010; (51): 1-8.
28. Brasil. Instituto Brasileiro de Análises Sociais e Econômicas. Repercussões do Programa Bolsa Família na segurança alimentar e nutricional das famílias beneiciadas. Rio de Janeiro: IBASE; 2008.
29. Silva DAS, Pelegrini A, Petroski EL, Gaya ACA. Comparison between the growth of Brazilian children and adolescents and the reference growth charts: data from a Brazilian project. J Pediatr 2010; 86(2): 115-20.
Received on: 03/13/2014