WORKING PAPER SERIES
Universidade dos Açores Universidade da Madeira
CEEAplA WP No. 01/2005
An Azorean Dairy Farms Typology
Emiliana Silva, Julio Berbel
An Azorean Dairy Farms Typology
Emiliana Silva
University of Azores (DCA)
e CEEAplA
Julio Berbel
University of Cordoba
Working Paper n.º 01/2005
Janeiro de 2005
CEEAplA Working Paper n.º 01/2005 Janeiro de 2005
RESUMO/ABSTRACT
An Azorean Dairy Farms Typology
The objective of this paper was to define types of Azorean farms from a panel data of 174 farms of The European database of Farm Accountancy Data Network of the Azores, Portugal. This study used cluster analysis, the Ward method. The results, allowed the identification of three types of grazing systems of dairy farms as follows: 1) extensive grazing systems (less than smaller 1.4 cows per hectare); 2) moderate intensive grazing system (1.4 to 2.4 cows per hectare); and 3) intensive grazing system (more than 2.4 cows per hectare).
Key-words: Cluster, Ward, Typology, and Grazing Systems
Emiliana Silva
Departamento de Ciências Agrárias Universidade dos Açores
Campus de Angra
Terra-Chã
9701-851 Angra do Heroísmo
Julio Berbel
ETS. Ingenieros Agrónomos y Montes Universidad de Córdoba
Apdo 3048 -14080 Córdoba - España
An Azorean Dairy Farms Typology Emiliana Silva *, Julio Berbel †
* University of Azores - Portugal †University of Cordoba - Spain
ABSTRACT
The objective of this paper was to define types of Azorean farms from a panel data of 174 farms of The European database of Farm Accountancy Data Network of the Azores, Portugal. This study used cluster analysis, the Ward method. The results, allowed the identification of three types of grazing systems of dairy farms as follows: 1) extensive grazing systems (less than smaller 1.4 cows per hectare); 2) moderate intensive grazing system (1.4 to 2.4 cows per hectare); and 3) intensive grazing system (more than 2.4 cows per hectare).
Key-words: Cluster, Ward, Typology, and Grazing Systems INTRODUCTION
Dairy farming is the main agricultural sector in the Azores, Portugal. The dairy policy depends on PAC (Common Agricultural Policy) of the European Union. The main purpose of this paper was to define a farm’s typology using cluster analysis, for 174 farms from the database (1996) of the European Union, Farm Accountancy Data Network (FADN).
The cluster analysis is a multivariate procedure for detecting natural grouping in data with similar characteristics and helps to find structure in the data. These permits to analyse some of the elements as isolated entity and these elements serve to follow the analysis (Norusis, 1994). Cluster analysis or multivariate analysis use more than one variable to proceed with the analysis. The goal of cluster analysis is to identify homogeneous groups or clusters.
The two key sets within clusters are the measurements of distance between objects and to group objects based upon the resultant distances (linkages), and that permits to use different methods.
Hierarchical cluster analysis considers that some criteria (difference) are more important than another and starts with the idea that groups can be arranged in a hierarchical system (Jongman et al., 1987; Digby and Kempton, 1991).
There are several types of cluster analysis, based on different ideas about clusters concepts. The major distinction can be made between divisive and agglomerative methods. The agglomerative method of hierarchical cluster analysis is more widely used than divisive methods. Agglomerative methods start with individual objects, which are combined into groups by collection of objects or groups into larger groups. Here “local” similarity prevails over the larger differences. Most agglomerative methods require a similarity or a dissimilarity matrix.
2 It is not possible to choose a “best” method because of the heuristic nature of the data. If there is a markedly discontinuous structure, it will be detected by any method; a continuous structure will almost always be obscured by cluster analysis (Jongman et al., 1987). Also, there are small differences between the agglomerative methods, as was seen by Judez (1989).
The most common agglomerative cluster algorithms (Jongman et al., 1987; Digby and Kempton, 1991; Dias, 1991; Norusis, 1994; and Fernadez- Palacios and Santos, 1996) are: 1) single linkage (SL) or nearest neighbor clustering; 2) complete linkage (CL) or furthest neighbor clustering; 3) average linkage clustering (AL); 4) centroid clustering (CC); 5) Ward’s method (MW) or minimum variance clustering. The differences between these algorithms derive from the way the distances are calculated.
In the Single Linkage the first two cases combined are those that have the smallest distance or larger similarity, between them. At every step, the distance between clusters is the distance from them to the closest points. This method often gives skew or “chained” hierarchy. It is therefore not useful for summarizing data, but may indicate very anomalous or outlying objects (discontinuities in the data used).
In the Complete Linkage, the distance between two clusters is calculated as the distance between their two furthest points. This method tends to tight clusters, but between clusters differences are over estimated and therefore exaggerated in the dendogram. The group structure is imposed on the data by complete linkage.
In the Average Linkage clustering, the between-group (dis) similarity is defined as the average (dis) similarity between all possible pairs of members (one of each group). This method is a reasonable compromise between the single and complete linkage methods.
In the Centroid Clustering, between-cluster distance is computed as the distance between centroids of the clusters. This method replaces a cluster, on agglomeration, with the centroid value. As in the case of the last option, reversals or inversions in the hierarchy are possible.
The Ward’s method is a popular default linkage which produces compact groups of well distributed. The Ward grouping method, join at each stage, the two groups that lead to a lower loss of inertia inter groups. This inertia measures the dispersion of various groups with gravity centres around the centres of the total set of groups (Dentinho, 1994). That means, construct clusters which are of minimal variance internally (compacts) and maxim variance externally (isolated). It is useful for synoptic clustering and for all clustering work where another method can not be explicitly justified.
The Ward’s method, also Known as Orlóci`s (1967) error sum of square clustering, is in some respects similar to average-linkage clustering and centroid clustering. Between-cluster distance can either be computed as a square distance between all pairs of sites in a cluster weighed by cluster size (resembling average-linkage clustering) or as an increment in squared distances towards the cluster centroid when
two clusters are fused (resembling centroid clustering) (Jongman et al., 1987). Penalty by squared distance and cluster size makes the clusters tighter than those in centroid clustering and average linkage, and more like those obtained in complete linkage (Jongman et al., 1987 and Judez, 1989).
The algorithm of Ward’s method proceeds as follows: with all samples in a separate cluster, the sum of squared distances is zero, since each sample coincides with the centroid of its cluster. In each step, the pair of clusters is fused, which minimizes the total within-group sum of squares, which is equal to minimizing the increment (dE) in the total sum of squares (Jongman et al., 1987):
q p q p
E
E
E
dE
=
+−
−
Where E is the total error sum of squares, Ep+q, are the within-groups sums of squares
for the cluster in which p and q are fused together, Ep andEp the sums of squares for
individuals clusters p and q.
The within-group sum of squares for a cluster is (Jongman et al., 1987).
(
)
∑ ∑
− = p i k ki k p y y N E ε 2 1Where the first summation is over all members of cluster p and the second summation is over all members.
In Ward’s method, for each cluster, the means for all variables are calculated. Then, for each case, the squared Euclidean distance to the cluster means is calculated. These distances are summed for all of the cases. At each step, the two clusters that merge are those that result in the smallest increase in the overall sum of the squared within-cluster distances (Norusis, 1994).
The ideal number of groups to establish may be assessed graphically or numerically. Graphically the number of groups may be assessed with an icicle plot or dendogram. The dendogram bisected at a point which will divide the cases into a cluster based upon grouping up to the point where the bisection occurred. Numerically the number of cases may be assessed on the agglomeration schedule, by counting up from the bottom to where a significant break in slope (numbers) occurs. This is similar to a visual interpretation of a skree plot. The optimal numbers of groups may be assessed
a priori, based upon knowledge of the data set. Skree plots which converts a
dendogram to a profile curve will have an extreme inflection point were the number of groups significantly changes. The number of groups above the inflection point is an appropriate number of groups. Optimally of classes may be assessed by how “natural” the classes appear, and that reflects an appropriated class structure. Cluster analysis does not require a specific size or number of natural clusters need be pre-determinate.
4 The clusters analysis has been applied to several scientific areas, like biology, medicine, marketing, economics and agriculture in order to define a typology.
In this study, the ward method has been used because of its success in other studies. The selection of a method of cluster analysis is not simple because it depends on the heuristic nature of data, the data itself, and the external criteria (Jongman et al., 1987). In Judez (1989) it was observed, that the Ward and Complete linkage methods are more compact in the formation of groups than the single linkage and average methods.
Weigel and Rekaya (2000) obtained five clusters of dairy farms of some European countries and some places of Unites States of America (13 zones) to form the clusters. They used the centroid sorting method, and their results suggest that herds located in small, neighboring countries may be much more similar in management, climate and genetic background than herds located far apart within a single large country.
In Portugal, Silva and Bezerra (2000) defined four types of Azorean dairy farms using cluster analysis, Ward method and compared with Boston Consulting Group methodology. They used financial (solvability, financial dependency, and others); end economic (profit, increasing sales, etc.) information.
Dentinho (1999) defined a typology for Azorean animal farms, using ratios of the specialization and the intensity of grazing. He found sixteen types of farms: from beef extensive (less than 1.4 animals per hectare and specialization 1), to milk specialized and intensive grazing (more than 2.8 animals per hectare and a specialization ratio de 0.22), with a lot of intermediate systems.
Judez and Chaya (1999) used the data of FADN to analyze the variance of the estimator comparing two samples: one stratified to type of farming and economic size, and the other with the addition of a geographical stratification. They recommended a careful use of data of FADN.
In Terceira, Azores, Enes (1999) defined a farm typology, using cluster analysis, Ward method. Using technical and economics variable of FADN, three types of Azorean farms (dairy, beef or mix) were defined: the biggest (more than 75 animals), medium (between 30 and 75) and the smallest (less then 30 animals).
A cluster analysis was carried out by Solano et al. (1999) in order to identify groups of a Bolivian dairy farm with similar characteristics within the sample population. The variables technologies used were nutritional, reproductive, health management and form records. The analysis demonstrated clear relationship between management intensity, the farms` dimension and the farmers’ social conditions and access to information. The centroid distance as method of aggregation was used to classify the farms in the terms of structure and productive orientation. The three groups could be labeled as: large specialized commercial dairy farms; small mixed crops/dual purpose farms; and medium semi-commercial crop dairy farms. On the other hand, farms can be grouped into three categories according to sociological and information
seeking aspects labelled as: highly informed and advised farms; medium informed and advised farmers; and non informed nor advised farmers.
In New Zealand, Martin and McLeay (1998) used multivariate analysis (centroid method) to define farmers in risk pratics. They found five groups of farmers.
In Spain, Rodriguez et al. (1998) used the cluster analysis based upon social and economics variables. They obtained four groups according to the partial or complete farms and information levels. Using the structure variables they obtained four groups of dimension (big, median and small farms), with and without water plants.
Dentinho and Silva (1996) used the Ward method to identify the internal or external information structure of Azorean dairy farms and farm’s decision. They identified twelve groups of variables (bank accountancy; factory choice; consultancy; labor management; equipment; beef and milk choice; land management; feeding; fertilizing; insemination, forage area and veterinary). This permitted to define five information systems of Azorean farms: big farms; dairy farms; small farms; mixed farms and beef farms.
In Cordoba, Spain, Delgado and Caldenty (1993) used the cluster analysis, centroid method, to define the wine consumers. The results showed five types of wine consumers and five types of no wine consumers. They used in their study qualitative (sociologic) and quantitative variables (economics), and they concluded that cluster analysis was valid for market segmentation.
In Azores, Avillez (1991) proposed three agrarian systems: traditional systems (smaller farms and no specialization); animal farms (dairy, beef and mix), and vegetable farms, based upon a questionnaire answered by to the Azorean farmers. The main agrarian systems were divided into two or three types, according to de number of animals per farm.
MATERIAL AND METHODOLOGY
The Azorean data of FADN -1996, permits to observe that, in general, dairy farms are small and most of then belongs to the farmers. The mean agricultural area is around 23.7 hectares (more than 85% being pasture) and the average number of dairy cows is about 23 per farms. System of production is primarily based on grazing, and the main product is milk (84%). Most expenses are on concentrates (27%), annual depreciation (13,6%), rents (10,6%) and fertilizers (9,8%) (Silva, 2001).
The methodology was based upon Rodriguez et al. (1998). At first, a matrix of 174 Azorean (Terceira and S. Miguel islands) animal farms and sixteen techniques and economics variables was selected. These farmers were selected according to the European Classification (OTE 4). Then, the matrix of data was standardized, and the Euclidean distance, as a proximity or similarity measure was choose. Next, a similar matrix, was obtained and the Ward method was selected. A dendogram or an analysis tree observed the results. Finally, the clusters were limited and the groups of farms defined.
6 The software selected for cluster analysis was the SPSS, version 8 (Norusis, 1994), the method Ward, Z score for normalization (it is, format accounts for differences between mean values and reduce the standard deviations when variables have multivariate normality).
The cluster analysis was used into phases: the variables cluster and the cases cluster. Selecting variables to include in an analysis is always crucial (Norusis, 1994). If important variable are excluded, poor or misleading findings may results. The variables used in clusters were selected by the database of FADN for the period of 1996. It was observed that the variables have more impact in sales and cost structure. In product structure in the Terceira and S.Miguel islands, the animal production was around a 68.5% of total product. The agrarian product was around 0.2%, about the 15.32% were subsidies, and the rest was diverse product. In the animal production sector, around 88.3% were milk and 11.7 % was beef. In the cost structure, feeding was the most important, around 32.3%. The depreciation was the second more important, around 11.7%, and the fertilizer was the third more important, with 9.9% of total costs. The rent was around 9.1%. All other expenditures were below 6% of total costs. As a consequence of this analysis, it was selected sixteen variables to form the cases clusters.
Three tests permitted the selection of four groups of variables are used in cases cluster:
1) Technological variable: milk sales per cow; beef sales per animal; subsidies per animal; fertilizer per hectare; other cash expenses (medicine, artificial insemination and hygiene products); fuel and lubricants per hectare, hired labour per hectare; machinery and building repairs per hectare; depreciation per hectare; land rent per hectare; net income per hectare.
2) Dimension variable: agrarian area; total of animals. 3) Specialisation variable defined by Avillez (1989):
dairy cows dairy cows dairy) (beef Total cows tion Specialisa = + −
When specialization is higher than 0.66 it is a beef farm, when lower than 0.33 it is a dairy farm, and between 0.33 and 0.66 it is a mixed farm.
4) Intensity variable:
hectare Cows Total Intensity =
The cases cluster allows the definition of a typology of Azorean dairy farms, which means a group of farms with similar characteristics.
Following the definition and the selection the variables by cluster in four groups, the next step was to form the cases (farms) cluster.
After finding the initial clusters, some limits of intensification, specialisation and dimension (area and cows) were forced, because of the diversity of farms in each cluster.
RESULTS The variable cluster formed four clusters of variables:
Cluster I - Cluster of dimension (agricultural area; total number of animals).
Cluster II – Cluster of outputs and fixed and variable assets (subsidies per cows; net income per hectare; beef sales per cow; fertilizer costs per hectare, feeding costs per cow, and rent per hectare).
Cluster III – Cluster of specialization, outputs and fix assets (specialization, milk sales and hired labor per hectare).
Cluster IV – Cluster of intensity and fixed and variables assets (intensity, depreciation, fuel and lubricants per hectare, machinery and buildings repairs per hectare and other cash expenses).
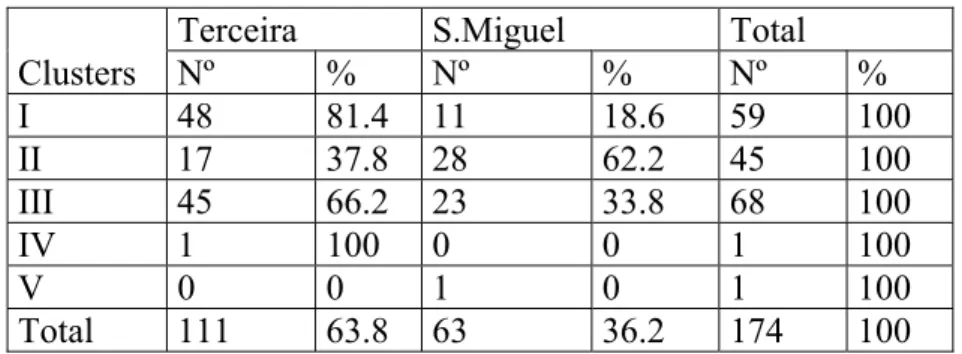
These clusters of variables permitted the identification of five clusters of Azorean farms: 1) 59 farms, 2) 45 farms; 3) 68 farms, 4) 1 farm, and 5) 1 farm. Mainly in Terceira island farms, 81.4% and 66.2% formed the Cluster I and III. The Cluster II was composed mainly (62.2%) by S. Miguel island farms.
In order to characterize the clusters the main variable was selected, which can explain the main differences among the groups formed.
Table 1. Composition of farms groups.
Terceira S.Miguel Total
Clusters Nº % Nº % Nº % I 48 81.4 11 18.6 59 100 II 17 37.8 28 62.2 45 100 III 45 66.2 23 33.8 68 100 IV 1 100 0 0 1 100 V 0 0 1 0 1 100 Total 111 63.8 63 36.2 174 100
The objective of this study was to define a typology of Azorean farm, in the sense that they have similar characteristics. Then, it was decided to consider the farm that belongs to the Cluster IV and V as outliers, although Lloyd (1993) refers the danger of eliminating the outliers, as information losses. In this case, simplification the reality does not seem to be very important to eliminate the outliers.
8 Table 2. Cluster characteristics of Azorean farms.
Cluster I Cluster II Cluster III Agricultural area (ha) 20.5 23.5 15.5
Total Cows 37.4 39 36.4
Total Cows/ Agriculture area (ha) 1.9 1.7 2.4 Net income/area(euros) 508.77 397.00 830.00 Gross margin/Milk cows(euros) 822.51 755.42 1004.58
liters milk/ cow 4202.9 5078.2 5989.9 Feed /Milk cows (euros) 185.55 340.68 236.93 Fertilizer/ha (euros) 110.73 151.14 181.06 Hired labor /ha (euros) 26.44 90.28 43.89
The agricultural area was smaller (15.5 hectares) in cluster III and higher (23.5 hectares) in cluster II. Cluster I had an intermediate agricultural area (20.5 hectares). The mean number of cows was higher (39) in cluster II, but not with very differences from another clusters (around 37 cows). As a consequence of this, the intensity of grazing was higher in cluster III (2.4 cows per hectare) and smaller in cluster II (1.7 cows per hectare), which was very similar to the cluster I (1.4 cows per hectare). As a result of an intensive grazing system the cluster III provided higher net profit per cow (833 euros), and cluster II, provided smaller net profit per cow (397 euros). This result was similar for the gross margin per hectare. The net profit and gross margin for cluster III was influenced by the higher milk production per cow, which was about of 6000 liters. The cluster II presented a higher expenditure on the animal feeding with concentrates around 340.6 euros, when compared to the other two clusters (more intensive grazing systems).
The expenditures in wages was more elevated (90.28 euros) in cluster II, composed mainly by S.Miguel farmers. In this island, around 20% of farms had agricultural workers. In Terceira, about 90% of farms are familiar farms.
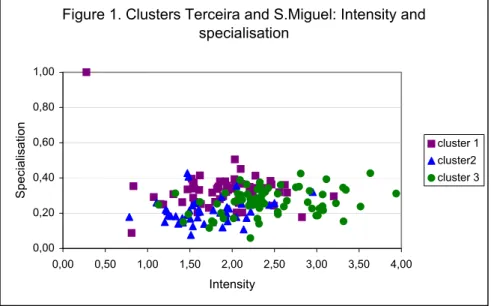
As a result of a forcing cluster, it was decided that the specialization and grazing intensity define the groups of farms (Figure 1). As it is observed in this figure, dairy farms (specialization smaller than 0.33) are mainly of the cluster II and III. The cluster I, only had a farm for beef production (specialization higher than 0.66). The most part of farms are mixed, but the most part are directed to milk production. The cluster III is more intensive, and the most part of farms are intermediate (around 2 cows per hectare). Because all farms are very mixed, it was decided to force the clusters according the intensity of grazing.
Finally, and after forcing, three main types of Azorean dairy farms were defined (Figure 2):
Group I – 1.4 to 2.4 cows per hectare – intermediate grazing systems Group II - less than 1.4 cows per hectare – extensive grazing systems Group III – more than 2.4 cows per hectare extensive grazing systems Figure 2. Typology of Azorean Dairy Farm
CONCLUSIONES
The Azorean animal production have mainly three types of farms; extensive grazing systems (dairy, beef or mixed), intensive grazing systems (dairy and mixed) and intermediate grazing systems (dairy and mixed). This allows the development of
Figure 1. Clusters Terceira and S.Miguel: Intensity and specialisation 0,00 0,20 0,40 0,60 0,80 1,00 0,00 0,50 1,00 1,50 2,00 2,50 3,00 3,50 4,00 Intensity Specialisation cluster 1 cluster2 cluster 3 SEMI IN(EX)TENSIVE 1.4 a 2.4 CN/ha INTENSIVE > 2.4CN/ha DAIRY MIXED BEEF EXTENSIVE <1.4CN/ha + + +++ ++ ++ +++ +
10 agrarian policies for a specific groups of farmers with different needs, and the development of useful decision models that, as is an example the simulation of the effect an increasing price of feeding (concentrates) and fertilizer on the net profit of different types of farms (intensive, extensive and moderate).
REFERENCES
Avillez, F., Estudo de base microeconómica sobre as perspectivas de
desenvolvimento da agricultura dos Açores, ISA, 1991.
Delgado, M.L. y P. Caldentey, Segmentación del Mercado de Consumidores del Vino de Córdoba, Invest. Agr. Econ .Vol.8(2),1993:209-221.
Dentinho, T. Ponce and E. Silva, Information Systems of the Azores Dairy Farms,
VIII Congress of the EAAE, European Association Agricultural Economists, Edinburgh, Scotland, September, 1996.
Dentinho, T. P., Information and Communication Technologies and Regional Development. The Case of the Azores Dairy Value Chain, A dissertation
submitted for the degree of Philosophy, University of Newcastle-upon-Tyne, 1994.
Dentinho, T.(1999), Análise de Conjuntura das explorações Agro-pecuárias dos Açores, Relatório do Projecto de Monitorização e avaliação das medidas de
Apoio à agricultura. Direcção Regional do Desenvolvimento agrário, Universidade dos Açores.
Digby, P.G. and R.A. Kempton, Multivariate Analysis of Ecological Communities.
Population and community biology series. Chapman & Hall, 3 ed., 1991.
Dias, E. M.F., Métodos de Estudo e Análise de Vegetação - Comunidades Herbáceas, Relatório da aula teórica ou prática prevista, no nº1 do artigo 58º, do
Dec-Lei 448/79 de 13 de Novembro (ECDU), Departamento de Ciências Agrárias, Universidade dos Açores, Angra do Heroísmo, 1989.
Enes, Isabel T., Determinação da Tipologia das Explorações Agrícolas da Ilha Terceira, Relatório de estágio em Engenharia Zootécnica, Departamento de
Ciências Agrárias, Universidade dos Açores, Angra do Heroísmo, 1999.
Fernández-Palacios, José M. and A. de los Santos, Ecología de las Islas Canarias. Muestreo y Análisis de Poblaciones y Comunidades, Sociedad la Cosmológica,
Santa Cruz de las Palmas, Islas Canarias, 1996.
Jongman, R.H.G.; C.J.F. ter Braak and O.F.R. Tongeren, Data Analysis in Community and Landscape Ecology, Pudoc, Wageningen, 1987.
Judez Asensio, L., Técnicas de Análisis de Datos Multidimensionales, Ministerio de
Judez, L. and C. Chaya, “Effects of Geographical Stratification in a Farm Accountancy Data Network on the Accuracy of the Estimates”, Journal of Agricultural Economics, 50, 3, 1999:388-399.
Lloyd, T.A., “Outliers in agriculture: An Intervention Analysis of Agricultural Land Values”, Journal of Agricultural Economics, 1993: 443-455.
Martin, S. and F. McLeay, “the Diversity of Farmers Risk Management Strategies in a Deregulated New Zealand Environment“, Journal of Agricultural Economics,
vol.49,nº2, 1998:218-233.
Norusis, M. J., SPSS Professional Statistics 6,1, SPSS, United States of America,
1994.
Rodríguez Ocaña, A., J. Berbel, Ruiz Avilés, Metodología para el Análisis de la Toma de Decisiones de los Agricultores, Monografia INIA, nº101, Ministério de
Agricultura Pescas y Alimentación, Madrid, 1998.
Silva, E.S., Análisis Multicriterio de la Eficiencia Económica de las Explotaciones Agroganaderas de las Azores (Portugal), Tesis Doctoral, Escuela Técnica
Superior de Inginieros de Agrónomos y de Montes, Universidad de Córdoba, 2001.
Silva, E. and A. M. Bezerra, Análise Financeira de Exploracões Agro-pecuárias dos Açores, Congresso de Economistas Agrícolas, Lisboa, 2000.
Solano, C., A. Bernués, F. Rojas, N. Joaquín, W. Fernandez and M. Herrero, “Relationship between Management intensity and Structural and Social Variables:in dairy and dual purpose systems in Santa Cruz, Bolivia”,
Agricultural Systems, 65 (2000), 159-177.
Weigel, K.A. and R. Rekaya (2000). A multiple trait Herd Cluster Model for International Dairy Sire Evaluation; J.Dairy Sci, 83, 2000:815-821