1 Portuguese Economic Growth 1833-1985
Ana Bela Nunes
Institute of Economics - Technical University of Lisbon Eugénia Mata
Faculty of Economics - New University of Lisbon Nuno Valério
Institute of Economics - Technical University of Lisbon
Introduction
The time has come for a thorough revision of the existing knowledge about Portuguese economic growth in the XlXth and XXth centuries. Several texts published in the 1980's have provided a lot of data and much seminal discussion. However, retrospective national accounts estimates and conflicting theses have flourished in a rather chaotic way, and an attempt at synthesis may be welcome for future debate.
This paper tries to provide such a synthesis. Its first part presents new estimates of gross domestic product, which extend the quantitative basis and the time-span of previous estimates. Its second part discusses the conclusions that can be drawn from the estimates presented in the first part, and the perspectives they open for research on Portuguese economic history of the XlXth and XXth centuries.
1. A quantitative appraisal of Portuguese economic growth A - Estimates
Time series of gross domestic product at market current prices, of its deflator, of gross domestic product at 1914 market prices, of population, and of per capita gross domestic product at market 1914 prices, are presented in the following table. The methodology and sources of the estimates are presented in the appendix.
2 Table 1
PORTUGUESE ECONOMIC GROWTH: ESTIMATES Year Gross Domestic
product market current prices
Price index
1914 Gross Domestic product market 1914 prices
Population Per capita Gross Domestic
product 1914 prices
103 contos basis=100 103 contos 103
inhabitants escudos 1833 220 53 415 3,584 116 1834 232 62 374 3,606 104 1835 232 75 309 3,627 85 1836 222 69 322 3,649 88 1837 217 56 388 3,671 106 1838 203 56 362 3,693 98 1839 201 58 347 3,715 93 1840 206 64 322 3,737 86 1841 215 67 321 3,748 86 1842 228 60 380 3,759 101 1843 234 57 411 3,771 109 1844 229 49 467 3,782 124 1845 226 49 461 3,793 122 1846 226 60 377 3,804 99 1847 227 58 391 3,816 103 1848 227 52 437 3,827 114 1849 225 55 409 3,838 107 1850 224 61 367 3,85 95 1851 225 57 395 3,861 102 1852 237 56 423 3,873 109 1853 234 68 344 3,884 89 1854 234 80 292 3,892 75 1855 248 78 318 3,901 82 1856 261 94 278 3,909 71 1857 278 81 343 3,923 87 1858 289 75 385 3,96 97 1859 283 82 345 3,998 86 1860 282 79 357 4,035 88 1861 301 83 363 4,11 88 1862 325 84 387 4,149 93 1863 333 81 411 4,188 98 1864 348 83 419 4,213 100 1865 353 81 436 4,238 103 1866 344 83 414 4,264 97 1867 360 88 409 4,289 95 1868 366 83 441 4,314 102 1869 380 82 463 4,34 107 1870 392 78 503 4,366 115 1871 385 76 507 4,392 115
3 1872 407 76 536 4,418 121 1873 433 79 548 4,444 123 1874 462 82 563 4,471 126 1875 492 82 600 4,497 133 1876 501 83 604 4,524 133 1877 509 93 547 4,551 120 1878 505 92 549 4,591 120 1879 492 88 559 4,632 121 1880 502 83 605 4,673 129 1881 524 85 616 4,715 131 1882 535 86 622 4,757 131 1883 532 82 649 4,799 135 1884 557 77 723 4,842 149 1885 578 75 771 4,885 158 1886 608 76 800 4,929 162 1887 623 75 831 4,973 167 1888 662 75 883 5,017 176 1889 681 80 851 5,062 168 1890 679 88 772 5,105 151 1891 681 86 792 5,138 154 1892 699 88 794 5,182 153 1893 703 89 790 5,22 151 1894 717 91 788 5,251 150 1895 763 87 877 5,275 166 1896 787 88 894 5,297 169 1897 782 93 841 5,331 158 1898 792 97 816 5,365 152 1899 806 95 848 5,407 157 1900 829 93 891 5,45 164 1901 811 92 882 5,497 160 1902 816 89 917 5,552 165 1903 843 92 916 5,613 163 1904 859 97 886 5,67 156 1905 864 96 900 5,72 157 1906 874 96 910 5,758 158 1907 903 96 941 5,8 162 1908 928 97 957 5,84 164 1909 941 98 960 5,883 163 1910 947 94 1,007 5,937 170 1911 906 99 915 6,004 152 1912 936 98 955 6,008 159 1913 950 101 941 6,004 157 1914 862 100 862 6,053 142 1915 976 110 887 6,107 145 1916 1,173 129 909 6,147 148 1917 1,248 148 843 6,186 136
4 1918 1,488 240 620 6,104 102 1919 1,846 268 689 6,082 113 1920 2,629 420 626 6,084 103 1921 3,366 606 555 6,148 90 1922 5,405 707 764 6,216 123 1923 8,049 1,022 788 6,271 126 1924 10,263 1,338 767 6,344 121 1925 11,368 1,295 878 6,429 137 1926 12,075 1,25 966 6,507 148 1927 12,68 1,325 957 6,58 145 1928 14,802 1,278 1,158 6,658 174 1929 16,632 1,32 1,26 6,729 187 1930 16,304 1,266 1,288 6,812 189 1931 15,795 1,148 1,376 6,908 199 1932 16,117 1,129 1,428 7,003 204 1933 16,45 1,128 1,458 7,096 206 1934 17,093 1,138 1,502 7,189 209 1935 17,306 1,14 1,518 7,279 209 1936 17,532 1,163 1,507 7,379 204 1937 18,289 1,201 1,523 7,476 204 1938 19,123 1,17 1,634 7,575 216 1939 19,427 1,114 1,744 7,677 227 1940 20,22 1,157 1,748 7,758 225 1941 23,986 1,273 1,884 7,8 242 1942 27,785 1,499 1,854 7,859 236 1943 30,025 1,657 1,812 7,934 228 1944 29,064 1,696 1,714 8,013 214 1945 30,23 1,819 1,662 8,101 205 1946. 34,545 2,022 1,708 8,182 209 1947 38,214 2,073 1,843 8,258 223 1948 38,305 2,048 1,87 8,358 224 1949 40,667 2,147 1,894 8,434 225 1950 42,255 2,097 2,015 8,512 237 1951 45,798 2,196 2,086 8,547 244 1952 46,878 2,245 2,088 8,563 244 1953 49,062 2,196 2,234 8,587 260 1954 50,65 2,147 2,359 8,607 274 1955 53,597 2,196 2,441 8,657 282 1956 57,769 2,27 2,545 8,698 293 1957 60,75 2,27 2,676 8,737 306 1958 64,466 2,295 2,809 8,789 320 1959 68,76 2,319 2,965 8,837 336 1960 74,86 2,369 3,16 8,891 355 1961 80,607 2,418 3,334 8,944 373 1962 85,655 2,418 3,542 9,002 394 1963 92,903 2,467 3,766 9,04 417
5 1964 100,505 2,517 3,993 9,053 441 1965 112,073 2,615 4,286 8,996 476 1966 122,678 2,739 4,479 8,871 505 1967 137,118 2,838 4,832 8,798 549 1968 149,057 2,862 5,208 8,743 596 1969 163,382 3,035 5,383 8,696 619 1970 185,668 3,134 5,924 8,648 685 1971 207,799 3,282 6,331 8,642 733 1972 241,704 3,528 6,851 8,622 795 1'973 294,062 3,849 7,64 8,545 894 1974 353,226 4,565 7,738 8,891 870 1975 392,478 5,305 7,398 9,457 782 1976 483,975 6,144 7,877 9,685 813 1977 653,963 7,698 8,495 9,737 872 1978 822,625 9,376 8,774 9,772 898 1979 1,033,954 11,079 9,333 9,8 952 1980 1,306,548 13,522 9,662 9,828 983 1981 1,561,466 15,964 9,781 9,892 989 1982 1,905,410 19,271 9,887 9,969 992 1983 2,391,500 24,033 9,951 10,05 990 1984 2,925,991 29,955 9,768 10,129 964 1985 3,661,467 36,37 10,067 10,185 988
B - General remarks on the estimates
It must be stressed that the estimates presented have not the same quality for the whole period under consideration. Rough estimates of the margins of error of the estimates can be found in the appendix. In a general appraisal, we may say that the estimates for the years until the 1850's are not much better than educated guesses, that the estimates for the years 1851-1946 are acceptable, and that the data from 1947 on are as good as official estimates usually are.
On the whole, these new estimates led to quite different results from the previous ones, such as those of Valério, 1983, Valério, 1986, Mata, 1987,Justino, 1987, and Nunes, 1989. They also invalidated some ideas based on the previous estimates. These new perspectives will be discussed in the second part of this paper. Of course, we now think we have got more accurate figures. This conviction is based on the analysis of long-term trends, short-term fluctuations, and international comparisons made in the second part of this paper.
6
2. Debates and controversies on Portuguese economic growth A - Portuguese economic growth: long-term trends
An attempt to break down the evolution of the Portuguese economy between 1833 and 1985 into significant periods on the basis of the estimates presented in the first part leads to the following results:
a) Near stagnation until the 1850's (1833-1859).
b) Moderate and irregular growth in the 1860's, 1870's and 1880's (1860-1888).
c) Near stagnation between the 1890's and the first world war (1889-1913). d) Serious setbacks during the two world wars and the post-first world war years (1914-1921 and 1942-1945).
e) Moderate and irregular growth in the inter-war period (1922-1941).
f) Important and continuous growth between the second world war and the 1970's (1946-1973).
g) Moderate and irregular growth since the mid-1970's (1974-1985).
A look at some detailed figures for these periods will show the rationale of such a periodization:
7 Table 2
PORTUGUESE ECONOMIC GROWTH: MAIN PERIODS
Trends in rates of growth per year (percentage) Period
domestic product Real gross Population domestic product Per capita gross 1833-1859 -0.2 +0.4 -0.6 1860-1888 +2.8 +0.7 +2.1 1889-1913 +0.9 +0.8 +0.1 1914-1921 -7.1 +0.1 -7.2 1922-1941 +4.7 + 1.2 +3.5 1942-1945 -3.8 + 1.0 -4.8 1946-1973 +5.4 +0.2 +5.2 1974-1985 +2.9 +0.9 +2.0 1833-1985 +2.1 +0.7 + 1.4
Number of years of per capita gross domestic product
Decrease(a) Stagnation(b) Growht(c) Total
1833-1859 13 1 12 26 1860-1888 3 5 21 29 1889-1913 10 5 10 25 1914-1921 5 0 3 8 1922-1941 3 4 13 20 1942-1945 4 0 0 4 1946-1973 0 3 25 28 1974-1985 3 3 6 12 1833-1985 41 1 90 152
(a)Rate of growth per year in the interval ]-∞, -1%]. (a)Rate of growth per year in the interval ]-1%, +1%]. (a)Rate of growth per year in the interval ]+1%, +∞].
Before any attempt to make general comments about the evolution of the Portuguese economy during the whole period under consideration, let us examine in detail each of the shorter periods we have just identified.
B - Portuguese economic growth: the main periods B.1 - The near stagnation period 1833-1859
Two aspects of this period deserve special attention: the low starting point, and the stagnant trend itself.
Our estimates for the 1830's are very different from those presented in Bairoch, 1976. In the case of real gross domestic product our figure for 1835 is 605 million dollars as against 860 million dollars for 1830 in Bairoch's estimate, and in the case of per capita gross domestic product our figure for 1835 is 165 dollars as against 250 dollars for 1830 in Bairoch's estimate (for conversion of figures
8 expressed in 1914 escudos into figures expressed in 1960 dollars see the appendix; note also that our population figure is much higher than the population figure implicit in Bairoch's estimates of 3,440,000 people). This is an important downward revision of the Portuguese starting point in the 1830's, but we believe it is quite reasonable. As a matter of fact, during the previous decades Portuguese society had faced many dramatic situations: three wars against revolutionary and imperial France and its allies (1795-1797, 1801, 1807-1814); French and British occupations (partial or total French occupation of the continental part of the country between 1807 and 1811; British informal occupation first of the Atlantic islands, then of the continental part of the country between 1807 and 1820); the loss of Brazil (the economic colonial pact was abrogated in 1808, a United Kingdom of Portugal and Brazil was established in 1816, and full independence was proclaimed in 1822 and recognized by Portugal in 1825); and internal conflicts that culminated in a civil war between absolutist and constitutionalist parties (1828 in the continental part of the country, 1828-1832 in the Azores, 1832-1834 in the continental part of the country again). Whatever prosperity there was in the last quarter of the XVIIIth century was plausibly lost in these upheavals.
The stagnation during the period 1835-1860 is a much more surprising fact. It is true that political and social unrest persisted between the mid-1830's and the early 1850's, and the protectionist tariff adopted in 1837 (lowered in 1852, mainly for agricultural commodities) was of doubtful help. However, problems were less serious than between the mid-1790's and the mid-1830's, and it may be argued that the new institutional framework provided by the constitutional regime was favourable to economic growth. Of course, our estimates may give a wrong picture of what happened during these decades, but we may also suggest that institutional reforms were not complete (as we shall see later), and that something more than good institutions was necessary to foster Portuguese economic growth.
The large margins of error of the estimates for this period make a short-term analysis meaningless. Let us, however, note that the severe crisis of the mid-1850's is quite plausible even if exagerated in the estimates. As a matter of fact, this was a period of epidemics of yellow fever and cholera, and of a oïdium plague in Portuguese vineyards. As the demographic effects of the epidemics are not taken into account in population estimates, there is a downward distortion of the per capita income figures, but these were certainly very hard times.
9 B.2 - The growth period 1860-1890
The late 1850's and the early 1860's were a true turning point in Portuguese life. First of all, some important institutional reforms were accomplished. These were: the adoption of the gold-standard (1854), and of the metric system (1857), and the abolition of entails (1863). Secondly, the whole state machinery seems to have significantly improved its efficiency (at least it started to produce regular statistical data). Thirdly, a network of commercial banking institutions began to spread over the country. Last but not least, communication facilities between Portugal and foreign countries and between the various regions of the country were built. For instance, the first Portuguese railways (the Portuguese section of the Lisbon-Madrid line, the Lisbon-Gaia line, and a Lisbon-Alentejo line) were constructed between 1856 and 1864 (note that the Gaia-Oporto railway bridge over the Douro only came in 1877).
This corresponds to the full implementation of what was called in Valerio, 1986 the liberal (or regeneration) blueprint for the role of the government in Portuguese economic growth. Our estimates show that the economic response was quite posi-tive. The index of industrial production presented in Reis, 1987 already suggested an annual rate of growth in the range 2.5-3.0% for that sector in the 1870' and 1880's. We may now conclude that agricultural growth must have been at least similar to ensure the overall performance in the same range given by our estimates. This contradicts what is said in Valerio, 1986 and Mata, 1989 about the delayed success of the institutional and investment effort of the state (but not what is said in Mata, 1989 about the inability of the state to increase public receipts as much as was needed to avoid chronic public deficits).
Two short depressions, in the mid-1860's and in the mid-1870's interrupted this period of growth. The depression of the mid-1860's is generally explained by the decrease in emigrants remittances from Brazil associated with the Paraguay war. The depression of the mid-1870's is generally explained by the crash of financial speculation based on the boom of the emigrants remittances that followed the end of the Paraguay war, and by the pbyloxera plague that affected the Portuguese vineyards in the 1870's.
10 B.3 - The near stagnation period 1890-1914
Of course, short-term difficulties of the Portuguese economy in the XlXth century were often the consequence of bad harvests. This is quite normal in an economy in which the agricultural sector was still dominant. However, the Portuguese economy also showed some sensitivity to fluctuations in the international economy, mainly in Great Britain and Brazil. This is not surprising if we remember that after the loss of the legal monopoly of Brazilian external trade in 1808, the Portuguese balance of payments was always on the verge of wide deficits, when the high trade and transportation deficits (mainly with Great Britain) were not covered by emigrant remittances (mainly from Brazil), or by foreign loans (from the European markets). Some short-term fluctuations prior to the late 1880's illustrate these connections as we have already noticed.
The crisis of the late 1880's and early 1890's is, however, the most paradigmatic in this perspective. A shortage in the emigrant remittances from Brazil, due to local unrest related to the political changes that occurred in 1888-1891 was perhaps the immediate cause of the problems. A colonial diplomatic crisis with Great Britain in 1890 helped to worsen the situation. Then came the 1891-1892 international financial crisis and Portugal had to abandon the gold-standard (July 1891), and to suspend the payment of part of the service of its external public debt (June 1892).
The agricultural protectionist measures taken in 1889, and the end of the structural economic policy directed towards the building of transportation facilities and of other social infrastructures in consequence of the financial problems of the state complete the picture explaining why the Portuguese economy was led to a not very typical "belle époque". Colonial expansion was, for many people at that time, a good alternative as an economic stimulant. However, it is doubtful if it proved to be an efficient one.
Reis, 1987 points to rates of growth for industry during this period in the range 2.0-2.5%. This means agricultural growth must have been much less to ensure the overall performance of about 1.0% given by our estimates. This agricultural stagnation may be the cause of the rise of emigration on the eve of the first world war. All this helps to explain the rise of the republican party, that led to the fall of the monarchy in 1910. At the same time, the explanations sought in Valerio, 1986 regarding the absence of coincidence between the period of important public
11 investment (1850's-1880's) and the period of higher economic growth, become irrelevant.
B.4 - The setback during the First World War
The shortage of external supplies of some vital commodities, such as foodstuffs (like wheat), and fuels (like coal) not to mention transportation services (where British vessels were dominant) was the main problem the Portuguese economy had to face during the First World War. As a matter of fact, there were no military operations in Portuguese territory; the sinking of Portuguese ships by German submarines was the only important capital damage incurred, and even this was compensated by the requisition of German ships harboured in Portuguese ports (what remained of these ships was later taken as war indemnity according to the Treaty of Versailles). However, Portugal could not profit from the higher demand of the main belligerents, because its industrial structure was unable to respond to such a demand.
Besides this, there was an inflationary process, resulting from the combination of commodity shortages with a rising money supply. This rise in money supply was in itself the result of central bank loans to finance the high public deficit due to the war expenditures.
Things were not dramatic as long as Portugal was fighting only in its African colonies against sporadic German attacks (1914-1916). After the German declaration of war (March 1916) however, Portuguese troops were sent to Flanders and there was some bitter fighting on the Mozambique/Tanganika frontier. At the same time, the Portuguese economy was thrown into a very deep crisis that lasted until 1921. Social and political unrest accompanied this economic crisis: several coups d'etat and even a short civil war between monarchic and republican parties (winter 1919) dominated the Portuguese life of these years.
B.5 - The inter-war period
Recovery from the deep first world war crisis began in 1921, but inflation continued to rise until 1924, perhaps because of the depreciation of Portuguese currency due to the uncertainty about the payment of war indemnities and debts. When this problem was solved, by the mid-1920's, inflation was tamed by suc-cessful short-term policies. At the same time, a structural economic policy based in
12 the development of primary and technical education was pursued by the republican governments. All this explains why Portugal was able to achieve general prosperity in the late 1920's.
However, economic stability had not been recovered in time to ensure the survival of the democratic regime overthrown by the army in 1926. The jump in per capita income in 1928 (almost certainly exagerated in the estimate), and the absence of any setback associated with the so-called great depression certainly helped to stabilize the new authoritarian political regime that would last until the 1970's.
Looking at the European context, the performances of the 1920's and of the 1930's may be considered perfectly normal. Anyway, short-term economic policies implemented from 1922 on certainly helped. Classical deflationary measures to fight inflation and intervention in exchange markets to fight depreciation were the policies of the 1920's. An original mix of deflationary and inflationary measures (balanced budget, currency depreciation, and low interest rate) was the Portuguese response to the great depression. This may explain why only the 1936 international crisis had discernible effects on the Portuguese economy, perhaps in consequence of the outbreak of the Spanish civil war with all its disturbing consequences for a neighbour country.
B.6 - The setback during the Second World War
The setback resulting from the second world war was much less serious than the setback resulting from the first world war. This was mainly the consequence of Portuguese nonbelligerency during the second world war. Anyway the shortage of foreign supplies of vital commodities and the inflationary process were quite similar, if we except the fact that the highly positive balance of payments was now the cause of the growth of money supply.
Some kind of prosperity due to the soaring of raw tungsten exports and to invisible inflows linked to the presence of many refugees also helped to diminish the negative impact of the war economy, and to ensure that problems did not last beyond the end of the war.
13 B.7 - The Post-Second World War period
With the exception of the 1948-1949 slowdown, and of the almost imperceptible 1952 recession, the years between the second world war and the international crisis of the mid-1970's were a very prosperous period. Even the war against pro-independence parties in the African colonies of Angola, Guinea-Bissau, and Mozambique, did not affect this growth in the 1960'sand early 1970's.
Sustained growth in the world economy, substantial emigrants' remittances from highly developed European countries, and participation in European economic integration (Portugal was a member of the EOEC - and then of OECD - from its beginnings, belonged to EFTA between 1959 and 1985, and is an EEC member since 1986) were the main aspects of the favourable international background of the post-second world war period that certainly helped the expansion of the Portuguese economy. Internal factors were, however, also important. Traditional obstacles to sustained growth seemed to have been overcome, as we shall see later in more detail.
B.8 - Recent times since 1974
From the 1970's on the situation changed. The Portuguese economy showed high sensitivity to oil-shocks and to stop-and-go policies implemented because of external financial difficulties, and short depressions alternated with periods of growth (anyway, the situation would look better if we considered the period 1985-1988 which was undoubtly a prosperous one). In this context, the impact of the first oil shock certainly helped to create the short-term background for the 1974 revolution and for the political unrest that lasted until 1976, and the good average performance of the following years was certainly favourable to the stabilization of the new democratic regime.
C - Portuguese economic growth: international comparisons and general comments C.1 - The XlXth and early XXth centuries
Judged by international standards the performance of the Portuguese economy was rather poor in the near stagnation periods of 1833-1860 and 1890-1914 and during the first world war. Because of this, the good performance of the years 1860-1890 was not enough to avoid a general trend of retardation between the 1830's
14 and the 1920's. A comparison of Portuguese figures with Bairoch's figures for Europe taken from Bairoch, 1976 will illustrate this fact.
Table 3a
PORTUGUESE ECONOMIC GROWTH: INTERNATIONAL COMPARISONS 1833-1920
Year
Per capita gross domestic product
1960 USA dollars Period
Rate of growth of per capita gdp per
year percentage
Portugal Europe Portugal Europe
1830 (a) (b)167 240 1830-1860 (c)-0.2 +0.9
1860(a) 159 310 1860-1890 +2.0 +0.8
1890(a) 286 388 1890-1913 0 + 1.4
1913 284 534 1913-1920 -5.9 -3.3
1920 186 422
a)Three-year annual averages. (b)1835.
(c) 1835-1860
It is clear that until the 1920's the Portuguese economy was not able to achieve sustained growth. External dependence, traditional institutions, and lack of natural, human and produced resources have been advanced as general explanations for such a situation. Let us make a brief analysis of their explanatory capacity.
It is clear from our estimates that periods of higher integration in the world economy were periods of higher growth. This seems to undermine the external dependence thesis. On the contrary, theses that stress wrong or insufficient specialization in the international economy become reinforced.
Institutional reforms appear as necessary but not sufficient conditions for economic growth. For instance, the institutional reforms of the 1850's and 1860's were important to ensure the 1860-1890 period of growth, but were unable to sustain that growth after 1890.
Let us add some remarks about specific institutional aspects. Efficient implementation of good structural (and short-term) economic policies were certainly helpful to economic growth, as the above comments about the main periods of the evolution of the Portuguese economy largely showed. Banking institutions never assumed the investment bank features that seem more in keeping with the degree of backwardness of the Portuguese economy. Excessive fragmentation of landed property in the northern part of the country and in the Atlantic islands, and latifundia in the southern part of the country have been also blamed as an obstacle to the improvement of agricultural productivity. However, studies like Rets, 1982 cast serious doubts on such hypotheses.
15 Lack of natural resources is a complex matter. Portugal is not endowed with plenty of good soils and mineral ores. These circumstances are, of course, not very favourable to economic growth. However, Portugal is neither an extreme case of bad climate nor of inaccessability of the existing natural resources. This means that problems with natural resources could be overcome through foreign trade. Such a solution had, in fact, been contemplated but was not pushed far enough to ensure modern economic growth in the XlXth and early XXth centuries. This may be considered as a problem of lack of initiative, which brings us to the human resources problem.
Lack of human resources was mainly a qualitative matter. The population grew, as we have seen above, although not at a high rate. The real problem was poor basic and technical education, and lack of entrepreneurial initiative. We will not enter into details about the reasons, for instance, of the high illiteracy rate or of the absence of good engineers and managers, because this would take too much space. It may be suggested, however, that the inefficiency of the formal education system contributed to this poor result because of low private demand due to cultu-ral features, low public expenditure due to the financial problems of the state, and high cost due to geographical conditions.
Lack of produced resources is not systematically proved with statistical data, but it is perfectly evident (let us recall, for instance, the late building of the first Portuguese railways). It was probably a consequence of a low savings rate and of low capital imports. The low savings rate is, of course, the result of cultural features that make for dominant specific inter-temporal preferences which are unfavourable to economic growth. The low capital imports may be explained by the traditional be-haviour of the Portuguese state as a bad debtor, which suggested a high degree of risk for investments in Portugal not compensated by sufficiently high profitability. Once more, it is impossible to go into details about these problems, because this would take too much space.
C.2 - The XXth century since the First World War
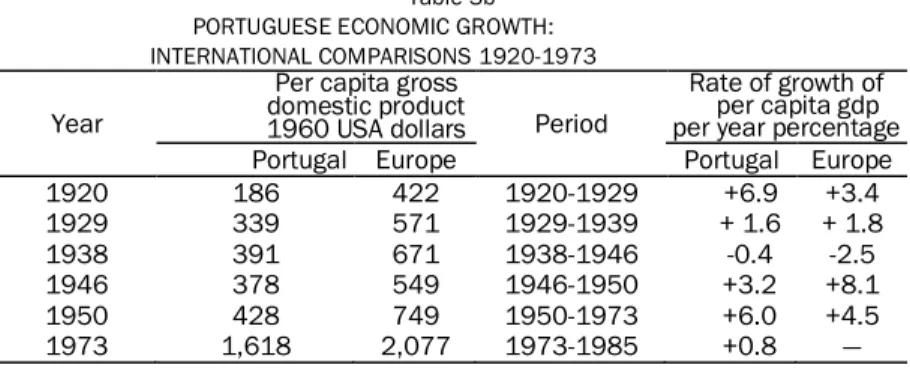
It is clear that since the 1920's the Portuguese economy has been able to achieve sustained growth and to make a clear (but not very spectacular) recovery when judged by international standards. This may be proved pushing the
16 comparison with European figures based on the data of Bairoch, 1976 as far as possible.
Table 3b PORTUGUESE ECONOMIC GROWTH: INTERNATIONAL COMPARISONS 1920-1973
Year
Per capita gross domestic product
1960 USA dollars Period
Rate of growth of per capita gdp per year percentage
Portugal Europe Portugal Europe
1920 186 422 1920-1929 +6.9 +3.4 1929 339 571 1929-1939 + 1.6 + 1.8 1938 391 671 1938-1946 -0.4 -2.5 1946 378 549 1946-1950 +3.2 +8.1 1950 428 749 1950-1973 +6.0 +4.5 1973 1,618 2,077 1973-1985 +0.8 —
How was it possible to overcome the obstacles to sustained economic growth we identified for the XlXth and early XXth centuries? Higher integration in the world economy, a better institutional context, and greater availability of resources are the obvious answers to such a question.
Higher commercial integration in the world economy is clear since the 1920's. The authoritarian political regime that prevailed in Portugal between 1926 and 1974 has often been blamed for an autarchic policy in economic matters. Neither the ratios of exports and imports to gross domestic product, nor institutional facts (let us recall Portuguese links to the European economic integration process from its very beginnings) support such a perspective. Of course, the situation was very different before the Second World War and after the conflict, but this was a mere consequence of the international context. The absence of serious international payments problems until the 1970's was another positive factor. The presence of foreign capital in the Portuguese economy will be dealt with later.
Outstanding institutional changes occurred mainly in the field of state intervention in economic life. We may distinguish three periods: the post-first world war years, the era of the authoritarian regime, and the post-1974 years.
The Post-First World War years saw a new structural economic policy, that will be dealt with again in the context of the problem of human resources, systematic short-term economic policies - a novelty that appeared in the context of the fight against inflation - and an attempt to create a set of public enterprises. Some of these public enterprises were traditional public services with a new kind of management (in savings banks and railroads, for instance); others were an attempt
17 to break into new areas (like sea transportation or social security). Poor results led to the dismantling of this set of public enterprises in the late 1920's.
Administrative control of the creation and expansion of big industrial firms (the so-called industrial conditioning) and public contributions to the originating capital of corporations in new vital making (like hydro-electric plants, air transportation, and steelurgy), leading to the formation of mixed capital enterprises, were the devices used by the new authoritarian regime to stimulate economic development. Their inefficiency has been blamed for the sluggish growth of the Portuguese economy between the 1930's and the 1960's. It is certainly difficult to endorse such a perspective looking at the comparison between Portuguese and European growth above, even if we recognise that industrial conditioning was a brake to competition. Anyway, industrial conditioning was laid aside in the mid-1960's, in the context of a change in explicit development strategy from import substitution to export-led growth.
Systematic nationalization of mixed enterprises and of other big firms and of key sectors of the economy was attempted in the mid-1970's, together with an agrarian reform to destroy private latifundia in the southern part of the country. One decade and a half later the proclaimed intention is to promote privatization in the non-agricultural sector and to reduce the new collectively self-managed latifundia of the south, because of the inefficiency of the solutions of the 1970's. Once more it is fair to suspect that these indictments are exaggerated even if partially correct.
The structural policy directed towards education implemented during the democratic republican regime that prevailed in Portugal between 1910 and 1926 was certainly decisive in the overcoming of the problem of the lack of human re-sources. It is true that progress was very slow in these matters and that the situation is not quite satisfactory even today. The gradual improvement of the main indicators is, however, clear from the 1920's on.
The evolution of the savings rate is not statistically documented. However we may plausibly suppose that a change in cultural attitudes from the prevalence of hoarding to the prevalence of remunerative application occurred during the first half of the XXth century, with positive effects on economic growth.
During the first half of the XXth century, the Portuguese state was unable to borrow in international markets as a consequence of the partial bankrupcy of 1892. However, this does not mean that foreign capital was absent from the Portuguese
18 economy. Direct foreign investment was important in some sectors. Anyway, the 1950's were a turning point in this field. Marshall aid heralded the reopening of international markets to Portuguese public loans, and direct investment grew significantly. Such trends have prevailed until the present, in spite of some external payments problems in the 1970's and 1980's.
Conclusion
Great improvements to the retrospective national accounts presented in the first part are, of course, still possible in the future. Gathering of data on production in different branches of activity, for the formation of production indexes (such as was attempted in the case of the industrial sector in Reis, 1987) is the most pressing need. Together with more data on individual prices, especially in the non-agricultural sectors, and on the consumption structure to improve the adequacy of the weights of price indexes, these efforts may make it possible to correct the estimates of gross domestic product and its deflator, and to re-duct their margins of error.
As far as population is concerned, we believe efforts should be directed to the study of vital and migratory movements in the decades prior to the 1890's. Population estimates for the last decade of the XlXth century and for the XXth century are fairly accurate, but short-term fluctuations in the XlXth century are still obscure.
More work must also be done to explain both the retardation of the Portuguese economy as against European and world leaders and even averages until the First World War, and the recovery made since the 1920's. We believe that a careful comparative approach, mainly in the South European or in the Mediterranean context will be the most fruitful research path.
19
APPENDIX
1 - Computation of gross domestic product at current market prices A - Methodology
The Portuguese statistical office (Instituto Nacional de Estatística) has published a series of national accounts of the continental part of the country for the years 1938 and 1947-1985. In her doctoral thesis (Nunes, 1989), Ana Bela Nunes tried to adjust the figures of gross domestic product at factor cost and current prices for the years 1938 and 1947-1980 to include the islands of Azores and Madeira, using labour force data and the assumption of equal productivity throughout the country in each branch of activity. In this paper, the adjustment was extended to the years 1981-1985, assuming gross domestic product at factor cost and current prices of the islands of Azores and Madeira in those years to be 4.4% of the gross domestic product at factor cost of the continental part of the country, as in 1980. An estimate of gross domestic product at current market prices for the whole country in the years 1938 and 1947-1985 was then obtained by adding to the adjusted figures of gross domestic product at factor cost and current prices those of indirect taxes net of subsidies to production given by the official national accounts data. However, we decided not to use the 1938 figure in our computations because it is widely recognised to be largely undervalued.
For the years 1851, 1855, 1856, 1861 and 1865-1946, we computed an esti-mate of gross domestic product at current market prices for the whole country using exports, fiscal receipts and public expenditure as proxy variables for gross domestic product, and assuming the elasticities of gross domestic product to these proxy variables in these years to be the same as in the years 1947-1985. Two other potential proxy variables for which data was available were not used. The decision not to use imports was taken because their elasticity was statistically not significant, according to the t-test. The decision not to use money supply was taken because we believe that there was a change in the behaviour of economic units towards money during the period under consideration that would make the use of any series corresponding to the usual definitions of money supply meaningless (for further discussion of this issue see Valério, 1984 and Mata, 1987).
The multiple double logarithmic regression of the adjusted official figures of gross domestic product at market current prices on the proxy variables with serial
auto-20 correlation of the first order corrected by the Cochrane-Orcutt method gave the following results:
Dependent variable In gdp Correlation coefficient 1.000
No. of observations 38 Determination coefficient 0.999
Standard error 0.023 Adjusted determination coef. 0.999
F-statistic 1315 Durbin-Watson statistic 1.619
Intercept term 1.800 Rho-parameter 0.479
Independent variables In exp In fr In pe
Elasticity 0.136 0.447 0.273
Standard error of elasticity 0.031 0.075 0.059
t-statistic of elasticity 4.329 5.973 4.658
where:
— gdp denotes gross domestic product at current market prices; — exp denotes exports;
— fr denotes fiscal receipts; — pe denotes public expenditure.
The estimate of gross domestic product at market current prices for the above mentioned years was computed using the formula:
gdp = 31.653 exp0.136 fr0.447pe0.273 based on the previous regression.
For the years 1852-1854, 1857-1860, and 1862-1864, we interpolated the estimate for adjacent years according to the evolution of fiscal receipts and public expenditure, because data about exports was not available. We used the formulas:
Years Formula
1852-1854 43.233 fr0.447pe0.273
1857-1860 45.501 fr0.447pe0.273
1862-1864 45.719 fr0.447pe0.273
where the new constant coefficients were computed to be the average of the values of 31.653 exp0.136 for the adjacent years.
For the years 1833-1845, 1848, and 1850, we extrapolated the above men-tioned estimate according to the evolution of the available proxy variables. We used the formulas:
Years Formula
1833-1841, 1844,1845 and 1850 116.557 pe0.273
1842 and 1843 87.831 exp0.136pe0.273
21 Where the new constant coefficient were computed to be the values of respectively, 31.653 exp0.136fr0.447, 31.653 fr0.447, and 31.653 fr0.447pe0.273 for 1851.
For the years 1846, 1847 and 1849, for which no proxy variables were available, we computed an estimate of gross domestic product at market current prices by exponential interpolation of the estimates for the adjacent years.
B - Sources
— Exports and imports
Data from official statistics, published by the Direcção-Geral de Estatística, or by the Instituto Nacional de Estatística, Lisboa (several issues):
1842, 1843, 1848, 1851, 1855, 1856, 1861 and 1865-1877 - Mappas geraes do commercio de Portugal com as suas possessões e as nações estrangeiras.
1878-1896 - Commercio do Continente do Reino e llhas com os paises estrangeiros e as provindas ultramarinas.
1897-1920 - Commercio e navegação.
1921-1985 - Estatísticas do comércio externo. — Fiscal receipts
Fiscal years 1851-1852 to 1913-1914 - Mata, 1986. Fiscal years 1914-1915 to 1947 - Valério, 1982.
Fiscal years 1948 to 1985 - Contas Gerais do Estado (several issues). — Public expenditure
Fiscal years 1833-1834 to 1844-1845 and 1850-1851 - Lobo, 1871. Fiscal years 1851-1852 to 1913-1914 - Mata, 1986.
Fiscal years 1914-1915 to 1947 - Valério, 1982.
Fiscal years 1948 to 1985 - Contas Gerais do Estado (several issues). — Gross domestic product at current market prices.
1938 and 1947-1980 - Nunes, 1989, and Contas nacionais - Instituto Nacional de Estatística, Lisboa (several issues).
1981-1985 - Contas nacionais - Instituto Nacional de Estatística, Lisboa (several issues).
22 C - Adjustments
— Fiscal years
Fiscal years 1833-1834 to 1933-1934 began on the 1st July of each calendar year and ended on the 30th June of the following calendar year. Accordingly, fiscal receipts for calendar years 1852 to 1933 and public expenditure for calendar years 1834 to 1844 and 1851 to 1933 were computed as the average of, respectively, fiscal receipts and public expenditure of the two fiscal years that included their halves. Fiscal receipts for calendar year 1851 and public expenditure for calendar years 1833, 1845 and 1850 was supposed to be equal to, respectively, fiscal receipts and public expenditure of the fiscal year that included one of their halves and for which data was available.
Fiscal year 1934-1935 began on the 1st July 1934 and ended on the 31st December 1935. Accordingly, fiscal receipts and public expenditure for calendar year 1934 were computed as the average of, respectively, fiscal receipts and public expenditure of fiscal year 1933-1934 and two-thirds of those of fiscal year 1934-1935, and fiscal receipts and public expenditure for calendar year 1935 were computed as two-thirds of, respectively, fiscal receipts and public expenditure of fiscal year 1934-1935.
Fiscal years from 1936 on coincided with calendar years. Accordingly fiscal receipts and public expenditure for calendar years 1936 to 1985 were supposed to be equal to, respectively, fiscal receipts and public expenditure of the corresponding fiscal years.
— War expenditure
The part of public expenditure on the Portuguese expeditionary corps sent to Flanders during the first world war that was spent abroad and financed by a British war loan was subtracted from public expenditure.
D - Data Year Exports 103 contos Imports 103 contos Fiscal receipts 103 contos Public expenditure 103 contos 1833 ? ? ? 10 1834 ? ? ? 12 1835 ? ? ? 12 1836 ? ? ? 11 1837 ? ? ? 10
23 1838 ? ? ? 8 1839 ? ? ? 7 1840 ? ? ? 8 1841 ? ? ? 9 1842 7 10 ? 13 1843 7 12 ? 14 1844 ? ? ? 12 1845 ? ? ? 11 1846 ? ? ? ? 1847 ? ? ? ? 1848 8 11 ? ? 1849 ? ? ? ? 1850 ? ? ? 11 1851 8 12 10 11 1852 ? ? 10 12 1853 ? ? 10 12 1854 ? ? 9 12 1855 12 16 10 13 1856 15 19 10 14 1857 ? ? 10 16 1858 ? ? 11 18 1859 ? ? 11 17 1860 ? ? 11 16 1861 14 25 12 18 1862 ? ? 12 21 1863 ? ? 13 21 1864 ? ? 15 21 1865 16 24 15 21 1866 17 25 13 21 1867 16 26 14 25 1868 16 24 15 25 1869 17 22 15 26 1870 20 24 15 26 1871 21 24 16 22 1872 23 27 17 24 1873 24 30 19 25 1874 23 27 20 28 1875 24 34 21 31 1876 21 30 22 35 1877 23 31 22 35 1878 18 29 24 34 1879 18 33 23 33 1880 25 32 22 32 1881 21 33 24 35 1882 23 34 25 35 1883 23 31 25 34
24 1884 23 33 26 36 1885 23 33 27 40 1886 26 37 29 40 1887 21 37 32 42 1888 23 38 33 47 1889 23 42 33 51 1890 22 44 34 51 1891 21 40 34 52 1892 25 31 35 50 1893 23 38 38 46 1894 24 36 40 45 1895 27 40 42 49 1896 26 40 43 54 1897 27 40 41 55 1898 31 49 41 54 1899 29 51 43 55 1900 31 60 45 55 1901 28 58 45 54 1902 28 56 45 56 1903 31 59 46 57 1904 31 62 48 58 1905 29 61 49 58 1906 31 60 49 59 1907 30 61 49 66 1908 28 67 51 72 1909 31 65 51 71 1910 36 70 51 69 1911 34 68 48 66 1912 34 75 49 73 1913 35 89 50 72 1914 27 69 47 64 1915 34 76 46 92 1916 56 129 48 130 1917 55 137 50 158 1918 83 178 57 195 1919 107 229 77 234 1920 222 691 110 330 1921 225 933 152 478 1922 444 1,252 248 868 1923 684 2,229 439 1,179 1924 949 2,958 645 1,299 1925 862 2,484 775 1,468 1926 736 2,342 862 1,666 1927 723 2,663 939 1,746 1928 1,029 2,679 1,206 1,713 1929 1,073 2,529 1,496 1,809
25 1930 945 2,406 1,494 1,796 1931 812 1,674 1,461 1,788 1932 791 1,707 1,490 1,889 1933 802 1,905 1,522 1,952 1934 909 1,965 1,599 1,947 1935 923 2,294 1,651 1,919 1936 1,026 1,994 1,612 1,985 1937 1,202 2,353 1,663 2,035 1938 1,139 2,300 1,753 2,258 1939 1,336 2,077 1,685 2,357 1940 1,619 2,441 1,727 2,382 1941 2,972 2,468 1,911 2,787 1942 3,939 2,477 2,365 2,928 1943 4,035 3,323 2,454 3,617 1944 3,166 3,920 2,526 3,456 1945 3,237 4,050 2,571 3,853 1946. 4,587 6,857 2,868 4,394 1947 4,307 9,445 3,288 5,621 1948 4,295 10,351 3,495 5,607 1949 4,089 9,043 3,687 5,578 1950 5,334 7,879 3,842 5,025 1951 7,559 9,472 4,280 5,490 1952 6,811 9,988 4,548 5,701 1953 6,283 9,513 4,540 6,241 1954 7,297 10,085 4,778 6,513 1955 8,165 11,453 5,134 7,150 1956 8,621 12,725 5,465 7,386 1957 8,289 14,422 5,790 8,001 1958 8,299 13,809 6,257 8,440 1959 8,351 13,681 6,637 9,485 1960 9,408 15,695 7,270 11,039 1961 9,373 18,863 8,232 13,148 1962 10,632 16,830 8,680 14,530 1963 12,024 18,866 9,428 15,339 1964 14,831 22,377 9,750 16,771 1965 16,573 26,553 11,924 17,217 1966 17,812 29,406 12,989 18,615 1967 20,166 30,453 15,028 21,953 1968 21,917 33,858 16,510 24,024 1969 24,526 37,262 18,873 26,815 1970 27,299 45,495 23,011 30,765 1971 30,248 52,416 27,799 35,634 1972 35,255 60,684 29,658 39,723 1973 45,41 74,776 35,498 47,610 1974 58,014 118,095 42,878 61,865 1975 49,328 99,474 48,235 84,851
26 1976 55,089 130,859 65,884 122,387 1977 77,685 190,684 91,297 155,582 1978 106,451 230,128 110,655 210,548 1979 176,051 331,927 139,896 273,312 1980 231,623 475,486 192,868 364,740 1981 256,913 609,014 267,171 481,708 1982 331,743 756,981 323,628 582,141 1983 508,568 899,34 434,492 737,019 1984 760,58 1,160,633 511,125 913,642 1985 971,747 1,326,529 629,366 1,202,886
Annual gross domestic product at current market prices 103 contos.
1938 13,692 data for the years 1947-1985 may be found in the text.
E - Margins of error
We tried to estimate the margins of error of our estimates of gross domestic product at current market prices, computing alternative estimates based on simple linear regressions on each of the proxy variables and comparing them with the estimates presented in the text. We accepted as estimates of the margin of error the maximum and minimum of the average of the ratios of the alternative estimates to the adopted figure of gross domestic product at current market prices.
These procedures led to the following results:
a) Adjusted official data for the years 1947-1985: margin of error of —5% to+5%. b) Estimates based on the multiple double logarithmic regression on the proxy variables for the years 1865-1946: margin of error of —11% to + 17%.
c) Interpolated estimates for the years 1851-1864: margin of error of -8% to+ 26%.
d) Interpolated and extrapolated estimates for the years 1833-1850: margin of error of -45% to +54%.
2.Computation of the deflator of gross domestic product A - Methodology
Portuguese official national accounts data include estimates at constant 1954 prices for the years 1938 and 1947-1958, at constant 1963 prices for the years 1958-1976, and at previous year prices for the years 1977-1985. Filling the 1976-1977 gap with an estimate presented by the annual reports of the central bank (Relatório do Banco de Portugal, several issues), we obtained the series of the deflator of gross domestic product for the years 1938 and 1947-1985. As in the
27 case of gross domestic product itself, we decided not to use the 1938 figure in our computations because its bad quality is widely recognised.
For the years 1833-1946, we computed an estimate of the deflator of gross domestic product at market current prices using the so-called index of the cost of living as a proxy variable for the deflator, and assuming that the elasticity of the deflator to this proxy variable in these years was the same as in the years 1947-1981. The index of the cost of living is a rough consumers price index published by the social security office (Direcção-Geral da Previdência Social) and by the statistical office for the years 1900-1981. We computed an estimate of this index of the cost of living for the years 1833-1899 using raw data from David Justino's doctoral thesis (Justino, 1986). Two other potential proxy variables for which data was available were not used. The decision not to use the wholesale price index for the years 1891-1931 presented in Mata, 1987, and the wholesale price index for the years 1833-1912 presented in Justino, 1986 was taken because attempts to link them to the price index implicit in official figures of gross domestic product through chain simple double logarithmic regressions gave poor results.
The simple double logarithmic regression of the price index implicit in official figures of gross domestic product at market current prices on the index of the cost of living with serial auto-correlation of the first order corrected by the Cochrane-Orcutt method gave the following results:
Dependent variable In ipi Independent variable In ici
Number of observations 34 Correlation coefficient 0.997
Determination coefficient 0.994 Adjusted determination coef. 0.994
Standard error 0.030 F-statistic 5290
Durbin-Watson statistic 1.427 Rho-parameter 0.375
Intercept term -1.417 Elasticity 0.816
Standard error of elasticity 0.011 T-statistic of elasticity 72.7 where:
— ipi denotes the price index implicit in official figures of gross domestic product at current market prices;
— icl denotes the index of the cost of living.
An estimate of a deflator for gross domestic product at current market prices was computed using a formula based on the regression:
28 where d denotes the estimate of a deflator for gross domestic product at current market prices, and the constant factor was computed to adjust the index to a 1914 basis.
The final series of a deflator for gross domestic product at current market prices was made using:
a) The above mentioned estimate of a deflator for gross domestic product at current market prices for the years 1833 to 1946.
b) The price index implicit in official figures of gross domestic product at market current prices for the years 1947-1985. This price index was multiplied by 24.674 to adjust it to the 1914 basis.
The deflator of gross domestic product was adjusted to a 1914 basis to avoid working with very small figures in the period before the first world war, and because such a basis makes some international comparisons easier as we shall see later. B - Sources
— Surrogate index of the cost of living
Computed from data presented in Justino, 1986. — Lisbon index of the cost of living
Costa, 1917.
— Index of the cost of living
Official data from Anuário Estatístico - Instituto Nacional de Estatística, Lisboa (several issues).
— Deflator implicit in official figures of gross domestic product
1938 and 1947-1980 - Nunes, 1989 and Contas nacionais - Instituto Nacional de Estatística, Lisboa (several issues).
1891-1985 – Contas nacionais – Instituto Nacional de Estatística, Lisboa (several issues).
C - Computation of the surrogate index of the cost of living.
Indexes for individual commodities presented by Justino, 1986 were adjusted to a 1912 basis equal to 98 (the value of the Lisbon index of the cost of living for that year), and an overall index was computed using the weights of the index of the cost of living presented in Costa, 1917.
29 Year Surrogate index of the cost of living Year Surrogate index of the cost of living Year Surrogate index of the cost of living 1833 46 1860 75 1887 70 1834 56 1861 80 1888 70 1835 70 1862 81 1889 76 1836 63 1863 77 1890 86 1837 49 1864 80 1891 83 1838 49 1865 77 1892 85 1839 51 1866 80 1893 87 1840 58 1867 86 1894 89 1841 61 1868 80 1895 84 1842 54 1869 79 1896 85 1843 50 1870 74 1897 92 1844 42 1871 72 1898 96 1845 42 1872 72 1899 94 1846 54 1873 95 1900 92 1847 51 1874 78 1901 87 1848 45 1875 79 1902 88 1849 48 1876 80 1903 97 1850 55 1877 91 1904 87 1851 50 1878 90 1905 81 1852 49 1879 86 1906 82 1853 62 1880 80 1907 91 1854 76 1881 82 1908 90 1855 74 1882 83 1909 89 1856 93 1883 79 1910 92 1857 77 1884 73 1911 97 1858 70 1885 70 1912 98 1859 78 1886 72 Year Lisbon index of the cost of living Year Lisbon index of the cost of living Year Lisbon index of the cost of living 1900 91 1906 95 1912 98 1901 90 1907 95 1913 101 1902 87 1908 96 1914 100 1903 90 1909 97 1915 112 1904 96 1910 93 1916 137 1905 95 1911 99 Year index of the cost of living Year index of the cost of living Year index of the cost of living 1914 100 1937 2,102 1960 4,472 1915 112 1938 2,037 1961 4,461 1916 137 1939 1,918 1962 4,459 1917 162 1940 2,009 1963 4,575 1918 293 1941 2,258 1964 4,799 1919 335 1942 2,758 1965 4,955 1920 580 1943 3,118 1966 5,081 1921 909 1944 3,208 1967 5,293 1922 1,099 1945 3,497 1968 5,398 1923 1,726 1946. 3,980 1969 5,543
30 1924 2,399 1947 4,103 1970 5,822 1925 2,306 1948 3,381 1971 6,253 1926 2,208 1949 3,920 1972 6,778 1927 2,371 1950 3,819 1973 7,299 1928 2,269 1951 3,872 1974 10,064 1929 2,361 1952 3,878 1975 11,929 1930 2,243 1953 3,913 1976 14,391 1931 1,990 1954 3,944 1977 19,136 1932 1,949 1955 4,077 1978 24,257 1933 1,948 1956 4,256 1979 30,103 1934 1,968 1957 4,257 1980 35,641 1935 1,972 1958 4,318 1981 41,372 1936 2,022 1959 4,375
Year Price index
implicit in gross domestic
product data
Year Price index
implicit in gross domestic
product data
Year Price index
implicit in gross domestic product data 1938 38 1959 94 1973 156 - - 1960 96 1974 185 1947 84 1961 98 1975 215 1948 83 1962 98 1976 249 1949 87 1963 100 1977 312 1950 85 1964 102 1978 380 1951 89 1965 106 1979 449 1952 91 1966 111 1980 548 1953 89 1967 115 1981 647 1954 87 1968 116 1982 781 1955 89 1969 123 1983 974 1956 92 1970 127 1984 1,214 1957 92 1971 133 1985 1,474 1958 93 1972 143 E – Margins of error
The margins of error of the deflator of gross domestic product at current market prices are impossible to estimate because we lack reliable alternative estimates. We decided rather arbitrarily to assume the deflator of gross domestic product at current market prices to have the same margins of error we computed for the figures of gross domestic product for the same years.
3. Computation of population A – Methodology
The first official estimate of the population of Portugal dates from 1820. This kind of estimate was repeated in 1841, 1854, 1857, 1858, 1861 and 1862. To produce a year to year estimate of the population at the end of the year, unknown reference dates were supposed to be the 1st January, that is to say the end of the
31 previous year, and estimates for intermediate years (1833-1839, 1841-1852, 1854, 1855, 1858, 1859 and 1862) were made by exponential interpolation.
The first three Portuguese population censuses took place on the 1st January 1864, on the 1st January 1878, and on the 1st December 1890. A year to year estimate of the population at the end of the year, for the years 1864-1889 was made by exponential interpolation of the results of these censuses.
From 1886 on, yearly vital and emigration statistics are available. In her doctoral thesis (Nunes, 1989), Ana Bela Nunes used this data and the results of population censuses to make year-to-year estimates or the population at the end of the year for the years 1890-1980. We have adopted these estimates here, with minor computation corrections, except for the 1970's. We made a new estimate for this decade based on different assumptions about external migrations. We separated current net emigration and the arrivals of residents from the Portuguese African colonies. As far as current net emigration is concerned we assumed its ratio to legal emigration to be the same as in the 1960's. With regard to the arrivals of residents from the Portuguese African colonies we assumed their total to be equal to the value of the following expression;
- arrivals = population at 1981 census - population at 1970 census - live births between censuses + deaths between censuses + current net emigration between censuses;
- and their time distribution to be one third in 1974, one half in 1975 and one sixth in 1976.
Population for the years 1981-1985 is an official estimate of the statistical office.
B - Sources
1820-1890 - Recenseamento Geral da População, published by the Direcção-Geral de Estatística (several issues), and Serrão, 1973.
1890-1981 - Recenseamento Geral da População and Anuário Estatístico, published by the Direcção-Geral de Estatística or by the Instituto Nacional de Estatística (several issues), and Nunes, 1989.
1981-1985 - Anuário Estatístico, published by the Instituto Nacional de Estatística (several issues).
32 C - Data 1820-1890 Year Population 103 inhabitants Year Population 103 inhabitants Reference date 1820 3,297 1964 4,188 1st January 1841 3,737 1878 4,551 1st January 1854 3,844 1890 5,103 1st December 1857 3,909 1858 3,923 1861 4,035 1862 4,110 D – Data 1890-1981 Year Live births
103 people Deaths 103 people Net immigration (+) net emigration (-) 103 people Population 103 people 1890(a) 14 11 -1 5,105 1891 162 116 -13 5,138 1892 159 104 -12 5,182 1893 164 110 -17 5,220 1894 154 107 -15 5,251 1895 156 108 -25 5,275 1896 158 120 -15 5,297 1897 161 116 -12 5,331 1898 161 114 -13 5,365 1899 161 108 -10 5,407 1900 165 110 -12 5,450 1901 171 114 -10 5,497 1902 176 108 -12 5,552 1903 183 112 -11 5,613 1904 177 106 -14 5,670 1905 180 113 -17 5,720 1906 183 125 -19 5,758 1907 176 113 -21 5,800 1908 175 116 -20 5,840 1909 175 112 -19 5,883 1910 187 113 -20 5,937 1911 230 131 -31 6,004 1912 208 120 -85 6,008 1913 194 123 -74 6,004 1914 188 116 -25 6,053 1915 195 123 -19 6,107 1916 193 129 -24 6,147 1917 188 134 -15 6,186
33 1918 179 249 -11 6,104 1919 166 153 -35 6,082 1920 203 143 -58 6,084 1921 197 126 -7 6,148 1922 204 126 -11 6,216 1923 207 142 -10 6,271 1924 207 126 -8 6,344 1925 208 117 -6 6,429 1926 217 128 -11 6,507 1927 203 123 -7 6,580 1928 211 124 -9 6,658 1929 201 119 -11 6,729 1930 203 117 -3 6,812 1931 204 115 +6 6,908 1932 208 119 +6 7,003 1933 204 121 +10 7,096 1934 203 119 +8 7,189 1935 204 123 +10 7,279 1936 206 119 +13 7,379 1937 198 117 +16 7,476 1938 199 115 +14 7,575 1939 199 116 +19 7,677 1940 188 120 +13 7,758 1941 184 135 -7 7,800 1942 188 127 -2 7,859 1943 198 122 -1 7,934 1944 201 119 -3 8,013 1945 209 116 -6 8,101 1946. 206 121 -4 8,182 1947 200 110 -14 8,258 1948 221 108 -13 8,358 1949 212 117 -19 8,434 1950 205 103 -25 8,512 1951 208 105 -68 8,547 1952 211 100 -95 8,563 1953 202 97 -80 8,587 1954 198 95 -83 8,607 1955 210 99 -60 8,657 1956 203 107 -54 8,698 1957 211 102 -71 8,737 1958 212 92 -69 8,789 1959 213 98 -67 8,837 1960 214 95 -65 8,891 1961 218 100 -65 8,944 1962 220 97 -65 9,002 1963 212 98 -77 9,040
34 1964 217 97 -107 9,053 1965 210 95 -172 8,996 1966 207 100 -232 8,871 1967 202 96 -179 8,798 1968 195 95 -155 8,743 1969 190 101 -135 8,696 1970 173 93 -128 8,648 1971 189 98 -97 8,642 1972 175 90 -104 8,622 1973 172 95 -154 8,545 1974 172 97 +271 8,891 1975 180 98 +484 9,457 1976 187 102 +143 9,685 1977 181 96 -33 9,737 1978 167 96 -36 9,772 1979 160 93 -40 9,800 1980 161 98 -35 9,828 1981(b) 32 20 -7 9,833
(a) Data for 1890 refers only to the period between the census (1st December) and of the year.
(b) Data for 1981 refers only to the period between the beginning of the year and the census (15th March).
E - Margins of error
We tried to estimate the margins of error of the population figures for the years 1890-1985, computing the average of the ratios of the algebraic sum of live births, deaths and legal emigration in the inter-censuses periods to the results of the censuses. This procedure led to a figure of ± 3.5%.
The margins of error of the population figures for the years 1833-1890 are impossible to estimate, because we lack alternative data. We may perhaps assume the margins of error of the population figures for these years not to be larger than ± 7%, according to general comments that precede the presentation of the counts and censuses.
4. Computation of gross domestic product at 1914 market prices, and per capita gross domestic product
Gross domestic product at 1914 market prices was computed as the ratio of gross domestic product at current market prices to its deflator.
Per capita gross domestic product at 1914 market prices was computed as the ratio of gross domestic product at factor cost and constant prices to population.
35 5. A note on Portuguese monetary units
At the beginning of the period under consideration, the Portuguese monetary regime was based on bimetalism. A law of the 6th March 1822 implicitly defined the monetary unit (the real, plural reis) as 1.734 mg of gold and 27.745 mg of silver — the par was then £ 1 = 4,225 reis. The silver definition of the real was changed by a law of the 24th April 1835 to 26.850 mg.
A decree of the 13th March 1847 changed the gold value of the real to 1.626 mg — the par became £ 1 = 4,500 reis. Such a definition was maintained when the law of the 29th July 1854 adopted gold monometalism (the classical gold-standard) as the new monetary regime of the country.
The gold-standard was dropped de facto (though not de jure) by the law of the 9th July 1891 that suspended sine die the convertibility of bank notes (and gave the monopoly of its emission to the Bank of Portugal). A law of the 22nd May 1911 replaced the real by the escudo equal to 1,000 réis as the monetary unit. The gold-standard was, however, maintained de jure and the new unit was defined as 1.626 g of gold.
A decree of the 9th June 1931 tried to link Portugal to the gold-exchange standard, and replaced the definition of the escudo which became 65.51 mg of gold. In practice, the escudo was pegged to sterling at the ratio £ 1 = 110 escudos until 1940, and then to the dollar at the ratio $ 1 = 25 escudos, later modified to $ 1 = 28.75 escudos, until 1971. From that year on, depreciation was the main trend, and the de jure gold definition of the escudo was formally dropped in 1975.
Throughout the period, the conto was an accounting unit of one million réis or one thousand escudos.
6. Conversion to 1960 USA dollars
Conversion of figures expressed in 1914 escudos to figures expressed in 1960 dollars at an exchange rate parity, may be done by multiplication by a factor of 0.824, that corresponds to the ratio of the 1960 Portuguese price index with a 1914 basis (23.69) to the 1960 dollar escudo exchange rate (28.75).
To adjust this conversion to a purchasing power parity the conversion factor must be multiplied by a new factor of 2.197 that corresponds to the inverse of the Portuguese 1960 price index with a 1960 American basis (45.52% according to
36
Summers, Heston, 1988). This leads to a factor of 1.810 for the direct conversion at a purchasing power parity.
37
REFERENCES
Bairoch, Paul: "Europe's gross national product: 1800-1975". The Journal of Euro-pean economic history, volume 5, number 2, fall 1976.
Costa, J. Aquino: "O custo de vida em Portugal". Boletim de Previdência Social, no. 3, 1917.
Justino, David: "A formação do espaço económico nacional: Portugal 1810-1913". Ph. D. thesis presented at the Faculty of Social and Human Sciences, New Uni-versity of Lisbon, 1986.
Justino, David: "Acerca da evolução do PNB em Portugal 1850-1910". Análise Social, no. 97,1987.
Lobo, Ferreira: As confissões dos ministros de Portugal (1832-1871). Typographia Lisbonense, Lisboa, 1871.
Mata, Eugénia: "As finanças públicas portuguesas da Regeneração à primeira guerra mundial". Pb. D. thesis presented at the Institute of Economics, Technical University of Lisbon, 1986.
Mata, Eugénia: Câmbios e política cambial na economia portuguesa 1891-1931. Sá da Costa, Lisboa, 1987.
Mata, Eugénia. "As três fases do fontismo: projectos e realizações. Estudos e ensaios - em homenagem a Vitorino Magalhães Godinho. Sá da Cosa, Lisboa, 1989.
Nunes, Ana Bela - "População activa e actividade económica em Portugal dos finais do século XIX à actualidade - uma contribuição para o estudo do crescimento económico português". Ph. D. thesis presented at the Institute of Economics, Technical University of Lisbon, 1989.
Reis, Jaime: "Latifúndio e progresso técnico: a difusão da debulha mecânica no Alentejo, 1860-1930". Análise Social, no. 71,1982.
Reis, Jaime: "O atraso económico português em perspectiva histórica (1860-1913). Análise Social, no. 80,1984.
Reis, Jaime: "A industrialização num país de desenvolvimento lento e tardio: Portu-gal, 1870-1913". Análise Social, no. 97,1987.
Serrão, Joel: Demografia portuguesa. Horizonte, Lisboa, 1973.
Summers, Robert; Heston, Alan: "A new set of international comparisons of real pro-duct and prices: estimates for 130 countries, 1950-1985", The Review of Income and Wealth, series 34, number 1, March 1988.
38 Valério, Nuno. "As finanças públicas portuguesas entre as duas guerras mundiais". Ph. D. thesis presented at the Institute of Economics, Technical University of Lisbon, 1982.
Valério, Nuno. "O produto nacional de Portugal entre 1913 e 1947, uma primeira approximação". Revista de História Económica e Social no. 11,1983.
Valério, Nuno: A moeda em Portugal 1913-1947. Sá da Costa, Lisboa, 1984. Valério, Nuno. "The role of the government in Portuguese economic growth".