Physical activity in the rural population
of Pelotas, Brazil: prevalence and
associated factors
Rafaela Costa MartinsI, Inácio Crochemore Mohnsam da SilvaI, Pedro Curi HallalI
I Universidade Federal de Pelotas. Faculdade de Medicina. Departamento de Medicina Social. Pelotas, RS, Brasil
ABSTRACT
OBJECTIVE: To evaluate the level of physical activity in general and by domains of practice in the rural area of Pelotas, State of Rio Grande do Sul, Brazil, as well as their associated factors.
METHODS: This is a population-based, cross-sectional study with adults living in the rural area of Pelotas. The questionnaire used to measure the prevalence of physical activity was the Global Physical Activity Questionnaire. Individuals who reported at least 150 minutes of weekly physical activity were considered as active. The demographic, economic, labor, and crime safety aspects were evaluated as independent variables. Poisson regression was used for the crude and adjusted analyses.
RESULTS: Final sample consisted of 1,447 individuals. Overall prevalence of physical activity was 83.7% (95%CI 81.3–86.2). Regarding the different domains, 74.9% (95%CI 71.3–78.6) of the participants reached the recommendations of physical activity specifically with work, 25.2% (95%CI 22.4–28.0) with transport, and 15.1% (95%CI 12.2–18.1) with leisure. Men were more active than women in all domains. Individuals with rural work were more active in work and transport. Crime variables were not associated with outcomes.
CONCLUSIONS: The prevalence of general physical activity was high, and was mostly practiced at work. On the other hand, leisure activities were not very prevalent and the associated factors varied in direction and magnitude according to the domains of physical activity evaluated.
DESCRIPTORS: Adult. Exercise. Activities of Daily Living. Cross-Sectional Studies. Rural Population.
Correspondence: Rafaela Costa Martins Rua Marechal Deodoro, 1160 3º piso Centro
96020-220 Pelotas, RS, Brasil E-mail: [email protected]
Received: May 31, 2017 Approved: Nov 2, 2017
How to cite: Martins RC, Silva ICM, Hallal PC. Physical activity in the rural population of Pelotas, Brazil: prevalence and associated factors. Rev Saude Publica. 2018;52 Suppl 1:9s.
Copyright: This is an open-access article distributed under the terms of the Creative Commons Attribution License, which permits unrestricted use, distribution, and reproduction in any medium, provided that the original author and source are credited.
INTRODUCTION
Physical inactivity is a risk factor for several chronic diseases. More than 5.3 million deaths per year worldwide are attributed to physical inactivity1. Even so, almost a quarter of the
adult population and more than half of older adults2 do not reach the recommendations
of 150 minutes of weekly physical activity (PA)3. Because of the harmful effects of physical
inactivity on health and the low levels of physical activity of the world population, physical inactivity has received the status of pandemic4.
Most studies are carried out in urban areas, and there is little evidence on the levels of PA and their associated factors in rural populations, which represents 46% of the world population5 and 16% of the Brazilian population6. Given the sociodemographic, economic,
environmental, labor, and behavioral differences between urban and rural areas, it is expected that both the prevalence of physical inactivity and the factors influencing the practice of PA are different between these population groups. The economy of Pelotas’ rural area is based on cattle breeding and the production of peach, tobacco, and rice, except for one district, which is focused on fishing. The distance between houses and social cohesion are considerably higher in the rural than in the urban area. Most of
the work activities require physical labor. Also, leisure activities are different from the
urban area, which indicates possible differences in behavior (for example in PA). The physical environment (natural or built), for example, is associated with the level of PA of populations, as well as exposure to crime, transportation systems, and urbanization7.
In addition to sociodemographic factors, all these aspects are distributed differently in
the urban and rural areas, especially in middle- and low-income countries. Therefore,
the accumulation of evidence based on urban areas cannot be extrapolated directly to the entire population.
The Brazilian National Health Survey (PNS)8 has shown that the prevalence of general
physical inactivity in the rural area (48.3%) was higher than that found for the urban
population (45.6%). A population-based study conducted in the rural area of State of Minas Gerais, Brazil, using the same definition of physical inactivity as our article, has identified prevalence equal to 13.5%9. In addition to the lack of studies in this population, mainly in Brazil, where there is only one population-based study, there is still a gap on
the prevalence of physical inactivity in individuals living in rural areas, as well as their
associated factors. These data are essential to improve health diagnosis and establish
public interventions and policies in a population group that is historically left behind by
the scientific community. Thus, the objective of this study was to evaluate the level of PA
in general and by domains in the rural area of Pelotas, State of Rio Grande do Sul, Brazil, as well as their associated factors.
METHODS
We carried out a population-based study as a research consortium, which brings together various health interests. With a cross-sectional design, this study was carried out between
January and July 2016 in the rural area of Pelotas, State of Rio Grande do Sul, Brazil, in its
eight districts with approximately 22,000 inhabitants. The main characteristics of the region
are the predominance of small rural properties with rice plantation and fourteen basic health units distributed among the districts. We considered eligible all individuals aged 18 years or more who usually lived in the household or who were absent for a period not exceeding 12 months.
To calculate the sample size estimated by OpenEpi, we considered a prevalence of 86.5%,
error of three percentage points, significance of 5%, and effect of delineation of 2.0, which
of each district. According to the Brazilian Institute of Geography and Statistics (IBGE),
Brazil has approximately two adults per residence; therefore we defined that 30 houses
from each census tract should be selected to reach the sample size. In this selection of households, we used Google Earth to identify the centers, that is, agglomerates with the
largest number of households [at least five houses close to each other (up to 1 km)]. Each
center had a core – a place with more streets connected – and the houses were selected randomly from one of the directions of the streets. If we did not identify 30 households
in the first center, we started the search for the second center with the largest number of
households, and so on.
To measure the outcome, trained interviewers applied the Global Physical Activity Questionnaire (GPAQ) to the participants, measuring PA in three domains (work,
transport, and leisure). This questionnaire was submitted to a repeatability and
concurrent validity study in a city that was emancipated 22 years ago from the rural area of Pelotas (n = 50, estimated based on an intraclass correlation coefficient of 0.79), which still has rural characteristics. The intraclass correlation coefficient between two
applications of the questionnaire in the one-week interval was 0.78 (95%CI 0.63–0.87).
We found moderate correlation (r = 0.5) between the weekly minutes of moderate and
vigorous PA from the questionnaire when compared to the objective measurement using
accelerometry (article in press). The outcome was dichotomized, and we considered active the individual who reached, in a usual week, at least 150 minutes of moderate
PA, 75 minutes of vigorous PA, or the equivalent combination of both intensities. In
addition, we considered the level of PA in each domain as the outcome and the same operational definition was used.
The independent variables evaluated were sex (male; female), categorical age in complete years (18–24 years; 25–39 years; 40–59 years; 59 years or more), categorical education level (0–4 years; 5–8 years; 9 years or more), occupation in three categories (no work,
rural work, non-rural work), body mass index (BMI), calculated by the division between weight and height squared (low weight or eutrophic; overweight; obesity), marital status
(whether or not living with a partner), and socioeconomic level, based on the index of goods measured by principal component analysis. Rural work was defined as specific work in the rural area, such as farming, field work, care of animals, use of tractors, plantations, among others.
In addition to the sociodemographic characteristics, we evaluated the perception of crime safety and victimization as potential environmental factors associated with the
practice of PA according to a scale based on the Neighborhood Environment Walkability Scale (NEWS) and the City Stress Inventory (CSI). The variable of perceived crime safety
considered as poor the participants who answered “once” or “more than once” for some
of the following questions: 1) “Since <month> last year, how many times has a sale or purchase or drugs happened near your home?”; 2) “Since <month> last year, how many
times has a burglary taken place in your neighborhood, that is, something was taken
without violence or threat?”; 3) “Since <month> last year, how many times has physical assault occurred between people in your neighborhood?”; 4) “Since <month> last year,
how many times has a robbery taken place in your neighborhood, that is, something
was taken by violence or threat?”; 5) “Since <month> last year, how many times has murder happened in your neighborhood?”. In relation to victimization, the questions used were: 1) “Since <month> last year, how many times have you been the victim of
burglary, that is, any of your belongings were taken without violence or threat?”; 2) “Since
<month> last year, how many times have you been a victim of robbery, that is, any of your belongings were taken by violence or threat?”; 3) “Since <month> last year, how
many times have you been the victim of physical assault from someone other than your
family?” If the participant answered “once” or “more than once” to one of the questions,
Data analysis was carried out in the statistical package Stata, version 12. Sampling was by clusters and the svy command was used for weight, for the under- or overrepresentation of
households in the district. The proportion of each variable was presented, in addition to their respective 95%CI. Comparison of proportions between groups was done by the chi-square
test of heterogeneity. A linear trend was tested by Poisson regression when it had an apparent
linear association. When the linear trend test did not present a significant value, the p-value
presented in the tables was for heterogeneity. Crude and adjusted analyses were performed by Poisson regression10. We used a four-level hierarchical conceptual model for the adjusted analysis. In the first level, we inserted the variables of sex and age; in the second level, we
inserted the variables of education, occupation, and marital status; in the third level, we inserted the variable of income; and, in the last level, we inserted the variables of perception of crime safety, victimization, and BMI. In the regression, the variables were inserted into the
model using the backwards selection, level by level, excluding those variables with p < 0.20.
After adjusting for each level, the variables of the previous levels remained in the model regardless of the p value11,12. No collinearity was found between the variables of the model after analysis of the inflation value of the variance. The quality of fit of the model was ensure with Pearson testing and model quality deviation.
The project was approved by the Ethics Committee of the Faculdade de Medicina of the
Universidade Federal de Pelotas (Process 1,363,979). All individuals signed the informed consent. More details on the methodology can be found in the article of Gonçalves et al.13
RESULTS
Of the 1,697 eligible individuals, we had 178 losses and refusals, resulting in a total sample
of 1,519 persons. In addition to these losses, 72 individuals did not answer all questions of the PA questionnaire, amounting to 1,447 persons in the final sample. Men accounted for 64% of the losses and refusals. The response rate of this study was 85.3%. Most of the sample
consisted of women (51.7%), those aged between 40 and 59 years (39.2%), those with lower education level (38.7%), those not working (40.6%), those overweight (35.3%), those who lived with a partner (70.8%), those with a good perception of crime safety (74.5%), and those who were not victims of burglary, robbery, or physical assault from someone other than family
in the last 12 months (94.5%) (Table 1). The overall prevalence of active individuals was 83.5% (95%CI 81.0–85.9). Evaluating the different domains, prevalence was 74.9% (IC95%
71.3–78.6) for work, 25.2% (95%CI 22.4–28.0) for transport, and 15.1% (95%CI 12.2–18.1) for leisure (Figure). All categories of the variables of sex, occupation, and index of goods were more prevalent in the work domain (Figure).
Considering all domains of PA, males, individuals aged 18 to 24 years, those with nine or more years of study, workers (mainly those with rural work), those with normal or low BMI,
those who lived with a partner, and those belonging to the 3rd income quintile had a higher
prevalence of PA (Table 1). Table 2 presents the prevalence of PA in the domains according to the
independent variables. Males were more active than females in all domains (p < 0.001), and this difference was more marked in transport and leisure-related PA (approximately 10 percentage
points). Younger individuals were more active in the domain of leisure, and those aged 40–59
were more active in the domain of work and transport. In transport-related PA, there was no difference between education levels; in leisure-related PA, those with higher education level were more active; in work-related PA, those with education level between five and eight years were the most active. The most active were those in the highest quintile of income (24.2%) for leisure, those belonging to the fourth income quintile (29.0%) for transport, and those in the fourth income quintile (79.8%) for work. Participants who did not live with a partner were
more active in the domain of leisure and those who lived with a partner were more active in the domain of work. Individuals with rural work were more active in the domain of work and
transport; however, those with non-rural work were the most active in the domain of leisure
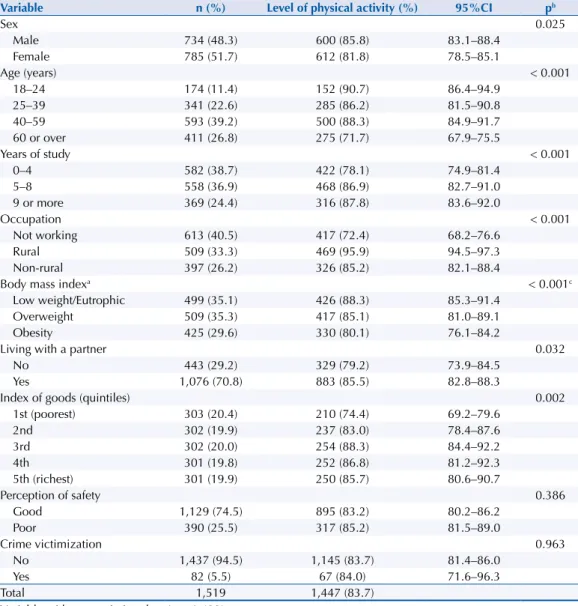
Table 1. Description of the sample and distribution of the variables of exposure according to active individuals. Pelotas, State of Rio Grande do Sul, Brazil, 2016.
Variable n (%) Level of physical activity (%) 95%CI pb
Sex 0.025
Male 734 (48.3) 600 (85.8) 83.1–88.4
Female 785 (51.7) 612 (81.8) 78.5–85.1
Age (years) < 0.001
18–24 174 (11.4) 152 (90.7) 86.4–94.9
25–39 341 (22.6) 285 (86.2) 81.5–90.8
40–59 593 (39.2) 500 (88.3) 84.9–91.7
60 or over 411 (26.8) 275 (71.7) 67.9–75.5
Years of study < 0.001
0–4 582 (38.7) 422 (78.1) 74.9–81.4
5–8 558 (36.9) 468 (86.9) 82.7–91.0
9 or more 369 (24.4) 316 (87.8) 83.6–92.0
Occupation < 0.001
Not working 613 (40.5) 417 (72.4) 68.2–76.6
Rural 509 (33.3) 469 (95.9) 94.5–97.3
Non-rural 397 (26.2) 326 (85.2) 82.1–88.4
Body mass indexa < 0.001c
Low weight/Eutrophic 499 (35.1) 426 (88.3) 85.3–91.4
Overweight 509 (35.3) 417 (85.1) 81.0–89.1
Obesity 425 (29.6) 330 (80.1) 76.1–84.2
Living with a partner 0.032
No 443 (29.2) 329 (79.2) 73.9–84.5
Yes 1,076 (70.8) 883 (85.5) 82.8–88.3
Index of goods (quintiles) 0.002
1st (poorest) 303 (20.4) 210 (74.4) 69.2–79.6
2nd 302 (19.9) 237 (83.0) 78.4–87.6
3rd 302 (20.0) 254 (88.3) 84.4–92.2
4th 301 (19.8) 252 (86.8) 81.2–92.3
5th (richest) 301 (19.9) 250 (85.7) 80.6–90.7
Perception of safety 0.386
Good 1,129 (74.5) 895 (83.2) 80.2–86.2
Poor 390 (25.5) 317 (85.2) 81.5–89.0
Crime victimization 0.963
No 1,437 (94.5) 1,145 (83.7) 81.4–86.0
Yes 82 (5.5) 67 (84.0) 71.6–96.3
Total 1,519 1,447 (83.7)
a Variable with most missing data (n = 1,433). b Chi-square test of heterogeneity.
c Test for linear trend.
Figure. (A) Venn diagram with the proportion of individuals according to level of physical activity in each domain and (B) proportion of physical activity by domains in relation to total physical activity according to sex, occupation, and index of goods. Pelotas, State of Rio Grande do Sul, Brazil, 2016. (n = 1,447)
Leisure-related PA
Work- and home-related PA
PA: physical activity
(A) (B)
Transport-related PA
45.1%
3.4%
2.6%
17.7%
8.4% 3.7%
0.6%
0% 20% 40% 60% 80% 100%
Male Female Not working Rural Non-rural 1st quintile
2nd quintile
3rd quintile
4th quintile
5th quintile
Total
Sex
Occupation
Index of goods
After adjustment, the variable of sex remained significant only in the domains of leisure and transport (men were more active than women) and age was the same as in the crude analysis, in which younger individuals were more likely to reach
the recommendations of general and leisure-related PA. For leisure, the older the Table 2. Distribution of the variables of exposure according to active individuals in the domains of leisure, transport, and work. Pelotas, State of Rio Grande do Sul, Brazil, 2016.
Variable Leisure-related PA (n = 1,498) Transport-related PA (n = 1,486) Work-related PA (n = 1,461) n (%) 95%CI p n (%) 95%CI p n (%) 95%CI p
Sex < 0.001 0.003 0.027
Male 147 (20.5) 15.8–25.2 209 (29.0) 25.9–32.1 546 (77.4) 73.2–81.6
Female 79 (10.2) 8.1–12.3 168 (21.6) 17.8–25.5 550 (72.7) 68.5–76.8
Age (years) < 0.001 0.002 < 0.001
18–24 57 (33.3) 23.8–42.7 40 (23.6) 17.0–30.2 131 (78.3) 17.0–30.2
25–39 58 (17.3) 12.5–22.0 81 (24.0) 19.7–28.2 263 (78.6) 71.9–85.4
40–59 71 (11.9) 8.6–15.3 179 (30.2) 25.8–34.6 468 (81.8) 78.0–85.6
60 or over 40 (10.2) 6.8–13.5 77 (19.5) 15.6–23.3 234 (60.1) 55.5–64.7
Years of study < 0.001* 0.916 0.008
0–4 48 (8.5) 5.3–11.6 141 (25.0) 21.7–28.3 388 (70.3) 66.4–74.2
5–8 87 (15.7) 11.8–19.7 144 (25.7) 21.3–30.1 429 (79.2) 74.3–84.2
9 or more 88 (24.1) 17.0–31.3 91 (25.2) 20.5–29.8 273 (75.8) 69.2–82.4
Occupation 0.002 < 0.001 < 0.001
Not working 72 (12.3) 9.3–15.2 103 (17.6) 14.6–20.5 352 (60.4) 56.4–64.4
Rural 65 (12.8) 8.6–16.9 186 (36.6) 32.6–40.6 458 (92.4) 90.7–94.2
Non-rural 89 (22.6) 16.8–28.3 88 (22.2) 16.9–27.4 286 (74.6) 69.7–79.5
BMI 0.003* 0.113 < 0.001*
Low weight/Eutrophic 93 (18.6) 14.7–22.5 139 (28.1) 24.4–31.7 390 (80.0) 75.3–85.2
Overweight 81 (16.0) 11.8–20.3 123 (24.3) 20.4–28.1 380 (76.7) 71.8–81.5
Obesity 49 (11.7) 8.4–15.1 104 (24.3) 20.2–28.4 289 (69.7) 65.1–74.4
Living with a partner 0.011 0.793 0.002
No 84 (19.5) 14.8–24.3 107 (24.8) 20.0–29.6 283 (67.4) 60.5–74.4
Yes 142 (13.4) 10.2–16.5 270 (25.4) 22.7–28.0 813 (78.0) 74.7–81.2
Index of goods (quintiles) < 0.001 0.162 < 0.001
1st (poorest) 27 (9.4) 6.2–12.7 71 (24.0) 18.8–29.2 185 (64.8) 59.8–69.8
2nd 32 (10.8) 7.3–14.3 84 (28.4) 22.7–34.1 223 (76.6) 72.6–80.7
3rd 53 (17.9) 11.6–24.2 74 (24.7) 18.6–30.7 230 (79.4) 73.1–85.7
4th 39 (13.3) 8.0–18.5 87 (29.0) 22.8–35.3 233 (79.8) 74.1–85.5
5th (richest) 73 (24.2) 18.5–29.9 60 (20.4) 15.2–25.6 217 (73.8) 66.4–81.1
Perception of safety 0.297 0.318 0.356
Good 162 (14.6) 11.5–17.8 270 (24.3) 21.0–27.6 808 (74.4) 70.1–78.8
Poor 64 (16.6) 12.6–20.6 107 (27.9) 21.4–34.4 288 (76.4) 73.0–79.8
Victim of crimes 0.123 0.783 0.187
No 207 (14.7) 11.9–17.5 357 (25.3) 22.4–28.1 1,041 (75.4) 72.0–78.8
Yes 19 (22.7) 9.6–35.8 20 (23.8) 13.2–34.5 55 (67.4) 52.5–82.2
individuals, the less likely they are to be active. When we analyzed all domains of PA, the persons with a higher education level had an 11% higher prevalence of being active when compared to less educated individuals (PR = 1.11; 95%CI 1.05–1.18). The variables of crime were not significant in the crude or adjusted analysis. Marital status and BMI did not remain statistically significant after adjustment in any domain or in the general context (Tables 3 and 4).
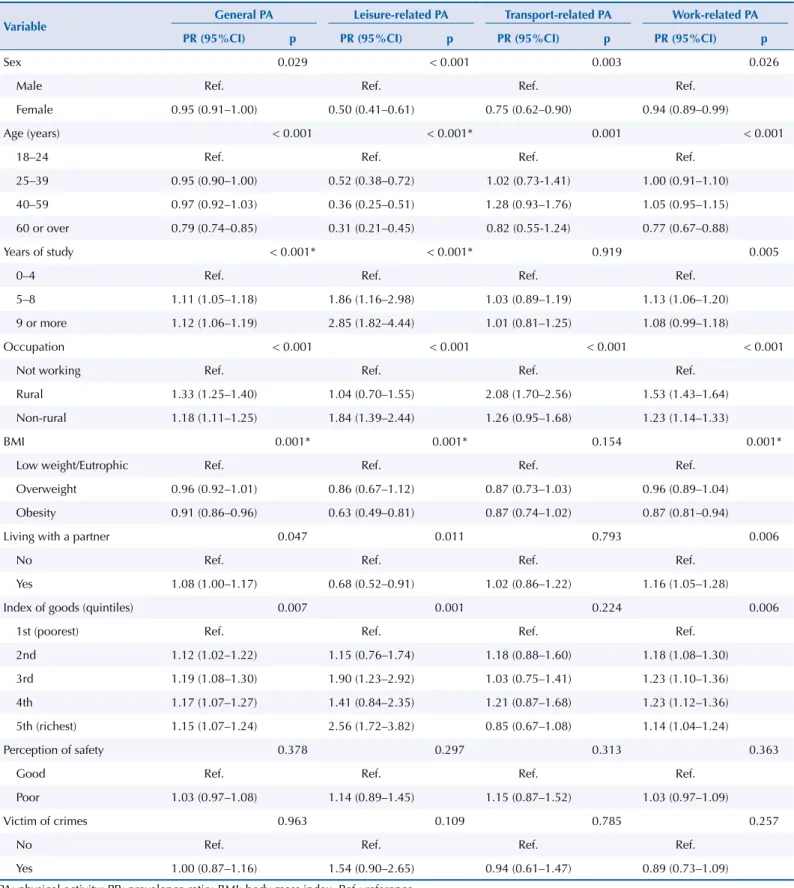
Table 3. Crude analysis performed by Poisson regression of the prevalences of physical activity in general and by domains in relation to the independent variables. Pelotas, State of Rio Grande do Sul, Brazil, 2016.
Variable General PA Leisure-related PA Transport-related PA Work-related PA PR (95%CI) p PR (95%CI) p PR (95%CI) p PR (95%CI) p
Sex 0.029 < 0.001 0.003 0.026
Male Ref. Ref. Ref. Ref.
Female 0.95 (0.91–1.00) 0.50 (0.41–0.61) 0.75 (0.62–0.90) 0.94 (0.89–0.99)
Age (years) < 0.001 < 0.001* 0.001 < 0.001
18–24 Ref. Ref. Ref. Ref.
25–39 0.95 (0.90–1.00) 0.52 (0.38–0.72) 1.02 (0.73-1.41) 1.00 (0.91–1.10)
40–59 0.97 (0.92–1.03) 0.36 (0.25–0.51) 1.28 (0.93–1.76) 1.05 (0.95–1.15)
60 or over 0.79 (0.74–0.85) 0.31 (0.21–0.45) 0.82 (0.55-1.24) 0.77 (0.67–0.88)
Years of study < 0.001* < 0.001* 0.919 0.005
0–4 Ref. Ref. Ref. Ref.
5–8 1.11 (1.05–1.18) 1.86 (1.16–2.98) 1.03 (0.89–1.19) 1.13 (1.06–1.20)
9 or more 1.12 (1.06–1.19) 2.85 (1.82–4.44) 1.01 (0.81–1.25) 1.08 (0.99–1.18)
Occupation < 0.001 < 0.001 < 0.001 < 0.001
Not working Ref. Ref. Ref. Ref.
Rural 1.33 (1.25–1.40) 1.04 (0.70–1.55) 2.08 (1.70–2.56) 1.53 (1.43–1.64)
Non-rural 1.18 (1.11–1.25) 1.84 (1.39–2.44) 1.26 (0.95–1.68) 1.23 (1.14–1.33)
BMI 0.001* 0.001* 0.154 0.001*
Low weight/Eutrophic Ref. Ref. Ref. Ref.
Overweight 0.96 (0.92–1.01) 0.86 (0.67–1.12) 0.87 (0.73–1.03) 0.96 (0.89–1.04)
Obesity 0.91 (0.86–0.96) 0.63 (0.49–0.81) 0.87 (0.74–1.02) 0.87 (0.81–0.94)
Living with a partner 0.047 0.011 0.793 0.006
No Ref. Ref. Ref. Ref.
Yes 1.08 (1.00–1.17) 0.68 (0.52–0.91) 1.02 (0.86–1.22) 1.16 (1.05–1.28)
Index of goods (quintiles) 0.007 0.001 0.224 0.006
1st (poorest) Ref. Ref. Ref. Ref.
2nd 1.12 (1.02–1.22) 1.15 (0.76–1.74) 1.18 (0.88–1.60) 1.18 (1.08–1.30)
3rd 1.19 (1.08–1.30) 1.90 (1.23–2.92) 1.03 (0.75–1.41) 1.23 (1.10–1.36)
4th 1.17 (1.07–1.27) 1.41 (0.84–2.35) 1.21 (0.87–1.68) 1.23 (1.12–1.36)
5th (richest) 1.15 (1.07–1.24) 2.56 (1.72–3.82) 0.85 (0.67–1.08) 1.14 (1.04–1.24)
Perception of safety 0.378 0.297 0.313 0.363
Good Ref. Ref. Ref. Ref.
Poor 1.03 (0.97–1.08) 1.14 (0.89–1.45) 1.15 (0.87–1.52) 1.03 (0.97–1.09)
Victim of crimes 0.963 0.109 0.785 0.257
No Ref. Ref. Ref. Ref.
Yes 1.00 (0.87–1.16) 1.54 (0.90–2.65) 0.94 (0.61–1.47) 0.89 (0.73–1.09)
DISCUSSION
The prevalence of physically active individuals found in rural areas was high (83.7%), that is, more than four fifths of the population performed at least 150 minutes of moderate to vigorous PA per week. However, there is a large difference between domain prevalence. Age, years of study, and occupation were the variables associated with general PA. Work-related physical activities are the main responsible for this high percentage of general PA. This result highlights only one of the several differences between rural and urban populations, as
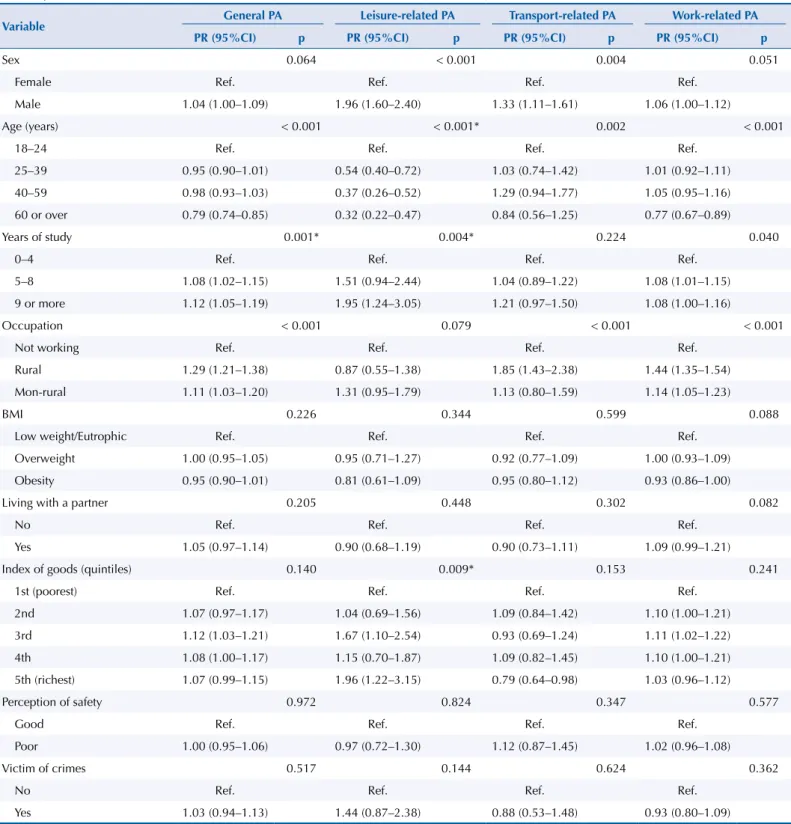
work-related PA in urban areas is an increasingly uncommon habit14,15. The variables that remained Table 4. Adjusted analysis performed by Poisson regression of the prevalences of physical activity in general and by domains in relation to the independent variables. Pelotas, State of Rio Grande do Sul, Brazil, 2015.
Variable General PA Leisure-related PA Transport-related PA Work-related PA PR (95%CI) p PR (95%CI) p PR (95%CI) p PR (95%CI) p
Sex 0.064 < 0.001 0.004 0.051
Female Ref. Ref. Ref. Ref.
Male 1.04 (1.00–1.09) 1.96 (1.60–2.40) 1.33 (1.11–1.61) 1.06 (1.00–1.12)
Age (years) < 0.001 < 0.001* 0.002 < 0.001
18–24 Ref. Ref. Ref. Ref.
25–39 0.95 (0.90–1.01) 0.54 (0.40–0.72) 1.03 (0.74–1.42) 1.01 (0.92–1.11)
40–59 0.98 (0.93–1.03) 0.37 (0.26–0.52) 1.29 (0.94–1.77) 1.05 (0.95–1.16)
60 or over 0.79 (0.74–0.85) 0.32 (0.22–0.47) 0.84 (0.56–1.25) 0.77 (0.67–0.89)
Years of study 0.001* 0.004* 0.224 0.040
0–4 Ref. Ref. Ref. Ref.
5–8 1.08 (1.02–1.15) 1.51 (0.94–2.44) 1.04 (0.89–1.22) 1.08 (1.01–1.15)
9 or more 1.12 (1.05–1.19) 1.95 (1.24–3.05) 1.21 (0.97–1.50) 1.08 (1.00–1.16)
Occupation < 0.001 0.079 < 0.001 < 0.001
Not working Ref. Ref. Ref. Ref.
Rural 1.29 (1.21–1.38) 0.87 (0.55–1.38) 1.85 (1.43–2.38) 1.44 (1.35–1.54)
Mon-rural 1.11 (1.03–1.20) 1.31 (0.95–1.79) 1.13 (0.80–1.59) 1.14 (1.05–1.23)
BMI 0.226 0.344 0.599 0.088
Low weight/Eutrophic Ref. Ref. Ref. Ref.
Overweight 1.00 (0.95–1.05) 0.95 (0.71–1.27) 0.92 (0.77–1.09) 1.00 (0.93–1.09)
Obesity 0.95 (0.90–1.01) 0.81 (0.61–1.09) 0.95 (0.80–1.12) 0.93 (0.86–1.00)
Living with a partner 0.205 0.448 0.302 0.082
No Ref. Ref. Ref. Ref.
Yes 1.05 (0.97–1.14) 0.90 (0.68–1.19) 0.90 (0.73–1.11) 1.09 (0.99–1.21)
Index of goods (quintiles) 0.140 0.009* 0.153 0.241
1st (poorest) Ref. Ref. Ref. Ref.
2nd 1.07 (0.97–1.17) 1.04 (0.69–1.56) 1.09 (0.84–1.42) 1.10 (1.00–1.21)
3rd 1.12 (1.03–1.21) 1.67 (1.10–2.54) 0.93 (0.69–1.24) 1.11 (1.02–1.22)
4th 1.08 (1.00–1.17) 1.15 (0.70–1.87) 1.09 (0.82–1.45) 1.10 (1.00–1.21)
5th (richest) 1.07 (0.99–1.15) 1.96 (1.22–3.15) 0.79 (0.64–0.98) 1.03 (0.96–1.12)
Perception of safety 0.972 0.824 0.347 0.577
Good Ref. Ref. Ref. Ref.
Poor 1.00 (0.95–1.06) 0.97 (0.72–1.30) 1.12 (0.87–1.45) 1.02 (0.96–1.08)
Victim of crimes 0.517 0.144 0.624 0.362
No Ref. Ref. Ref. Ref.
Yes 1.03 (0.94–1.13) 1.44 (0.87–2.38) 0.88 (0.53–1.48) 0.93 (0.80–1.09)
associated with PA after adjustment were sex, age, years of study, and occupation. Leisure
is a social practice potentially responsible for improving the quality of life because of its physiological health benefits and reduced mortality16,17. However, in the leisure domain, only
15.1% of the individuals reached the recommended levels. In this study, only the variables
of sex, age, years of study, and index of goods were associated with leisure-related PA. For transport-related PA, only the variables of sex, age, and occupation were associated.
Data related to the level of PA in the Brazilian population differ greatly by region, city, or area (rural and urban). Data from the 2013 PNS showed a prevalence of 54% of active
individuals, considering both urban and rural environments18. In the urban area of Pelotas,
the prevalence of PA in the four domains has been decreasing (58.9% in 2002, 48.0% in 2007, and 45.6% in 2012)19. In two rural communities of the State of Minas Gerais, Brazil,
the prevalence was 86.5%9. Although the population of Pelotas lives in a common location, the frequency of PA of the rural inhabitants was much more similar to the frequency of the rural inhabitants of Minas Gerais, which indicates that urban-rural differences are more marked than regional differences in Brazil. Two studies, one in Sri Lanka and the
other in Malaysia19,20, confirm this hypothesis. The rural population, in general, presents higher values of PA than the urban population. This usually happens because work is
extremely manual and active. Considering that persons should practice PA in order to
improve their quality of life, for pleasure and leisure – in addition to energy expenditure
–, the promotion and encouragement of leisure practices, the creation of suitable places for this end, and the availability of professionals who encourage this practice is extremely important in rural areas.
A study carried out in India using the GPAQ has shown prevalence of PA in the urban and rural areas of 35% and 50%, respectively22. Another study carried out in Bangladesh has shown a higher prevalence of transport-related PA in the urban area and work-related PA in the rural area; the prevalence of leisure-related PA was extremely low both in urban and rural areas (< 3%)23. A great potential of the GPAQ is the greater comparability between studies. In 2017, the questionnaire was used in a Brazilian survey, for example24. The prevalence of PA mentioned in this paragraph exemplifies the wide use of the GPAQ in various contexts and emphasizes that the differences found are potentially specific to local realities and less
susceptible to problems related to measurement.
Although the association between PA and sociodemographic factors is well established in the literature, the evidence is mostly from urban studies. Exclusive evidence from rural
populations is still needed because of the large social, cultural, and economic differences
between these contexts. In our study, men were more active than women in leisure and transport. In rural areas of the United States (USA), women are more active than men, which
is an important difference in relation to our findings25. In rural Bangladesh, a low-middle
income country, males are more active than females in relation to general PA (mean of 1,934 minutes and 653 minutes, respectively)26. The lack of an association between sex and work-related PA was probably because both women and men work actively using manual labor in rural areas. Therefore, there is no consensus in the literature regarding PA in the rural population, especially in Brazil, whose regions differ in many respects. In addition, we have no population-based study on physical activity in the southern area of the country and
only one study in Brazil, which hindered comparability.
We identified that individuals whose occupation involved some rural work did more
PA in the domains of work, transport, and general. Only 12.8% of those who had rural
work practiced leisure-related PA. This can be explained by the intense labor that rural
workers perform, resulting in inactive leisure activities27. It is important to note that the
health of the rural worker should be given special attention, since regular work happens at a faster pace, often occupying more than half of the day, in addition to this population being exposed to agrochemicals, machinery, and solar radiation28,29. These characteristics of intense work in the field can cause health problems such as skin cancer, gonalgia, and
Physical activity is determined by several factors, such as the social environment. The
two variables related to crime were selected to be part of the model because violence is increasing in rural areas32. However, the perception of crime safety and victimization were not associated with any of the outcomes. The low prevalence of participants who reported
feeling unsafe in the rural area of Pelotas resulted in a small sample size for these analyses.
Thus, the sample may have been insufficient to identify the association. Individuals in the
urban area feel more unsafe than residents of the rural area and they use more resources
to protect their homes (extra locks, security bars, alarms). Nevertheless, robberies and burglaries, whether or not they are effective, and physical assaults have increased in both
urban and rural areas32. In addition, a study carried out in the urban area of Pelotas has
found no association between perceived crime safety and PA in adults33. If it was not due to
a random error, some hypotheses may explain this lack of association, as active transport
is often not a matter of choice and the pleasure of practicing leisure-related PA is greater
than insecurity, or this practice occurs far from the place of residence34.
This study has some limitations. Among them, there is the possibility of reverse causality between the outcome and BMI, because of the cross-sectional design. The crime questionnaire
has not been validated in the Brazilian rural population, but it was adapted from the version used in studies in the urban area of Pelotas33. In the same way, the so-called asphalt bias may have affected the study, since we selected the houses that were closer to more streets, and fewer houses were likely selected in areas farthest from each center of the tract. Thus, we may have underestimated the level of transport-related PA, since the individual who lives far away probably does not travel on foot. However, the domains of work and leisure
do not change with asphalt bias because they are independent of the individual’s place of residence. Another limitation refers to the distribution of losses and refusals, since 64% were male. As men were more active than women, this limitation may have underestimated the percentages of PA.
In addition to the aforementioned factors, the difficult in understanding the questionnaire
and the measurement of the time of PA by the interviewees can also be considered a weakness
of this study. However, a repeatability and concurrent validity study of the GPAQ performed
in the city of Arroio do Padre, a predominantly rural city recently emancipated from Pelotas,
has shown that the main limitations of the questionnaire refer to individuals who report a
high practice of PA – approximately 400 minutes or more per week35. In our study, as the main
interest was to identify and describe the participants who reach the recommendations of 150
minutes of PA per week, the application of this questionnaire can be considered adequate.
We can also identify strengths in this study. First, this is a population-based study with a large
sample size. In addition, there are few studies on PA in individuals living in rural areas around the world, with only one prevalence study in Brazil9. Furthermore, the questionnaire used (GPAQ) is recommended by the World Health Organization (WHO); that is, several studies
worldwide use it to determine the prevalence of PA, which increases the comparability of this study.
In conclusion, the prevalence of active individuals in general was high and mostly practiced
at work. On the other hand, leisure activities were less practiced (15.1%). These values show
that neither the level of physical activity nor its associated factors found in urban areas can be extrapolated to the rural area of the same city. Our results are essential for the proposal
of contextualized strategies, which encourage leisure practices and promote quality of life
in the rural population.
REFERENCES
2. Sallis JF, Bull F, Guthold R, Heath GW, Inoue S, Kelly P, et al. Progress in physical activity over the Olympic quadrennium. Lancet. 2016;388(10051):1325-36. https://doi.org/10.1016/S0140-6736(16)30581-5
3. World Health Organization. Global recommendations on physical activity for health. Geneva: WHO; 2010 [cited 2018 Feb 13]. Available from: http://www.who.int/dietphysicalactivity/ publications/9789241599979/en/
4. Kohl HW 3rd, Craig CL, Lambert EV, Inoue S, Alkandari JR, Leetongin G, et al. The pandemic of physical inactivity: global action for public health. Lancet. 2012;380(9838):294-305. https://doi.org/10.1016/S0140-6736(12)60898-8
5. United Nations, Department of Economic and Social Affairs, Population Division. World urbanization prospects: the 2014 revision: highlights. New York: UNDESA; c2014 [cited 2018 May 8]. (ST/ESA/SER.A/352). Available from: https://esa.un.org/unpd/wup/publications/files/ wup2014-highlights.pdf
6. Instituto Brasileiro de Geografia e Estatística. Censo Demográfico 2010. Rio de Janeiro: IBGE; 2010 [cited 2018 Feb 13]. Available from: https://www.censo2010.ibge.gov.br/
7. Bauman AE, Reis RS, Sallis JF, Wells JC, Loos RJF, Martin BW. Correlates of physical activity: why are some people physically active and others not? Lancet. 2012;380(9838):258-71. https://doi.org/10.1016/S0140-6736(12)60735-1
8. Instituto Brasileiro de Geografia e Estatística. Pesquisa Nacional de Saúde 2013 (PNS): percepção do estado de saúde, estilos de vida e doenças crônicas: Brasil: Grandes Regiões e Unidades da Federação. Rio de Janeiro: IBGE; MS; 2014 [cited 2018 Feb 13]. Available from: ftp://ftp.ibge.gov.br/PNS/2013/pns2013.pdf
9. Bicalho PG, Hallal PC, Gazzinelli A, Knuth AG, Velásquez-Meléndez G. Atividade física e fatores associados em adultos de área rural em Minas Gerais, Brasil. Rev Saude Publica.
2010;44(5):884-93. https://doi.org/10.1590/S0034-89102010005000023
10. Barros AJD, Hirakata VN. Alternatives for logistic regression in cross-sectional studies: an empirical comparison of models that directly estimate the prevalence ratio. BMC Med Res Methodol. 2003;3:21. https://doi.org/10.1186/1471-2288-3-21
11. Victora CG, Huttly SR, Fuchs SC, Olinto MTA. The role of conceptual frameworks in epidemiological analysis: a hierarchical approach. Int J Epidemiol. 1997;26(1):224-7. https://doi.org/10.1093/ije/26.1.224
12. Bauman AE, Reis RS, Sallis JF, Wells JC, Loos RJF, Martin BW. Correlates of physical activity: why are some people physically active and others not? Lancet. 2012;380(9838):258-71. https://doi.org/10.1016/S0140-6736(12)60735-1
13. Gonçalves H, Tomasi E, Tovo-Rodrigues L, Bielemann RM, Machado AKF, Ruivo ACO, et al. Estudo de base populacional na zona rural: metodologia e desafios. Rev Saude Publica. 2018;52 Supl 1:3s. https://doi.org/10.11606/S1518-8787.2018052000270
14. Knuth AG, Hallal PC. Temporal trends in physical activity: a systematic review. J Phys Act Health.
2009;6(5):548-59. https://doi.org/10.1123/jpah.6.5.548
15. Borodulin K, Harald K, Jousilahti P, Laatikainen T, Männistö S, Vartiainen E. Time trends in physical activity from 1982 to 2012 in Finland. Scand J Med Sci Sports. 2016;26(1):93-100. https://doi.org/10.1111/sms.12401
16. Feeny D, Garner R, Bernier J, Thompson A, McFarland BH, Huguet N, et al. Physical activity matters: associations among body mass index, physical activity and health-related quality of life trajectories over 10 years. J Phys Act Health. 2014;11(7):1265-75. https://doi.org/10.1123/jpah.2012-0268
17. Lee D, Pate RR, Lavie CJ, Sui X, Church TS, Blair SN. Leisure-time running reduces all-cause and cardiovascular mortality risk. J Am Coll Cardiol. 2015;64(5):472-81. https://doi.org/10.1016/j.jacc.2014.04.058
18. Mielke GI, Hallal PC, Rodrigues GBA, Szwarcwald CL, Santos FV, Malta DC. Prática de atividade física e hábito de assistir à televisão entre adultos no Brasil: Pesquisa Nacional de Saúde 2013. Epidemiol Serv Saude. 2015;24(2):277-86. https://doi.org/10.5123/S1679-49742015000200010
20. Katulanda P, Jayawardena R, Jayawardana R, Ranasinghe P, Rezvi Sheriff MH, Matthews DR. Physical activity patterns and correlates among adults from a developing country: the Sri Lanka Diabetes and Cardiovascular Study. Public Health Nutr. 2013;16(9):1684-92. https://doi.org/10.1017/S1368980012003990
21. Teh CH, Lim KK, Chan YY, Lim KH, Azahadi O, Hamizatul Akmar AH, et al. The prevalence of physical activity and its associated factors among Malaysian adults: findings from the National Health and Morbidity Survey 2011. Public Health. 2014;128(5):416-23. https://doi.org/10.1016/j.puhe.2013.10.008
22. Anjana RM, Pradeepa R, Das AK, Deepa M, Bhansali A, Joshi SR, et al. Physical activity and inactivity patterns in India: results from the ICMR-INDIAB study (Phase-1) [ICMR-INDIAB-5]. Int J Behav Nutr Phys Act. 2014;11(1):26. https://doi.org/10.1186/1479-5868-11-26
23. Moniruzzaman M, Ahmed MSA, Zaman MM. Physical activity levels and associated socio-demographic factors in Bangladeshi adults: a cross-sectional study. BMC Public Health.
2017;17:59. https://doi.org/10.1186/s12889-016-4003-z
24. Silva ICMS, Mielke GI, Bertoldi AD, Arrais PSD, Luisa VL, Mengue SS, et al. Overall and leisure-time physical activity among Brazilian adults: National Survey Based-on the Global Physical Activity QuestiBased-onnaire. J Phys Act Health. 2018 Feb 7:1-7. https://doi.org/10.1123/jpah.2017-0262
25. Hart PD. Sex differences in the physical inactivity and health-related quality of life relationship among rural adults. Health Promot Perspect. 2016;6(4):185-9. https://doi.org/10.15171/hpp.2016.30
26. Moniruzzaman M, Mostafa Zaman M, Islalm MS, Ahasan HAMN, Kabir H, Yasmin R. Physical activity levels in Bangladeshi adults: results from STEPS survey 2010. Public Health; 2016;137:131-8. https://doi.org/10.1016/j.puhe.2016.02.028
27. Glaner MF. Nível de atividade física e aptidão física relacionada à saúde em rapazes rurais e urbanos. Rev Paul Educ Fis. 2002;16(1):76-85. https://doi.org/10.11606/issn.2594-5904.rpef.2002.138701
28. Faria NMX, Facchini LA, Fassa AG, Tomasi E. Processo de produção rural e saúde na serra gaúcha: um estudo descritivo. Cad Saude Publica. 2000;16(1):115-28. https://doi.org/10.1590/S0102-311X2000000100012
29. Cezar-Vaz MR, Bonow CA, Piexak DR, Kowalczyk S, Vaz JC, Borges AM. Skin cancer in rural workers: nursing knowledge and intervention. Rev Esc Enferm USP. 2015;49(4):563-70. https://doi.org/10.1590/S0080-623420150000400005
30. Silva MC, Fassa AG, Domingues MR, Kriebel D. Gonalgia entre trabalhadores e fatores ocupacionais associados: uma revisão sistemática. Cad Saude Publica. 2007;23(8):1763-75. https://doi.org/10.1590/S0102-311X2007000800003
31. Faria NMX, Facchini LA, Fassa AG, Tomasi E. Estudo transversal sobre saúde mental de agricultores da Serra Gaúcha (Brasil). Rev Saude Publica. 1999;33(4):391-400. https://doi.org/10.1590/S0034-89101999000400011
32. Scorzafave LG, Justus M, Shikida PFA. Safety in the global south: criminal victimization in Brazilian rural areas. J Rural Stud. 2015;39:247-61. https://doi.org/10.1016/j.jrurstud.2014.12.002
33. Mendes MA, Silva ICM, Hallal PC, Tomasi E. Physical activity and perceived insecurity from crime in adults: a population-based study. PLoS One. 2014;9(9):e108136. https://doi.org/10.1371/journal.pone.0108136
34. Foster S, Giles-Corti B. The built environment, neighborhood crime and constrained physical activity: an exploration of inconsistent findings. Prev Med. 2008;47(3):241-51. https://doi.org/10.1016/j.ypmed.2008.03.017
35. Martins RC, Blumenberg S, Silva IMC. Reliability and concurrent validity of the Global Physical Activity Questionnaire in adults from a Brazilian rural área. Rev Bras Ativ Fis Saúde. 2018. No prelo.
Funding: Programa de Excelência Acadêmica da Coordenação de Aperfeiçoamento de Pessoal de Nível Superior (PROEX/CAPES – Process 23038.002445/2015-97, benefit number 1012/2015).
Authors’ Contribution: Design and planning of the study: RCM, PCH. Collection, analysis, and interpretation of the data: RCM. Preparation or review of the study: RCM, ICMS, PCH. All authors have approved the final version of the study and assume public responsibility for its content.