Artigo
*e-mail: gaowei@ynnu.edu.cn
MOLECULAR DESCRIPTION OF COPPER (I) OXIDE AND COPPER (II) OXIDE
Wei Gaoa,*, Muhammad Imran,b,c Muhammad Kamran Siddiquib,d, Muhammad Naeeme and Farrukh Jamilf aSchool of Information Science and Technology, Yunnan Normal University, Kunming, 650500, China
bDepartment of Mathematical Sciences, United Arab Emirates University, P. O. Box 15551, Al Ain, United Arab Emirates cDepartment of Mathematics, School of Natural Sciences, National University of Sciences and Technology, Sector H-12, Islamabad, 44000, Pakistan
dDepartment of Mathematics, COMSATS University Islamabad, Sahiwal Campus, 57000, Pakistan eDepartment of Mathematics, The University of Lahore, Pakpattan Campus, 57400 Pakistan fDepartment of Biosciences, COMSATS University Islamabad, Sahiwal Campus, 57000, Pakistan
Recebido em 14/03/2018; aceito em 30/05/2018; publicado na web em 12/07/2018
The topological index of a molecular structure correlate certain physicochemical properties such as boiling point and stability of that molecular structure. Recently several topological indices have been introduced and studies have shown their association with certain physical and chemical properties of other molecules. Specifically, Zagreb, Atom-bound connectivity (ABC) and Sanskruti indices have been correlated with extent of branching, enthalpy and entropy of some organic molecules. In this study we have calculated Zagreb, Atom-bound connectivity (ABC) and Sanskruti indices (S) for Copper (I) oxide andCopper (II) oxide CuO.Additionally, from the experimentally available data, we calculated entropy and enthalpy per unit cell for both the oxides and compared with Atom-bound connectivity and Sanskruti indices. It appears that these indices have very poor relation with these physical properties in both oxides of copper and they may need some modifications to show considerable compliance as reported in other organic molecules.” Keywords:molecular graphs; zagreb indices; atom-bound connectivity index; sanskruti index; copper oxide.
INTRODUCTION
“A graph that shows constituents of a molecule and their connectivity is known as molecular graph and such representation is usually referred as topological representation of molecule.1 Molecular graphs
“are usually characterized by different topological indices for correlation of chemical structure of a molecule with biological, chemical or physical properties. Studies have reported several applications of different topological indices in quantitative structure-activity relationship (QSAR) and quantitative structure-property relationship (QSPR), virtual screening and computational drug designing.2-7
“So far, many different topological indices have been developed, and most of them are only graph descriptors.8-18 Only a few indices have shown their correlation with biological, chemical or physical chemical properties of certain molecules.19-21 For example, Zagreb indices (M1 & M2) were first reported by
Gutman and Trinajestic for the correlation of chemical structure with π electrons.22 However, later M
1and M2 were associated
with extent of branching in a molecule. They are described by equation (1) & (2) for a graph G=(V,E), where V to be the vertex set and E to be the edge set of G. The degree dp of the vertex p is the quantity of edges of G incident with p. The length of a most limited path in a graph G is a distance d(p,q) amongst p and q.”
M1(G) = Σpq∈E(G)(dp + dq) (1)
M2(G) = Σpq∈E(G)(dp⋅ dq) (2) “Another topological index is atom-bound connectivity (ABC) that was introduced by Estrada et al.23,24 Later, studies have reported its exceptional correlation with thermodynamic
properties of organic molecules, specifically with heat of formation of alkanes. This index is characterized by Equation (3) considering the graph similar to Zagreb indices”
(3)
“Another molecular descriptor that was correlated with thermodynamic properties is Sankruti index. This index was introduced in 2016 by S. M. Hosamani and it shows considerable correlation with entropy of some organic molecules.25 It is characterized as equation (4) considering the above mentioned graph conditions”
(4)
“This study is designed to calculate Zagreb, ABC and Sanskruti indices for two oxides of Cu (CuO & Cu2O). It will allow us to compare these indices with the experimentally determined entropy, enthalpy and other physical properties of
CuO and Cu2O.”
THEORY AND METHODS
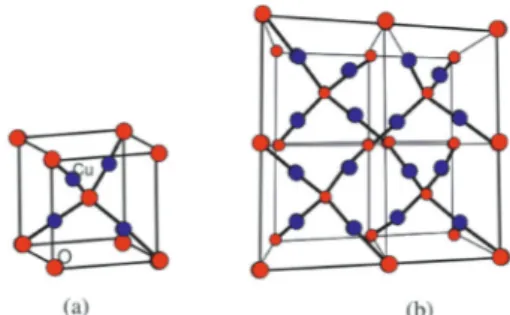
Structure of copper (I) oxide(Cu2O)
Cu2O is a naturally occurring reddish ore that is mainly used in chemical sensors, solar oriented cells, photo-catalysis and batteries.26-28 Crystal structure of Cu
Here, we have considered monolayer of Cu2O for convenience. To determine the indices for Cu2O we choose the settings of this graph as; G ≅ Cu2O[m,n] be the chemical graph of Cu2O with (m × n) unit cells in the plane. More preciously, m represents the number of unit cells in row and nrepresents the number of unit cells in column. Also for our convenience we represents Cu2O[m,n] as a graph G. The Figure 1(b) is representing Cu2O[2,2]. Also Figure 2 represent one sheet view of Copper(I) oxide Cu2O[4,4]. Computational analysis showed that the quantity of vertices and edges of Cu2O[m,n] are 7mn+2m+2n+2 and 8mn, respectively. In Cu2O[m,n], the number of zero degree vertices is 4, the number of one degree vertices is 4m+4n-4, the number of two degree vertices is 6mn-2m-2n+2 and the number of four degree vertices is mn (Table 1).”
In the next Theorem, we have computed the exact result of first and second Zagreb index for the chemical graph
Cu2O[m, n].”
Theorem 1. “Consider the graph of G ≅ Cu2O[m,n] with m, n ≥ 1, then its first and second Zagreb index is equal to,” M1(G) = 40mn-4m-4n+4
M2(G) = 48mn-8m-8n+8
Proof. “Let G be the crystallographic structure of [m, n].The first Zagreb index is computed as below:”
M1(G) = Σpq∈E(G)(dp + dq)
“M1(G) =(4n+4m-4)(1+2)+(4mn-4n-4m-4)(2+2)+(4mn)(2+4) M1(G) = 40mn-4m-4n+4.”
“By using Table 1 and Equation 1 the second Zagreb index are computed as below:”
M2(G) = Σpq∈E(G)(dp ⋅ dq)
“M2(G) = (4m+4n-4)(1×2)+(4mn-4m-4n+4)(2×2)+ (4mn)(2×4) M2(G) = 48mn-8m-8n+8.”
“In the next Theorem, we have computed the exact result of ABC index for the chemical graph Cu2O[m, n].”
Theorem 2. “Consider the graph of G ≅ Cu2O[m,n] with m, n ≥ 1, then its ABC index is equal to,”
ABC(G) = 4√2 (mn – 1)
Proof. “Let G be the chemical graph of Cu2O[m,n]. Then by using Table 1 and equation (3) the ABC index is computed as below:”
“The Table 2 shows partition of edges of the chemical graph Cu2O[m,n] depending on the sum of degrees of the neighbouring vertices of end vertices of each edge.”
“The next Theorem shows the exact value of Sanskruti index of Cu2O[m,n].”
Theorem 3. “Consider the graph G ≅ Cu2O[m,n]with m, n ≥ 2, then its Sanskruti index S(G) is equal”
Proof. “Let G be the crystallographic structure of Cu2O[m,n]. Then by using Table 2 and equation (4) the Sanskruti index S(G) is computed as follows.”
Figure 1. Copper(I) oxide . A) Unit cell of . B) Three dimensional crys-tal lattice of Cu and O are shown in blue and red spheres, respectively
Table 1. Degree based partition of edges of Cu2O[m, n] for end vertices of
each edge (Degree based partition edges of Cu2O
(dp, dq ) Frequency (1, 2) 4n + 4m − 4 (2, 2) 4mn − 4n − 4m + 4
(2, 4) 4mn
Figure 2. One sheet view of copper(I) oxide [4, 4]
Table 2. Edge partition of the graph of Cu2O[m, n] with m, n ≥2, based on the
degree sum of vertices lying at unit distance from end vertices of each edge (Sp, Sq ) Frequency
(2, 4) 4m + 4n − 4 (4, 6) 4mn − 4m − 4n + 4 (5, 8) 4n + 4m – 4
Structure of copper(II) oxide (CuO)
The crystal structure of Copper(II) oxide (CuO) is composed on monoclic unit cells (Figure 3a). Here we have considered monolayer of CuO for convenience. To find the indices we choose the settings of this graph as; let G ≅ CuO[m,n]be the chemical graph of CuO with (m × n) unit cells in the plane. The Figure 3b is representing the lattice of CuO[4,4]. Computational analysis showed that number of vertices and edges of CuO[m,n] are 8mn+2m+2n and 12mn, respectively. In CuO[m,n] the number of one degree vertices are 2n, the number of two degree vertices are 2mn+4m+2n, the number of three degree vertices are 4mn-2n and the number of four degree vertices are 2mn-2m.”
In the next Theorem, we have computed the exact value of first and second Zagreb index for the chemical graph CuO[m, n].”
Theorem 4. “Consider the graph of G ∼= CuO[m, n] with m, n ≥ 1, then its first and second Zagreb index is equal to,” M1(G) = 76mn-16m-10n+2
M2(G) = 120mn-48m-32n+16
Proof. “Let G be the crystallographic structure of CuO[m, n]. The first Zagreb index is computed as:
M1(G) = Σpq∈E(G)(dp + dq)
“M1(G) = (2)(1 + 2) + (2n − 2)(1 + 4) + (2n + 2)(2 + 2) + (4mn + 8m − 6)(2 + 3) + (8mn − 8m − 4n + 4)(3 + 4) M1(G) = 76mn − 16m − 10n + 2”
M2(G) = Σpq∈E(G)(dp ⋅ dq)
“M2(G) = (2)(1 ×2) + (2n − 2)(1 ×4) + (2n + 2)(2 ×2) +
(4mn + 8m − 6)(2 ×3) + (8mn − 8m − 4n + 4)(3 ×4) M2(G) = 120mn − 48m − 32n + 16”
“In the next Theorem, we have computed the exact result of ABC index for the chemical graph CuO[m, n].”
Theorem 5. “Consider the graph of G ∼= CuO[m, n] with m, n ≥ 1, then its ABC index is equal to”
Proof. Let G be the chemical graph of CuO[m, n]. Then by using Table 3 and equation (3) the ABC index is computed as below:
“The Table 4 shows partition of edges of the chemical graph CuO[m, n], which depends on the sum of degrees of the neighboring vertices.”
The next Theorem shows the exact value of Sanskruti index of CuO[m, n] .
Figure 3. Copper (II) oxide CuO: (a) is the unit cell with blue and red circles represents copper and oxygen atom, respectively (b) shows the lattice CuO[4, 4]
Table 3. Degree based partition of edges of CuO[m, n], of end vertices of each edge
(dp, dq ) Frequency
(1, 2) 2
(1, 4) 2n − 2
(2, 2) 2n + 2
(2, 3) 4mn + 8m − 6 (3, 4) 8mn − 8m − 4n + 4
Table 4. Edge partition of the graph of CuO[m, n] with m, n ≥ 2
(Sp, Sq) Frequency
(2, 4) 2
(4, 5) 4
(4, 6) 2
(4, 9) 2n−2
(5, 6) 2n+2
(6, 6) 12m−12
(6, 9) 2n−2
(5, 10) 2n−2
(6, 10) 4mn−4m−4n+4
(9, 10) 4n−4
Theorem 6. “Consider the graph G ∼=CuO[m, n] with m, n ≥ 2, then its Sanskruti index S(G) is equal to:”
Proof. Let G be the crystallographic structure of CuO[m, n]. Then by using Table 4 and equation (4) the Sanskruti index S(G) is computed as follows:
RESULTS AND DISCUSSIONS
“In this section we have compared the first (M1) and second Zegrab (M2) indices of Copper(I) oxide Cu2O and Copper(II) oxide CuO which is shown in Table 5. Analysis of the data showed that both the indices are higher in CuO compared to those of . For instance, M1(CuO)/M1() for [1,1] cell is 1.44 and the ratio increases to 1.943 for [7,7] and then it decrease to 1.87 for [10,10] cell. On the other hand, M2(CuO)/M2() for [1,1] is 1.40 and the ratio gradually increases to 2.413 for [10,10] cell.”
“Comparison of ABC indices for both the oxides of Copper showed higher values for CuO compared to those of (Table 6). For example, ratio of ABC(CuO)/ABC() for [2,2] cell is 1.95 and it decreases to 1.44 for [10,10]. This shows its decreasing trend with the increase of cells.”
“In the Table 7, we gave a comparison of the Sanskruti indices of Copper(I) oxide Cu2O and Copper(II) oxide CuO. Analysis of the data showed that host higher Sanskruti index
compared to CuO. The S(CuO)/S() for [2,2] is 3.825 and it increases to 5.34 for [10,10]. This shows its increasing trend with the increase of cells.”
A topological index is a numerical value that is calculate form molecular graph for explaining the relationship of chemical structure with physiochemical properties. So far, several applications of different indices have been reported for organic molecules, such as entropy and enthalpy determination, chirality identification,9 ZE-isomerism10 and heterosystem studies.18 The topological indices can be very helpful for crystalline compounds to correlate their structure with physiochemical properties. Therefore, we have determined Zagreb, ABC and Sunskurti indices for Cu2O and CuO. Additionally, we compared these indices with the physical properties these oxides as described in Pubchem (https:// pubchem.ncbi.nlm.nih.gov/).”
“Zagreb indices (M1 & M2) were initially considered for total energy of π-electrons in organic molecules.12 However, later they were associated with extent of branching in a molecular graph [10,11]. Analyses revealed higher M1 and M2 for CuO compared to those of Cu2O at any cubic level i.e. at any equal value of (m × n) (Table 5). It suggests more branching in CuO compared to Cu2O. It may cause more compact CuO (Density: 6.315 g/cm3) structure compared to Cu2O (6.0 g/cm3). Table 7. Comparison of the Sanskruti indices of Copper(I) oxide Cu2Oand
Copper(II) oxide CuO
[n, m]
Formula
Units S(Cu
2O) S(CuO)
(Entropy)×(10−23) kJ
Cu2O CuO Cu2O CuO
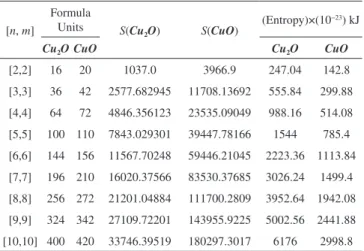
[2,2] 16 20 1037.0 3966.9 247.04 142.8 [3,3] 36 42 2577.682945 11708.13692 555.84 299.88 [4,4] 64 72 4846.356123 23535.09049 988.16 514.08 [5,5] 100 110 7843.029301 39447.78166 1544 785.4 [6,6] 144 156 11567.70248 59446.21045 2223.36 1113.84 [7,7] 196 210 16020.37566 83530.37685 3026.24 1499.4 [8,8] 256 272 21201.04884 111700.2809 3952.64 1942.08 [9,9] 324 342 27109.72201 143955.9225 5002.56 2441.88 [10,10] 400 420 33746.39519 180297.3017 6176 2998.8
Table 5. Comparison of the first and second Zegrab indices of Copper(I) oxide Cu2O and Copper(II) oxide CuO
[n, m] M1(Cu2O) M1(CuO) M2(Cu2O) M2(CuO)
[1,1] 36 52 40 56
[2,2] 148 254 168 336
[3,3] 340 608 392 856
[4,4] 612 1114 712 1616
[5,5] 964 1772 1128 2616
[6,6] 1396 2582 1640 3856
[7,7] 1908 3544 2248 5336
[8,8] 2500 4858 2952 7056
[9,9] 3172 5924 3752 9016
[10,10] 3924 7342 4648 11216
Table 6. Comparison of the ABC index of Copper(I) oxide Cu2Oand
Copper(II) oxide CuO
[n, m] Formula Units ABC ABC
(Heat of formation) × (10)−23 kJ
Cu2O CuO Cu2O CuO Cu2O CuO
Moreover, higher melting point of CuO (1599 K) compared to that of Cu2O (1505 K) may also be associated to the higher branching.”
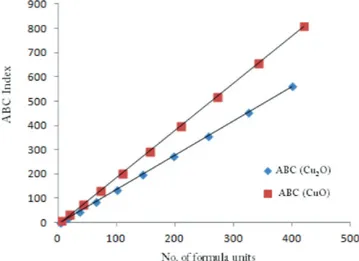
“ABC indices of Cu2Oand CuOwere calculated at different unit cells as shown in Table 6. Analysis of the data showed higher ABC indices for CuOcompared to those of Cu2O(Table 6). Figure 4 shows that ABC indices increase exponentially with number of cells (m × n) for both the oxides of copper. On the other hand, a linear relation of ABC index was observed with formula units (Figure 5). Since, ABC index has previously been linked with the thermodynamic properties” of different alkanes,7,11 “therefore, we determined the heat of formation per different units cells of both the oxides from the reported real molar enthalpy of formations (Table 6). For example, experimental molar enthalpy for CuO is -156 kJ mol-1 so for one formula unit it will be -156/6.022×10-23kJ. The obtained value then multiplied with the number of formula units present in each cell to get the enthalpy for the cell. Similarly, enthalpy for Cu2O calculated considering standard molar enthalpy -170 kJ mol-1 (Table 6). Analysis of the data showed that ABC index is not strongly associated with enthalpy of formation for the oxides of copper as reported in case of alkanes.6,13” Therefore we determined a mathematical relationship, by using equation generator (http://www.1728.org/threepts.htm), between the ABC indices and the heat of formation of both the oxides of copper as below:
Heat of formation for Cu2O = [{3.045 × 10
-6(ABC)2} + {19.95(ABC)} + 112] × 10-23
Heat of formation for CuO = [{3.75 × 10⁻⁴(ABC)2} + {13.67(ABC)} + 60.17] × 10-23
These equations can be used for the transformation of ABC indices into the approximate heat of formation of the oxides of Cu at any cubic level.
Figure 6 shows a linear relation of Sanskruti indices with number of formula units and analysis showed higher indices for Cu2Ocompared to CuO. Previous studies have shown an association of Sanskruti indices with entropy of octance.15 Here we calculated the entropy of both the oxides at different cells from the standard molar entropy. For instance, standard molar entropy for CuOis 93 J mol-1 K-1 so for one formula unit it will be 93/6.022×10-23 J K-1, and for each cell we just multiplied the obtained value with the no. of formula units present in the cell. Similarly entropy for Cu2O calculated considering standard molar entropy 43 J mol-1 K-1 (Table 7). Analysis of the data showed a considerable difference between the Sanskruti indices and entropies for the oxides of Cu (Table 7). Therefore, we determined a mathematical relation for the transformation of Sanskruti indices into approximate entropies of both the oxides of copper as below:
Entropy of Cu2O = [{-2.89 × 10⁻⁷(S)2} + {0.1913 (S)} + 48.89] ×10-23
Entropy of CuO = [{-1.081 × 10⁻⁸(S)2} + {0.1819 (S)} + 70.82] ×10-23
CONCLUSIONS
In conclusion, ABC and Sanskuriti indices of Cu2Oand
CuO showed considerable difference with the experimentally reported entropy and enthalpy of these oxides. On the other hand, Zagreb index and all these indices showed exponential
increase with the number of unit cells. On the other hand, these indices showed a linear behavior with number of formula units, suggesting that we may need a slight transformation of these indices for better explanation of physical properties of crystalline compounds.”
Figure 6. Sanskrit indices of Cu2O and CuO showing linear increase with number of formula units (at x-axis)
Figure 5. ABC indices of Cu2O and CuO showing linear increase with number of formula units (at x-axis)
ACKNOWLEDGEMENTS
The authors are grateful to the anonymous referees for their valuable comments and suggestions that improved this paper. This research is supported by the Start-up Research Grant 2016 of United Arab Emirates University (UAEU), Al Ain, and United Arab Emirates via Grant No. G00002233 and UPAR Grant of UAEU via Grant No. G00002590.
REFERENCES
1. Babujee, J. B.; Applied Mathematical Sciences2012, 6, 5383. 2. Baig, A. Q.; Imran, M.; Khalid, W.; Naeem, M.; Can. J. Chem.2017,
95, 674.
3. Gao, W.; Siddiqui, M. K.; Imran, M.; Jamil, M. K.; Farahani, M. R.;
Saudi Pharm. J.2016, 24, 258.
4. Cotton, F. A.; Wilkinson, G.; Murillo, C. A.; Bochmann, M.; Advanced Inorganic Chemistry, John Wiley and Sons: Hoboken, 1999.
5. Ekimov, E. A.; Sidorov, V. A.; Bauer, E. D.; Melnik, N. N.; Curro, N. J.; Thompson, J. D.; Nature2004, 428, 5425.
6. Ivanciuc, O.; Curr. Comput. Aided Drug Des.2013, 9, 153.
7. Soleimani, N.; Nikmehr, M. J.; Tavallaee, H. A.; J. Natl. Sci. Found. Sri Lanka 2015, 43, 127.
8. Gutman, I.; Furtula, B.; MATCH Commun. Math. Comput. Chem. 2012,
68, 131.
9. Gutman, I.; Mathematical Chemistry Monographs No. 1, Kragujevac, 2006.
10. Hu, Y.; Li, X.; Shi, Y.; Xu, T.; Gutman, I.; MATCH Commun. Math. Comput. Chem. 2005, 54, 425.
11. Nikoli, S.; Trinajsti, N.; Toli, I. M. In Complexity in Chemistry; Rouvray, D. H., Bonchev D., eds.; Francis and Taylor: London, 2003, p. 29.
12. Randic, M.; J. Am. Chem. Soc.1975, 97, 6609.
13. Ramakrishnan, S.; Senbagamalar, J.; Babujee, J. B.; International Journal of Computing Algorithm2013, 2, 224.
14. Rouvray, D. H.; J. Comput. Chem. 1987, 8, 470.
15. Shegehalli, V. S.; Kanabur, R.; Journal of Mathematics 2016, ID 4341919, doi: 10.1155/2016/4341919.
16. Vukicevic, D.; Furtula, B.; J. Math. Chem. 2009, 46, 1369. 17. Wiener, H.; J. Am. Chem. Soc.1947, 69, 17.
18. Yang, J.; Sun, H.; He, J. L.; Tian, Y.; Chen, C. F. J.; J. Phys.: Condens. Matter2007, 19, 346.
19. Shao, Z.; Wu, P.; Zhang, X.; Dimitrov, D.; Liu, J.; IEEE Access. 2018,
6, 27604.
20. Shao, Z.; Wu, P.; Gao, Y.; Gutman, I.; Zhang, X.; Appl. Math. and Comp. 2017, 315, 298.
21. Gutman, I.; Das, K. C.; MATCH Commun. Math. Comput. Chem. 2004,
50, 83.
22. Gutman, I.; Trinajst, N.; Chem. Phys. Lett. 1972, 17, 535.
23. Estrada, E.; Torres, L.; Rodriguez, L.; Gutman, I.; Ind. J. Chem.1998,
37A, 849.
24. Gao, W.; Baig, A. Q.; Khalid, W.; Farahani, M. R.; Maced. J. Chem. Chem. Eng.2017, 36, 1.
25. Hosamani, S. M.; Journal of Applied Mathematics and Computing2017,
54, 425
26. Chen, K.; Sun, C.; Song. S.; Xue. D.; Cryst. Eng. Commun.2014, 16, 52.
27. Yuhas, B. D.; Yang, P.; J. Am. Chem. Soc. 2009, 131, 3756.
28. Zhang, J.; Liu, J.; Peng, Q.; Wang, X.; Li, Y.; Chem. Mater. 2006, 18, 867.
![Table 4. Edge partition of the graph of CuO[m, n] with m, n ≥ 2](https://thumb-eu.123doks.com/thumbv2/123dok_br/16166493.707376/3.892.444.808.514.737/table-edge-partition-graph-cuo-m-n-m.webp)