INFLUENCE OF COPPER CONTENT ON MICROSTRUCTURE
DEVELOPMENT OF AlSi9Cu3 ALLOY
Z. Zovko Brodarac, N. Dolić, F. Unkić
University of Zagreb, Faculty of Metallurgy, Aleja narodnih heroja 3, 44103 Sisak, Croatia (Received 25 January 2013; accepted 17 March 2014)
Abstract
Microstructure development and possible interaction of present elements have been determined in charge material of EN AB AlSi9Cu3 quality. Literature review enables prediction of solidification sequence. Modelling of equilibrium phase diagram for examined chemical composition has been performed, which enables determination of equilibrium solidification sequence. Microstructural investigation indicated distribution and morphology of particular phase. Metallographic analysis tools enable exact determination of microstructural constituents: matrix αAl, eutectic αAl+βSi, iron base intermetallic phase - Al5FeSi, Alx(Fe,Mn)yCuuSiwand/or Alx(Fe,Mn)yMgzCuuSiwand copper base phases in ternary eutectic morphology Al-Al2Cu-Si and in complex intermetallic ramified morphology Alx(Fe,Mn)yMgzSiuCuw. Microstructure development examination reveals potential differences due to copper content which is prerequisite for high values of final mechanical, physical and technological properties of cast products.
Keywords: Al-Si alloy, copper content, microstructure development, solidification sequence
* Corresponding author: [email protected]
S e c t i o n B : M e t a l l u r g y
DOI:10.2298/JMMB130125009B
1. Introduction
Understanding of microstructure evolution during solidification is of general importance due to requirements inputted in front of mechanical, technological and corrosion properties of material [1]. It depends of many factors such as chemical composition, melt treatment, i.e. grain refinement, eutectic modification, cooling rate and heat treatment [2,3]. Aluminium alloys represent an important material due to their wide range of application in aerospace, automotive and household industries. Alloys from the Al-Si-Cu group have an important role in automotive industry for various motor pistons, cylinder heads, heat exchangers, wheels, transmission housing and suspension components due to their high strength at room and elevated temperatures [1]. Guaranteed chemical composition does not always provide absolute security in casting soundness due to a number of element interactions and technological production parameters applied [4,5].
In this work, microstructure development and
possible interaction of present elements have been determined in charge materials of EN AB AlSi9Cu3 quality. Requirements for chemical composition for cast specimens from charge material, prescribed by norm, are listed in table 1 [6].
Literature review enables determination of assumed solidification sequence of AlSi9Cu3 alloy, shown in table 2 [7,8].
Numerous interactions between influenced elements indicate a range of microstructural constituents [9].
Iron and silicon form intermetallics whose morphology affects feeding, especially in the form of needle-like Al5FeSi phase distributed in interdendritic
and intergranular spaces, which interrupt the matrix and therefore acts as the potential place for fracture [10-12]. Increase of iron content impacts increasing of phase length and decreasing of cooling rate [13]. More appropriate and less harmful morphology is “Chinese script” - Al15(Fe,Mn)3Si2 which occurs in
manganese presence. It does not initiate cracks in cast material as Al5FeSi phase does [7,13].
ELEMENT Si Fe Cu Mn Mg Cr Ni Zn Pb Sn Ti
Small amount of magnesium 0,3-0,7 wt.%, when added favourably influences on mechanical properties due to Mg2Si formation [14,15]. In interaction with iron, silicon and copper, Al5Mg8Si6Cu2 intermetallic
occurs.
Copper dissolved in matrix, increases mechanical properties, while precipitated as continuous network on grain boundaries decreases ductility and increases microporosity [14,16]. Compacted Al2Cu phase, with high copper content, can be found on grain boundaries as the last solidified phase. Besides this, copper phases precipitates as a ternary eutectic cluster in Al8Mg3FeSi2and/or Al5Mg8Si6Cu2form [14,17].
Quality charge materials [18] are the main precondition for sound castings along with melt treatment [2,19] and technological parameters of production process [5]. Microstructural investigation of EN AB AlSi9Cu3 alloy was performed in order to establish microstructural development and features of particular constituents. Obtained evaluation was compared to literature and modelled data to establish average solidification sequence of investigated material. Examined constituents parameters were compared for different producers of charge materials in order to evaluate material quality.
2. Experimental
Charge material samples of EN AB AlSi9Cu3 quality from different suppliers were examined and evaluated. Preliminary, chemical composition of EN AB AlSi9Cu3 alloy samples was established by optical spectrometer ARL-3460. Chemical composition was initial precondition for calculation of equilibrium phase diagram by ThermoCalc (TCW 5.0) programme. Modelling of equilibrium phase diagram for examined chemical composition has been performed, which enables possible interaction and alloy solidification sequence establishment.
Simultaneous thermal analysis (STA) has been performed by the method of differential scanning calorimetry (DSC) by the instrument Netzsch STA
Jupiter by the technique of heating and cooling in order to establish corresponding significant temperatures of the phase transformations and solidification intervals, as well as corresponding enthalpies of particular phases.
Samples for metallographic analysis were prepared by standard procedure of grinding and polishing for aluminum alloys. For revealing the microstructure etching in 0,5% HF was performed. Metallographic analysis was performed on optical microscope Olympus GX51 in order to identify particular microstructural constituents. Sample´s micrographics were acquisitioned by digital camera Olympus DP70, while the analysis was performed by Analysis®MaterialsResearchLab software at different
magnification. Copper phase features and their ratio were determined on five details per sample. Microstructural identification of particular phase was performed by scanning electron microscope Tescan Vega through energy dispersive spectrometry (EDS) investigation. Also, mapping of investigated samples was performed in order to overview the distribution of particular elements through investigated area/phase or detail.
Also, grain size of electrolytically etched samples in Barker reagent was obtained in order to indicate differences related to chemistry deviation.
3. Results and discussion
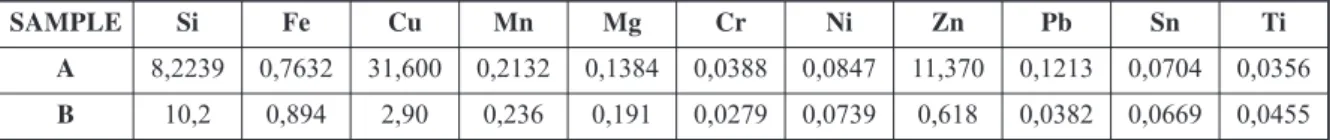
Compared overview of chemical composition for different samples/charge materials of EN AB AlSi9Cu3 alloy is indicated in table 3.
Comparison of chemical composition´s values of both investigated samples did not brought out any deviation from values requested by norm. Copper content is slightly higher in alloy A. Silicon content indicates low boundary value of ~8,2 wt.% in alloy A and high value of ~10,2 wt.% in alloy B. Due to medium contents of copper and some magnesium, formation of Al2Cu and AlxMgyCuzSiw intermetallic
Table 2.Reactions occurring during solidification of AlSi9Cu3 alloy [7,8]
Temperature/°C Reaction Description
1 609 L→αAl Dendrite network development.
2 590 L→αAl+Al15(Fe,Mn)3Si2+Al5FeSi Precipitation of AlMnFe phase.
3 575 L→αAl+βSi+Al15(Fe,Mn)3Si2+Al5FeSi
Main eutectic reaction besides precipitation of MnFe phase.
4 554 L→αAl+βSi+Mg2Si+Al8Mg3FeSi2 Main eutectic reaction besides precipitation of Mg2Si and Al8Mg3FeSi2.
5 525 L→αAl+βSi+Al2Cu+Al5FeSi Precipitation of Al2Cu.
6 507 L→αAl+βSi+Al2Cu+ Al5Mg8Si6Cu2
phases can be predicted. Related to corresponded iron and manganese contents in investigated alloy, formation of Alx(Fe,Mn)ySizphase is indicated. Also, interaction with magnesium could bring out AlxMgyFezSiwphase.
Chemical composition and initial data related to casting condition (Tp=700 °C, p=105Pa) represent an
input for modelling of equilibrium phase diagram for AlSi9Cu3 alloy by programme ThermoCalc.
Modelled equilibrium phase diagram of both AlSi9Cu3 alloy indicates possible solidification sequence in order listed in table 4. Wider diapason of possible developing of complex copper phase has been noticed in B alloy.
Overview of solidification sequence reveals significant differences in temperatures of primary aluminium, iron reach phase and eutectic development and shortening of solidification interval for an alloy B due to higher silicon content. Difference in copper content does not cause different copper reach phases. The final reaction indicates fading of Al7Cu2Mg phase as a solid state transformation.
Applied method of differential scanning calorimetry (DSC) resulted in diagrams of the heating and cooling curves by the rate 0,17 K/s. Cooling curves for both alloy A and B samples are shown in figure 2, respectively.
Diagrams in the figure 2 resulted in exact values of significant temperatures of the phase transformations as follows: nucleation temperature-TN, temperature of the solidification beginning (liquidus temperature)-TL, primary eutectic evaluation temperature-TE as well as secondary co-eutectic phases marked by number as they appear. Double peak related to primary eutectic evolution indicated by first curve derivation represent development of complex multicomponent. Values for both alloys respectively are shown in Table 5.
Significant temperatures of phase transformations for alloy B have been shifted toward higher values maximum for liquidus and solidus temperature (~10°), while most of co-eutectic phases have been developed at similar temperatures. Also, the solidification interval was shorter, respectively. Differences can be attributed to higher silicon content Table 3.Chemical composition of investigated EN AB AlSi9Cu3 alloy samples
Table 4.Solidification sequence of AlSi9Cu3 alloy
SAMPLE Si Fe Cu Mn Mg Cr Ni Zn Pb Sn Ti
A 8,2239 0,7632 31,600 0,2132 0,1384 0,0388 0,0847 11,370 0,1213 0,0704 0,0356
B 10,2 0,894 2,90 0,236 0,191 0,0279 0,0739 0,618 0,0382 0,0669 0,0455
Figure 1.Aluminum corner of equilibrium phase diagram of AlSi9Cu3 alloy: a) Alloy A; b)Alloy B
a)
b)
Reaction
No. Reaction description
Temperatures of modelled reactions per
alloy
A B
1 Dendrite development 606,50 603,85
L→αAl 599,85 580,85
2 L→αAl+Al5FeSi 583,85 568,85
3 L→αAl+βSi+Al5FeSi 559,85 567,85
4
→αAl+βSi+Al7Cu2Mg 501,85 499,85
→αAl+βSi+Al5Mg8Si6Cu2 449,85 455,85
→αAl+βSi+Al2Cu 436,85 418,85
and more intensive eutectic reaction, while difference in copper content do not significantly influenced on co-eutectic temperatures.
Comparative overview of both samples in optical and scanning electron images (SEI) mode is shown in figure 3. Microstructure features for both samples are not similar.
Microstructure investigation reveals further constituent: matrix αAl, eutectic αAl+βSi, intermetallic phase on the iron base mostly needle-like morphology - Al5FeSi, rarely black ramified phase which corresponds to Mg2Si, script formation related to AlxMgyFezSiw, and phase on the copper base Al2Cu and AlxMgyCuzSiw.
Sample A (higher Cu content) reveals larger area of primary aluminium (αAl) and significant amount of platelike hypereutectic silicon, surrounded by eutectic. Copper clusters are precipitated on the grain Figure 2.Simultaneous thermal analysis of the AlMg9 alloy sample by DSC method: a) Alloy A; b) Alloy B
a)
b)
Reaction
No. Temperature description
T / °C
A B
1 Nucleation temperature-TN 611,3 615,8
2 Liquidus temperature-TL 583,1 602,0
3 Development of Fe/Fe+Mn
phases 581,3 567,8
4 Primary eutectic
temperature-TE1 559,0 560,4
5 Co-eutectic temperature-TE2 546,6 546,0
6 Co-eutectic temperature-TE3 499,0 502,4
7 Co-eutectic temperature-TE4 481,9 489,1
8 End of solidification-TS 463,1 476,4
Solidification interval-∆TLS 148,2 139,4 Table 5.Significant temperatures of phase transformations
boundaries, while ramified copper phase is placed in interdendritic spaces. Sample examination through comparison of SEI images confirms distribution of simple clusters of copper phase (Al2Cu) on grain
boundaries as last solidifying phase and complex copper phase with script morphology in interdendritic spaces in early stages of solidification processes. EDS analysis indicate the presence of Al2Cu phase in form
of ternary eutectic Al-Al2Cu-Si and complex intermetallics due to iron and manganese content in the script form of Alx(Fe,Mn)yMgzCuuSiw.
Sample B (lower Cu content) indicates rather more Al5FeSi phase and developed secondary eutectic Al2Cu in cluster morphology finer than in alloy A, and
also in ramified morphology attributed to complex AlxMgyCuuSiw and/or Alx(Fe,Mn)yCuuSiw phase.
Complex copper phases are in this case closely attached to needle-like iron phase. Higher silicon content in this alloy probably initiates a number of complex element interactions occurring.
Secondary dendrite arm spacing determination confirmed visual observation of investigated samples. The SDAS values are listed in table 6.
Bigger secondary dendrite arm spacing in alloy A confirms larger dendrites network which reveals enough space on disposition for eutectic and other multicomponent intermetallic phases development.
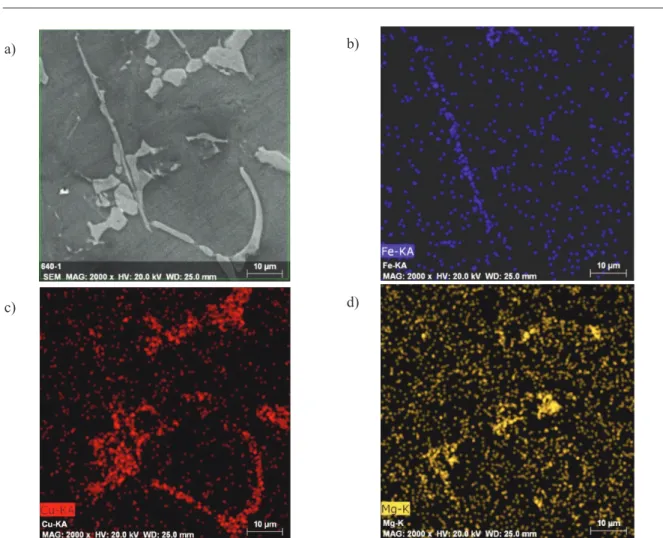
Mapping investigation reveals distribution of particular elements through examined area/phase, as
shown in figure 4.
Mapping analysis indicates precipitation of iron phase in needle-like form Al5FeSi, expected copper
phase Al2Cu and complex intermetallic consists from aluminium, copper and magnesium. Further investigation of phase composition was performed by EDS technique in order to determine copper content in morphologically different phases. Scanning electron images with highlighted investigates spots is shown in Figure 5. and table with chemical composition in Table 7.
Chemical compositions of particular investigated spots are presented in Table 7.
EDS analyses indicate the presence of simple Al2Cu phase in form of ternary eutectic Al-Al2Cu-Si
(spot 2) and complex intermetallics with magnesium AlxMgyCuzSiu(spot 3) with similar copper content and
even more complexed phase due to iron and manganese content in the script form of Alx(Fe,Mn)yMgzCuuSiw (spot 1) with lower but still significant copper content.
Correlation of microstructure development, identification of particular phases by EDS and DSC analyses resulted in solidification sequence of Table 6.SDAS values of AlSi9Cu3 alloy samples.
a) Alloy A; b) Alloy B
Figure 3.Optical micrographics and scanning electron images of EN AB AlSi9Cu3 alloy samples
SAMPLE A B
investigated alloy samples all in accordance to literature review, as shown in Table 8.
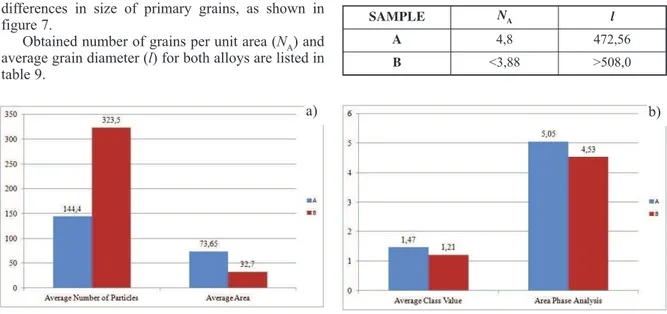
Solidification sequence revealed numerous copper phases’ evolution. Examination of microstructure features comprehends number of particles; particles
size class, elongation and total copper phases ratio all in correlation to copper content. Correlations of average number of copper particles, theirs average area, as well as average class value and phase analyses with copper content are indicated in the Figure 6. Figure 4.Mapping analysis through examined area of AlSi9Cu3 alloy (alloy A): a) SEI; b) Distribution of iron; c)
Distribution of copper; d) Distribution of magnesium a)
c)
b)
Figure 5.Energy dispersive spectrometry investigation of copper phase in scanning electron images of EN AB AlSi9Cu3 alloy A and B samples, respectively
a) b)
Alloy A (higher Cu content) indicates significantly smaller number of particles and therefore bigger in size (average area, µm2) and class value and also
higher average ratio of copper phase in microstructure.
Determination of grain size also indicates differences in size of primary grains, as shown in figure 7.
Obtained number of grains per unit area (NA) and average grain diameter (l) for both alloys are listed in table 9.
Grain size analysis indicates smaller primary grains for alloy A with higher copper content and therefore finer microstructure, as a result of higher number of grains per unit area.
Table 7.Chemical composition of particular phases
Table 8.Solidification sequence of AlSi9Cu3 alloy
Figure 6.Dependence of microstructural features of copper phase from copper content: a) average number and area of copper particles; b) average class value and phase analyses
Table 9.Grain size analyses
a) b)
Element/Aa
Spot 1 Spot 2 Spot 3
Weight ratio/% Atomic ratio/% Weight ratio/% Atomic ratio/% Weight ratio/% Atomic ratio/%
Al 64,61 73,55 47,14 67,35 47,94 67,00
Cu 6,02 3,05 52,12 31,62 49,68 29,48
Fe 20,22 11,71
Si 7,03 8,07 0,75 1,02 0,80 1,07
Mg 0,90 1,90 1,58 2,45
Mn 4,13 2,42
Reaction No. Reaction description Temperature
description
T / °C
A B
1 Dendrite development TN 611,3 615,8
L→αAl TL 583,1 602,0
2 L→αAl+Al5FeSi+ Alx(Fe,Mn)yCuuSiw/
Alx(Fe,Mn)yMgzCuuSiw T1 581,3 567,8
3 L→αAl+βSi+Al5FeSi TE1 559,0 560,4
4
→αAl+βSi+Al7Cu2Mg TE2 546,6 546,0
→αAl+βSi+Al5Mg8Si6Cu2 TE3 499,0 502,4
→αAl+βSi+Al2Cu TE4 481,9 489,1
5 →αAl+βSi+Al2CuMgxSi TS 463,1 476,4
SAMPLE NA l
A 4,8 472,56
4. Conclusion
Microstructural investigation of EN AB AlSi9Cu3 alloy was performed in order to establish microstructural development and influential features of copper base constituents. Obtained evaluation was compared to literature and modelled data to establish average solidification sequence of investigated material. Examined constituents parameters were compared for three different producers of charge materials in order to evaluate material quality. Microstructure evaluation of AlSi9Cu3 resulted in following cognitions:
Modelled equilibrium phase diagram enables solidification sequence prediction. Microstructural investigation of charge material samples by optical and scanning electron microscopy confirms the presence of following phases: primary aluminium evolution (αAl), iron base phases (Al5FeSi, Alx(Fe,Mn)yCuuSiw and/or Alx(Fe,Mn)yMgzCuuSiw), primary eutectic phase (αAl+βSi), secondary eutectic phases in determined order of allocation (Al7Cu2Mg, Al5Mg8Si6Cu2, Al2Cu and finally Al2CuMgxSi).
Microstructural features investigations indicate an increase of the number of copper phase particles, and therefore particle size classification, as well as smaller primary grains with increasing of copper content. Alloy A reveals uniformly distributed copper phases in form of ternary eutectic Al-Al2Cu-Si and script morphology AlxMgyCuzSiw phase, while alloy B shows mixed microstructure consist from cluster and ramified morphology of copper phases.
Quality charge materials are the main precondition for sound castings beside melt treatment and technological parameters of production process.
References
[1] Z. Zovko Brodarac, D. Prerad, B. Dekanić, Proceedings book 12th International Foundrymen Conference, May 24th-25th, Opatija, Croatia, 2012, 471-481
[2] M. Petrič, J. Medved, P. Mrvar, Giessereiforschung, 60 (2) (2008), 26-37
[3] M. Vončina, P. Mrvar, M. Petrič, J. Medved, J. Min. Metall. Sect. B-Metall., 48 (2) B (2012), 265-272 [4] C. T. Rios, R. Caram, Acta Microscopica, 12 (1) (2003),
77-81
[5] M. Petrič, P. Mrvar, J. Medved, M. Vončina, B. Meglič, Livarski vestnik 56 (1) (2009), 18-24
[6] EN 1706:1998 Aluminum and aluminum alloys – Castings – Chemical compositions and mechanical properties
[7] J. E. Martinez, A. M. Cisneros, S. Valtierra, J. Lacaze, Scripta Materialiy 52 (2005), 439-443
[8] L. Backerund, G. Chai, J. Tamminen, Solidification Characteristics of Aluminium Alloys, Volume 2, Foundry Alloys, AFS/Skanaluminium, Stockhlom, 1999.
[9] Z. Zovko Brodarac, B. Dekanić, F. Unkić, K. Terzić, Proceedings book 11th International Foundrymen Conference, April, 28th -29th, Opatija, Croatia, 2011, 404-415
[10] M. O. Otte, S. D. McDonald, J. A. Taylor, D. H. StJohn, Transactions of American Foundrymens Society, 107 (1999), 471-478
[11] C. H. Cáceres, I. L. Svensson, J. A. Taylor, International Journal of Cast Metals Research, 15, (5) (2003), 531-543
[12] S. Shivkumar, C. Keller, M. Trazzera, and D. Apelian, Proceedings of the International Symposium on Production, Refining, Fabrication and Recycling of Light Metals, August, 26th-29th, Hamilton, Ontario, Canada, 1990, 264-278.
[13] R. Kovatcheva, Praktische Metallographie, 30 (1993), 68-81
[14] E. Tillová, M. Panušková, M. Chalupová, Druckguss-praxis 3 (2007), 108-112
[15] Z. Li, A. M. Samuel, F. H. Samuel, C. Ravindran, S. Valtierra, H. W. Doty, Materials Science and Engineering A, 367 (1-2) (2004), 96-110.
[16] G. A. Edwards, G. K. Sigworth, C. H. Cáceres, D. H. StJohn, J. Barresi, AFS Transaction, 105 (1997), 809-818.
[17] B. Zlatičanin, S. Durić, B. Jordović, B. Radonjić, J. Min. Metall. Sect. B-Metall., 39 (3-4) B (2003), 509-526
[18] G. Klančnik, J. Medved, P. Mrvar, M. Vončina, Livarski vestnik 56 (2) (2009), 64-78
[19] M. Petrič, J. Medved, P. Mrvar, Metalurgija, 50 (2) (2011), 127-131
a) Alloy A b) Alloy B
Figure 7.Multiple image analysis of EN AB AlSi9Cu3 alloy samples