of Chemical
Engineering
www.scielo.br/bjcePrinted in BrazilVol. 35, No. 01, pp. 27 – 41, January – March, 2018
*Corresponding author: José Alberto D. Rodrigues. E-mail: rodrigues@maua.br dx.doi.org/10.1590/0104-6632.20180351s20150807
FEASIBILITY OF BIOHYDROGEN PRODUCTION
BY CO-DIGESTION OF VINASSE (SUGARCANE
STILLAGE) AND MOLASSES IN AN ANSBBR
Roberta Albanez
1,2, Giovanna Lovato
1,2, Suzana Maria Ratusznei
1,
Marcelo Zaiat
2and José Alberto D. Rodrigues
1*1 Mauá School of Engineering, Mauá Institute of Technology (EEM/IMT), Praça Mauá 1, CEP 09.580-900, São Caetano do Sul, SP, Brazil.
2 São Carlos School of Engineering, University of São Paulo (EESC/USP), Av. Trabalhador São-Carlense 400, CEP 13.566-590, São Carlos, SP, Brazil.
(Submitted: December 16, 2015; Revised: August 2, 2016; Accepted: September 29, 2016)
Abstract – This work studied the feasibility of biohydrogen production by co-digestion of vinasse/molasses in an AnSBBR operated with mechanical stirring (30°C and 200 rpm). Hydrogen production by co-digestion of vinasse/ sucrose was also studied to verify the performance of the process with a known co-substrate with easy degradation.
The effects of influent composition (vinasse/sucrose and vinasse/molasses), influent concentration (3000 and 4000
mgCOD.L-1) and cycle time (3 and 4 h) on performance indicators were evaluated using stability, organic matter removal efficiency, molar hydrogen yield, productivity and biogas composition. The condition with vinasse/molasses in the influent that showed the best results was obtained with a 3-hour cycle time, influent concentration of 3000 mgCOD.L-1
and composition of 33% vinasse and 67% molasses. The molar productivity in this condition was 3.8 molH2.m-3.d-1 with a hydrogen molar fraction of 16% (and a methane molar fraction of 14%). A first order kinetic model was fitted efficiently to the best conditions.
Keywords: AnSBBR; co-digestion; cycle time; hydrogen; molasses; sugarcane stillage.
INTRODUCTION
Bioethanol is an important alternative fuel, especially considering the increasing demand to reduce carbon dioxide emissions. However, the ethanol production process
generates large volumes of effluents, mainly vinasse that is
generated in the proportion of 12 to 15 L per liter of ethanol produced. Vinasse is generated in the distillation column at a temperature of 85-90 °C with a low pH, a dark brown color, high ash content and a high percentage of dissolved organic and inorganic matter. The disposal of vinasse in the soil is
common and is justified by essential nutrients for the growth
of sugar cane. However, this can change the characteristics
of the soil, causing soil salinity and contamination of groundwater (Onodera et al., 2013; Santos et al., 2013).
The treatment of vinasse is one of the most challenging problems for the industrial production process of ethanol. Among the potential vinasse treatment options, biological
treatment is known as an effective method. The main
advantages of the anaerobic treatment of vinasse are the ability to convert a portion of the organic matter into biogas (hydrogen and/or methane), which can be used as a
source of energy, and the effluent can be used as fertilizer
Despite its great potential, there are few studies regarding hydrogen production using this substrate. It is important to mention that hydrogen production by anaerobic treatment of vinasse may present toxicity problems, related to the content of potassium, sulfate, phenolic compounds and melanoidins, and improvement of the biodegradability by the addition of a co-substrate can be a promising performance improvement strategy (Lazaro et al., 2014; Wang et al., 2011). Co-digestion is a feasible option to improve the biodegradability because it dilutes toxic compounds, balances nutrients, encourages synergy between microorganisms and increases the biodegradable organic matter (Mata-Alvarez et al., 2014). The use of molasses as a co-substrate is interesting because it is a by-product of the sugar industry, making it easily available (Soam et al. 2015). Molasses contains mostly sucrose (up to 55%), but also other sugars, salts and inorganic compounds (Mironczuk, et al., 2015).
The reason for the choice of the AnSBBR (anaerobic
sequencing batch biofilm reactor) is to study the
technological options for discontinuous operation as an alternative to continuous operation. The point is to assess the main advantages that are related to better operational
control (load-reaction-discharge), flexibility in the feeding mode (different cycle times) because of the different
periods of interrupted production, and suitability for the
different concentrations of wastewater available for the
generation of biogas from relatively small production units. An additional purpose is to evaluate the main limitations of this reactor related to the possibility of overload that leads to consequent microbial inhibition and reduction of overall productivity because of the need to charge-discharge and the inherent transient behavior of discontinuous operations (Lovato et al., 2016).
There are several studies in the literature on the
influence of process variables on reactor efficiency and stability when applied to the treatment of various effluents,
such as those related to: (i) the type of mixture, which can be implemented by recirculating the liquid phase (Bergamo et al., 2009; Bezerra et al., 2009) or by mechanical agitation (Rodrigues et al., 2003 and 2004; Michelan et al.,
2009). (ii) the filling time or feeding strategy (Albanez et al., 2009; Oliveira et al., 2010); and (iii) the organic load (Massé and Masse, 2000; Damasceno et al., 2007; Friedl et al., 2009; Carvalhinha et al., 2010). Currently, in the literature, there is an increase in the potential application of batch and fed-batch reactors to generate bioenergy (methane and hydrogen) in a broad context in which the wastewater should be treated just as raw material and not as a process waste, with the aim of making it possible to obtain energy from the methane/hydrogen generated (Yang et al., 2008; Bezerra et al., 2011; Manssouri et al., 2013; Bravo et al., 2015; Lovato et al., 2012; Lima et al., 2015).
In this context, this study aims to evaluate the feasibility of biohydrogen production by co-digestion of vinasse and
molasses in an anaerobic sequencing batch biofilm reactor
(AnSBBR) with mechanical agitation. This study evaluated
the influence of influent composition/concentration and
cycle time on stability, organic matter removal, intermediate metabolites, hydrogen yield and biogas productivity/
composition. A first order kinetic model was fitted to the
experimental data and its adjustment was evaluated (the best model parameters were determined).
MATERIALS AND METHODS AnSBBR
The mechanically stirred bioreactor (BIOFLO 110
Bioflo from New Brunswick Scientific Co.) consisted of
a glass vessel with a diameter of 20 cm and height of 30 cm, with a total capacity of 6.0 L and working volume
of 5.6 L. The inert support was confined in a perforated
316-stainless steel basket with a height of 18 cm and inner/ outer diameters of 7 and 17.5 cm, respectively (Figure 1). Stirring was set at 200 rpm, provided by a motor attached to
the six-flat-blade Rushton turbine impellers with diameter
of 6 cm and installed at 8 and 16 cm from the bottom of the tank.
Feeding and discharge were performed using diaphragm pumps. An automation system, consisting of
timers, controlled the on/off switching of the pump and
the agitator in order to implement the sequencing batch operation steps: feeding, reaction and discharge. The temperature was set at 30 ± 1°C by circulating water in the jacket of the reactor.
Inoculum and inert support
The inoculum used came from an anaerobic reactor
treating effluent from a poultry slaughterhouse. This
inoculum presented total volatile solids and total solids concentration of 51 and 62 g L−1, respectively. The support used for biomass immobilization consisted of low-density polyethylene (LDPE) pellets obtained from recycled plastic waste (length of 5 mm and diameter of 3 mm). This inoculum was submitted to heat treatment in which about 50 mL were heated to 90°C for 15 min followed by cooling in an ice bath to 25°C (adapted from Kim et al., 2006).
Wastewater
The wastewater used was formulated based on vinasse and molasses that were from a sugar/alcohol plant located in São Paulo, Brazil. The vinasse had approximately 25 g COD.L-1 and molasses 1100 g COD.L-1. To examine the system behavior using a known and easily biodegradable substrate, sucrose-based wastewater was used. Therefore,
different based wastewaters were used: sucrose; vinasse/
The salt solution added had the composition: urea/ CH4N2O 11.5 mg.L-1, NiSO
4.6H2O 0.5 mg.L -1, FeSO
4.7H2O 2.5 mg.L-1, FeCl
3.6H2O 0.25 mg.L
-1, CoCl
2.2H2O 0.04 mg.L-1, CaCl
2.6H2O 2.06 mg.L -1, SeO
2 0.036 mg.L -1,
KH2PO4 5.36 mg.L-1, K
2HPO4 1.3 mg.L
-1, and Na 2HPO4. H2O 2.7 mg.L-1.
Physical-chemical analyses
Reactor monitoring was carried out by measuring
influent and effluent samples, unfiltered (CCT) and
filtered (CCF) organic matter concentration as chemical oxygen demand (COD) and as total carbohydrates for
determining unfiltered (CST) and filtered (CSF), total alkalinity (TA), total volatile acids (TVA), total solids (TS), total volatile solids (TVS), total suspended solids (TSS), volatile suspended solids (VSS), pH and volume fed/discharged per cycle (Standard Methods for the Examination of Water and Wastewater, 1995; Dubois et al., 1956).
The intermediate compounds of the anaerobic metabolism (acetone, methanol, ethanol, n-butanol, acetic, propionic, butyric, isobutyric, valeric, isovaleric, and caproic acid) were analyzed by an Agilent Technologies
7890 gas chromatograph equipped with a flame ionization
detector, automatic injection (head space), GC Sampler 80, and an HP-Innowax column (30 m×0.25 mm×0.25
μm). Hydrogen was used as carrier gas with flow rate of
1.56 mL.min−1. Injector temperature was 250 °C, injection
volume was 400 μL, and split ratio 10. Oven temperature
was programmed as follows: from 35 to 38 °C at 2 °C min-1, from 38 to 75 °C at 10 °C min-1, from 75 to 120 °C at 35 °C min-1, at 120 °C for 1 min, from 120 to 170 °C at 10 °C min-1, and at 170 °C for 2 min. Detector
temperature was 280 °C with hydrogen flow (fuel) of 30
mL min-1, synthetic air flow (oxidant) of 300 mL min-1 and
make up (nitrogen) flow of 30 mL min-1. The head space method was employed in these analyses, using as internal standard crotonic acid (for volatile acids determination) and isobutanol (for determination of acetone and alcohols).
Figure 1. Scheme of the AnSBBR: [(a) Reactor 1 – Bioreactor BIOFLO III (New Brunswick Scientific.); 2 – Basket containing support
Composition of the biogas generated via anaerobic degradation was analyzed by gas chromatography using an Agilent Technologies 7890 gas chromatograph equipped with thermal conductivity detector and GS-Carbonplot
column (30 m×0.53 mm×3.0 μm). Argon was used as
carrier gas at 3.67 mL min-1, the injector temperature was
185 °C, injection volume 200 μL, and split ratio 10. Oven
temperature was programmed as follows: 40 °C isotherm for 5 min. Detector temperature was 150 °C, with makeup
(argon) fl ow rate of 8.33 mL.min−1 (Manssouri et al. 2013).
Volumetric biogas production was measured with a Ritter Milligas counter gas meter.
Theoretical – performance indicator parameters The organic matter removal effi ciency for unfi ltered (εCT) and fi ltered (εCF) samples (COD basis) was calculated
by Equation (1). The organic matter removal effi ciency based on carbohydrates for unfi ltered (εST – CST,I and CST)
and fi ltered (εSF – CST,I and CSF) samples was calculated in a similar way (Equation 2).
(1)
(2)
The applied volumetric organic load (AVOLST or AVOLCT – gCarbohydrate.L-1.day-1 or gCOD L-1.day-1) was calculated by Equation (3).
(3)
The applied specifi c organic load (ASOLST or ASOLCT – gCarbohydrate.gTVS-1.day-1 or gCOD.gTVS-1.day-1) was calculated by Equation (4).
(4)
The removed volumetric organic load (RVOLSF or RVOLCF – gCarbohyadrate.L-1.day-1 or gCOD.L-1.day-1) was calculated by Equation (5).
(5)
The removed specifi c organic load (RSOLSF or RSOLCF – gCarbohydrate.gTVS-1.day-1 or gCOD.gTVS-1.day-1) was calculated by Equation (6).
(6)
The daily molar productivity of hydrogen (MPr – molH2.L-1.d-1) was calculated by Equation (7), and the daily
specifi c molar productivity of hydrogen (SMPr – molH2.
gTVS-1.d-1) was calculated by Equation (8).
(7)
(8)
The molar yield per applied load (MYALS,m or MYALC,m – mmolH2.gCarbohydrate-1 or mmolH
2.gCOD -1)
was calculated by Equation (9).
(9)
The molar yield per removed load (MYRLS,m or MYRLC,m – mmolH2.gCarbohydrate-1 or mmolH
2.gCOD -1)
was calculated by Equation (10).
(10)
Theoretical - kinetic model of the metabolic route
The kinetic model used in this work was adapted from the one developed by Rodrigues et al. (2004) based on the model of Bagley and Brodkorb (1999) and from Lovato et al. (2016), which used it for a methanogenic process. In the adapted kinetic model developed for the anaerobic sequencing batch
biofi lm reactor, one alcohol (ethanol) and three volatile acids
(acetic, propionic, butyric acids) were considered.
The anaerobic process of organic matter degradation was
simplifi ed into eight steps (Equations 11 to 18). In the fi rst
seven parallel steps, the substrate (S, which is considered as sucrose) is converted to acetic acid (HAc), propionic acid (HPr), butyric acid (HBu) and ethanol (EtOH). Then, there is consumption of the propionic and butyric acids to form acetate and hydrogen. Finally, there are the acetoclastic and hydrogenotrophic routes to produce methane if methanogenesis is not completely inhibited. In all stages, the
conversion reactions were considered as being fi rst-order.
(11)
(12)
(13)
(14)
(15)
(16)
(17)
(18)
C12H22O11 + 5 H2O 4 CH3COOH + 4 CO2 + 8 H2
C12H22O11 + 4 H2 4 CH3CH2COOH + 3 H2O
C12H22O11 + H2O 2 CH3CH2CH2COOH + 4 CO2 + 4 H2
C12H22O11 + H2O 4 CH3CH2OH + 4 CO2
CH3CH2COOH + 2 H2O CH3COOH + CO2 + 3 H2
CH3CH2CH2COOH + 4 H2O CH3COOH + 2 CO2 + 6 H2
CH3COOH CH4 + CO2
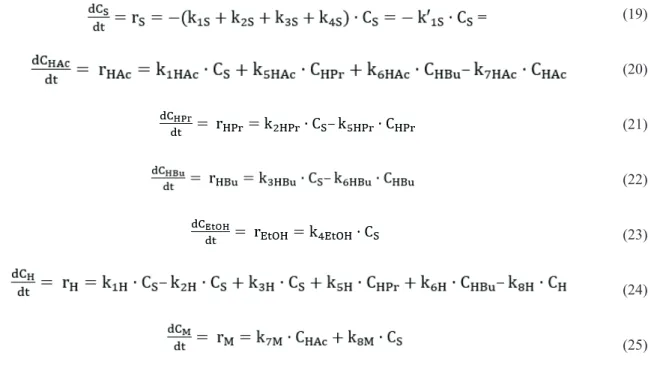
Equations 19 to 25 present the mass balance of the reactor components in batch mode according to the kinetic model (substrate, volatile acids, alcohol, hydrogen and methane). These equations were used to determine the kinetic parameters of the model. The reaction rates are represented in the equations 19 to 25 as substrate consumption (rS), formation and consumption of acetic acid (rHAc), propionic acid (rHPr), butyric acid (rHBu), ethanol (rEtOH), hydrogen (rH) and methane (rM). The parameters k’1S, k1HAc, k5HAc, k6HAc, k7HAc, k2HPr, k5HPr,
k3HBu, k6HBu, k4EtOH, k1H, k2H, k3H, k5H, k6H, k8H, k7M, k8M are the same apparent kinetic parameters associated with substrate consumption, volatile acids formation and consumption, alcohol, hydrogen and methane formation, respectively.
The kinetic parameter “k” is related to the reaction rate, indicating a relation to the time that is necessary for the concentration of the reagent to reach a value in accordance with the hypothesis of the kinetic model. Subscripts “1, 2, 3, 4, 5, 6, 7 and 8” are related to the reactions. Subscripts
Table 1. Studied experimental conditions. Conditions Concentration
(mgCOD.L-1) Cycle time (h)
AVOL (gCOD.L-1.d-1)
Infl uent Composition
%S %M %V
1 3000 4 5.1 100 0 0
2 4000 4 6.9 100 0 0
3 3000 4 5.1 67 0 33
4 3000 4 5.1 0 100 0
5 4000 4 6.9 0 100 0
6 3000 4 5.1 0 67 33
7 3000 3 6.9 0 67 33
8 3000 3 6.9 0 25 75
%S – sucrose; %M – molasses; %V – vinasse.
(19)
(20)
(21)
(22)
(23)
(24)
(25)
“S, HAc, HPr, HBu, EtOH, H and M” are related to the components’ experimental values (daily monitoring) used to calculate the parameters.
To address the diff erential equations, the Euler
numerical integration method (Excel software) was used. These parameters were calculated using an objective function in the optimization procedure (function Solver
in Excel software) for the minimum square error between experimental and model data, accordingly to Lovato et al. (2016).
Experimental procedure
the liquid medium volume maintained in the reactor (VRES) was 2.5 L, so the total volume of liquid medium (VR) was 3.5 L, and the volume of biomass+support (VS+B) was 2.1 L, and the total useful reactor volume (VT) was 5.6 L.
The reactor (AnSBBR) operation was carried out as
follows: in the first cycle, 3.5 L of influent was fed to the
reactor in 20 min, and the reactor was previously prepared by placing an inert support (low-density polyethylene,
LDPE) containing inoculum. After the influent was fed
into the reactor, an agitation of 200 rpm was implemented. At the end of the cycle (duration of the cycle depended
on experimental conditions), agitation was turned off and
1.0 L of wastewater was discharged (with 2.5 L of residual volume) in 10 min. After this discharging, a new cycle was started with the feeding of 1.0 L of wastewater (in 10 min) with agitation. At the end of the cycle, agitation was stopped again and discharge was performed so that the cycle could be repeated, featuring the sequencing batch mode.
After verifying stable values (variability less than 10%)
of the monitored variables, profiles along the cycle were obtained for: filtered organic matter and carbohydrate
concentrations, bicarbonate alkalinity, total volatile acids, intermediate metabolites, pH and biogas (production/
composition). To obtain these profiles, samples were taken
in time slots of 30 to 60 min. The volume collected did not
exceed 300 mL (9% of the total volume). These profiles
allowed a better understanding of metabolic routes, and, therefore, allowed the adjustment of the kinetic model of the proposed metabolic route (item 2.6).
The experimental conditions were performed by modifying the volumetric organic load as a function of substrate concentration (3000 and 4000 mgCOD.L-1) and
cycle time (4 and 3 h-cycles), and influent composition
(sucrose, vinasse/sucrose, molasses and vinasse/molasses). Table 1 summarizes the conditions performed (Conditions 1 to 8: 21 days each).
In conditions with vinasse/molasses (6/7/8) it was necessary to perform a systematic cleaning of the reactor (once a week) to better control the amount of biomass. In this way, about 40% of the total biomass was removed each week to compensate cell growth due to the metabolic characteristics of acidogenic microorganisms.
The objective was to improve stability and efficiency of
biohydrogen production. The procedure consisted of discharging the liquid medium in the reactor and washing the glass reactor vessel. The “inert support + biomass” was kept inside the perforated steel basket.
The effects of influent composition and concentration,
and cycle time on performance indicators were evaluated
using stability, organic matter removal efficiency, molar
hydrogen yield, productivity and biogas composition.
In Conditions 1-2-3, the influence of increasing influent
concentration was evaluated with sucrose based wastewater and with co-digestion of vinasse and sucrose. In Conditions
4-5-6, the increase in influent concentration was evaluated
with molasses-based wastewater and with co-digestion of vinasse and molasses. With Conditions 6 and 7, it
was possible to verify the influence of cycle time and in Conditions 7 and 8 the influence of increasing the vinasse percentage in the influent composition was verified.
RESULTS AND DISCUSSION Monitored variables and performance indicator parameters
Hydrogen production from vinasse in co-digestion with sucrose or molasses in AnSBBR performed in this work was stable. This stability was in relation to the stable production of biogas and its composition during the monitoring of the conditions studied (except Condition 8, in which it was not possible to obtain hydrogen production).
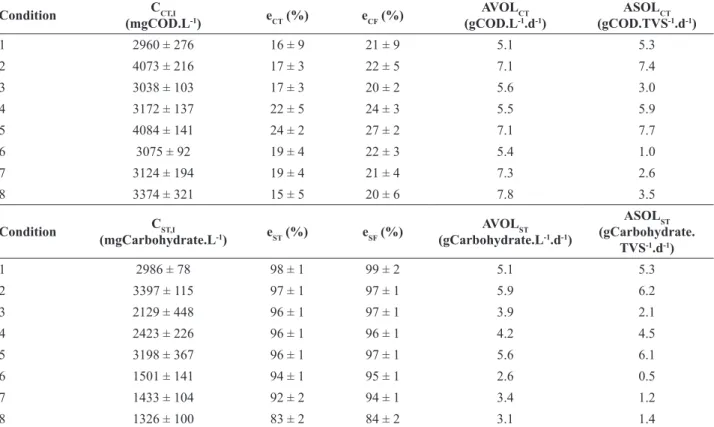
The system showed in all conditions (Table 2) low organic matter removal in the form of COD (approximately
20% for filtered samples) and a high removal of organic
matter in the form of carbohydrates (approximately 90% for
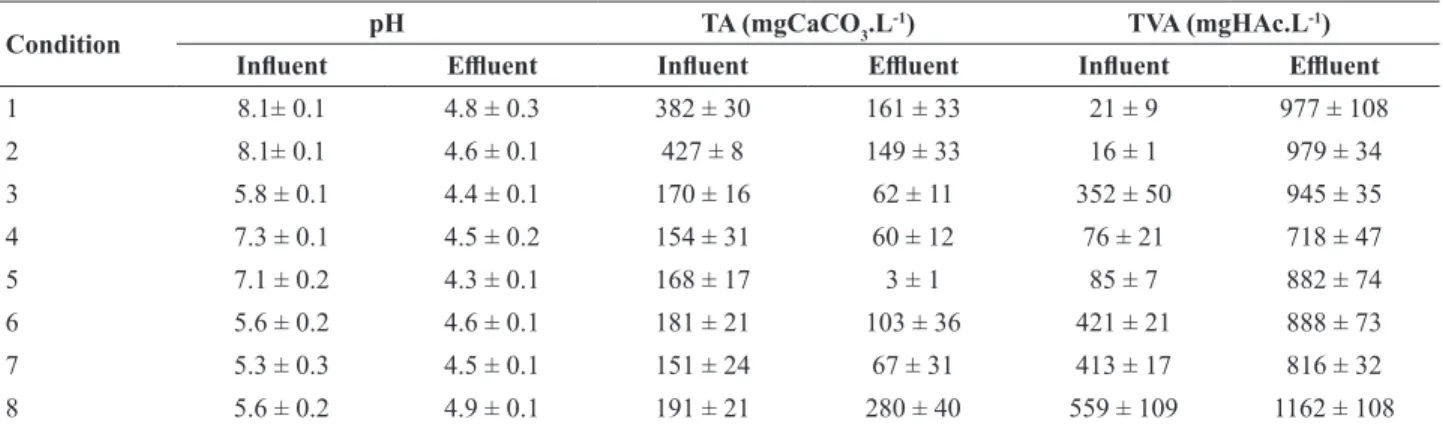
filtered samples). It was also noticed that by adding vinasse in the influent there was a decrease in pH and an increase in
total volatile acids, which was expected because vinasse is
characterized as acidified with a low pH (Table 2).
In all conditions there was a generation of total volatile acids, which is expected in systems that aim for hydrogen production (acidogenic phase). The average value of the
effluent pH was 4.5 ± 0.2, indicating stability. It is worth
mentioning that studies have shown that a suitable pH range to obtain hydrogen is between 4.0 and 7.0 (Wan and Wang, 2009). Lay et al. (1999) emphasized that a pH below 4.5 is unfavorable for the production of hydrogen, due to inhibition of the dehydrogenase activity and other enzymes, with a consequent alteration of the metabolic
routes. However, studies have shown different values that
can be attributed to substrate, inoculum and initial pH. According to Khanal et al. (2003) the maximum hydrogen yield was obtained at pH 4.5; to Fang and Liu (2002) the optimum pH for hydrogen production is in the range between 5.0 and 6.5; to Mu et al. (2006) the optimum pH was 5.5 and to Chen et al. (2009) 4.9.
Table 3 shows the values of pH, total alkalinity (TA) and total volatile acids (VTA) for all conditions. Table 4 shows the concentration of intermediate compounds in
influent and effluent, with a predominance of acetic acid in all conditions with molasses and/or vinasse in the influent
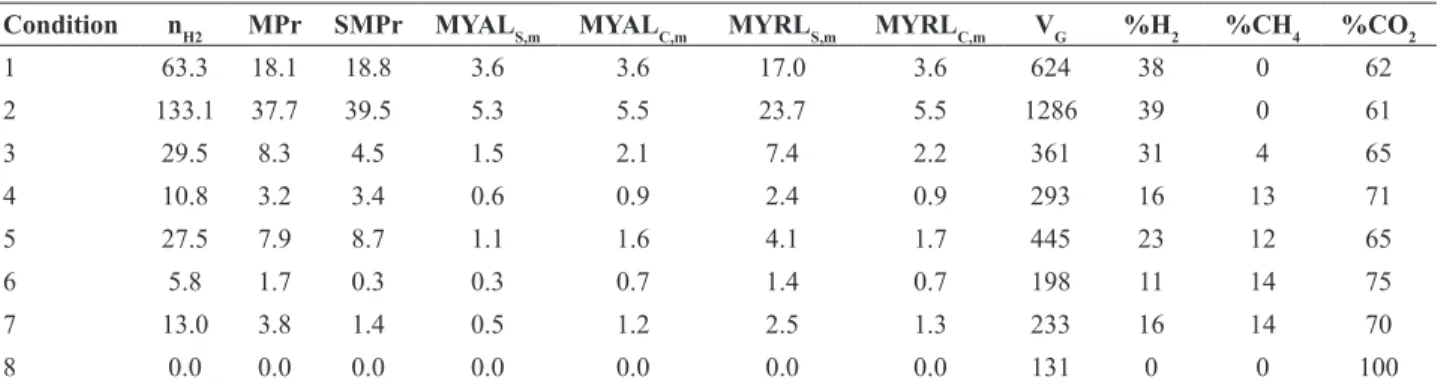
is not a general rule. Table 5 shows the values obtained for the performance indicators related to biogas production.
Influent concentration and composition (vinasse/
sucrose) – Conditions 1, 2 and 3
Conditions 1-2 were used to compare the results obtained in conditions with more complex substrates (molasses and/or vinasse) since sucrose is an easily biodegradable substrate. Condition 3 aimed to verify
the effects of vinasse/sucrose co-digestion on hydrogen
production.
The molar productivity (Table 5) increased from 18.1 to 37.7 molH2.m-3.d-1 from Condition 1 to 2 and decreased to 8.3 molH2.m-3.d-1 in Condition 3. The molar yield increased from 17.0 to 23.7 mmolH2.g COD-1 from Condition 1 to 2 and decreased to 7.4 mmolH2.gCOD -1 in Condition 3. These results show that the increase in
influent concentration caused an increase in hydrogen
productivity/yield and the insertion of vinasse caused a decrease in hydrogen productivity/yield, indicating that is
difficult for the microorganisms to assimilate a complex
substrate such as vinasse for hydrogen production. Vinasse also decreased the biogas composition. Conditions 1-2 did not show methane in the biogas, but Condition 3 did (4% CH4).
Manssouri et al. (2013) and Inoue et al. (2014) worked
with sucrose-based wastewater in AnSBBR, the first in
batch and the second in fed-batch mode. Manssouri et al.
(2013) obtained in the best condition (3600 mgCOD.L-1 and cycle time of 4 h) a hydrogen molar fraction of 20%, molar productivity of 19.4 molH2.m-3.d-1 and molar yield of 9.54 mmolH2.gCOD-1. Inoue et al. (2014) obtained in the best condition (3500 mgCOD.L-1, feeding time of 2 h and cycle time of 4 h) a hydrogen molar fraction of 32%, molar productivity of 24.5 molH2.m-3.d-1 and molar yield of 14.1 mmolH2.gCOD-1. The results obtained in the works of Manssouri et al. (2013) and Inoue et al. (2014) for hydrogen production were inferior to the results obtained in the present work (condition 2: hydrogen molar fraction of 39%, molar productivity of 37.7 molH2.m-3.d-1 and molar yield of 23.7 mmolH2.gCOD-1). Thus, the results obtained under conditions 1 and 2 are consistent with the previous studies analyzed and these results can be used to compare the performance of conditions 1 and 2 (simple substrate – sucrose) with the conditions realized with more complex substrates. Reis et al. (2015) studied the co-digestion of
vinasse/glucose (influent vinasse composition: 0%, 25%,
75% and 100%) for hydrogen production and noted that the vinasse decreased hydrogen production, as was noted in the present work. The best result was with 25%-vinasse/75%-glucose, which gave a molar yield of 14.7 mmolH2.gCOD-1 with the presence of methane in the biogas.
Table 4 shows a decrease of acetic acid and butyric
acid concentration in the effluent of Condition 3 compared
to Conditions 1-2, which may indicate a change in the Table 2 – Monitored substrate consumption in all conditions.
Condition CCT,I
(mgCOD.L-1) eCT (%) eCF (%)
AVOLCT (gCOD.L-1.d-1)
ASOLCT (gCOD.TVS-1.d-1)
1 2960 ± 276 16 ± 9 21 ± 9 5.1 5.3
2 4073 ± 216 17 ± 3 22 ± 5 7.1 7.4
3 3038 ± 103 17 ± 3 20 ± 2 5.6 3.0
4 3172 ± 137 22 ± 5 24 ± 3 5.5 5.9
5 4084 ± 141 24 ± 2 27 ± 2 7.1 7.7
6 3075 ± 92 19 ± 4 22 ± 3 5.4 1.0
7 3124 ± 194 19 ± 4 21 ± 4 7.3 2.6
8 3374 ± 321 15 ± 5 20 ± 6 7.8 3.5
Condition CST,I
(mgCarbohydrate.L-1) eST (%) eSF (%)
AVOLST (gCarbohydrate.L-1.d-1)
ASOLST (gCarbohydrate.
TVS-1.d-1)
1 2986 ± 78 98 ± 1 99 ± 2 5.1 5.3
2 3397 ± 115 97 ± 1 97 ± 1 5.9 6.2
3 2129 ± 448 96 ± 1 97 ± 1 3.9 2.1
4 2423 ± 226 96 ± 1 96 ± 1 4.2 4.5
5 3198 ± 367 96 ± 1 97 ± 1 5.6 6.1
6 1501 ± 141 94 ± 1 95 ± 1 2.6 0.5
7 1433 ± 104 92 ± 2 94 ± 1 3.4 1.2
8 1326 ± 100 83 ± 2 84 ± 2 3.1 1.4
The number of samples analyzed in each condition was 13 for the analysis of CCT, εC, CST, I, εS, volume, pH, TA and TVA; 1 for Cx. Fed volume (L): 1.02 ± 0.09; Cx (gTVS.L-1): Conditions 1, 2, 4 and 5: 0.94 ± 0.02; Conditions 3 and 6: 4.1 ± 1.2; Conditions 7 and 8: 2.4
Table 3 – Values of pH, total volatile acids (TVA) and bicarbonate alkalinity (TA) in all conditions.
Condition pH TA (mgCaCO3.L
-1) TVA (mgHAc.L-1)
Influent Effluent Influent Effluent Influent Effluent
1 8.1± 0.1 4.8 ± 0.3 382 ± 30 161 ± 33 21 ± 9 977 ± 108
2 8.1± 0.1 4.6 ± 0.1 427 ± 8 149 ± 33 16 ± 1 979 ± 34
3 5.8 ± 0.1 4.4 ± 0.1 170 ± 16 62 ± 11 352 ± 50 945 ± 35
4 7.3 ± 0.1 4.5 ± 0.2 154 ± 31 60 ± 12 76 ± 21 718 ± 47
5 7.1 ± 0.2 4.3 ± 0.1 168 ± 17 3 ± 1 85 ± 7 882 ± 74
6 5.6 ± 0.2 4.6 ± 0.1 181 ± 21 103 ± 36 421 ± 21 888 ± 73
7 5.3 ± 0.3 4.5 ± 0.1 151 ± 24 67 ± 31 413 ± 17 816 ± 32
8 5.6 ± 0.2 4.9 ± 0.1 191 ± 21 280 ± 40 559 ± 109 1162 ± 108
The number of samples analyzed in each condition was 13 for the analysis of volume, pH, TA and TVA.
Table 4. Monitored intermediate compounds in all conditions.
Condition Ethanol Acetic acid Propionic acid
Butyric acid
(mmol.L-1) (mmol.L-1) (mmol.L-1) (mmol.L-1)
1 17.3 10.5 0.9 2.6
2 18.8 12.9 1.0 2.8
3 5.1 9.0 1.4 2.1
4 1.1 6.3 0.6 1.3
5 2.1 7.2 0.8 2.0
6 0.4 5.6 1.0 1.2
7 0.3 7.5 1.1 1.4
8 1.5 6.5 4.1 1.5
metabolic pathway that may have reduced hydrogen production. Furthermore, also observed was a higher amount of solids in the reactor (MTVS – Conditions 1-2 was 3.4 g and Condition 3 was 6.7 g) that can be due to the solids present in the vinasse.
Influent concentration and composition (vinasse/
molasses) – Conditions 4, 5 and 6.
The aim of conditions 4, 5 and 6 was to verify the
effect of molasses and co-digestion of vinasse/molasses
on hydrogen production. This replacement of sucrose by molasses is interesting because molasses is a by-product of the sugarcane and alcohol industry.
The molar productivity (Table 5) increased from 3.2 in Condition 4 to 7.9 molH2.m-3.d-1 in Condition 5 and the molar yield increased from 2.4 to 4.1 mmolH2.g COD-1. In Condition 6 the molar productivity was 1.7 molH2.m -3.d-1 and molar yield was 1.4 mmolH
2.gCOD
-1. These
values are 80% lower than those obtained in Conditions 1-2. Furthermore, the biogas composition was: 16% of hydrogen in Condition 4, 23% in Condition 5 and 11% in Condition 6, with the presence of methane (12-14%) in Conditions 4-5-6. The hydrogen decreases and the increase in methane production may be explained by the sucrose
characteristics (pure substrate that is easily biodegraded) and molasses characteristics (complex substrate). This was also noticed by Lovato et al. (2015) and Bravo et al. (2015) in hydrogen production by glycerin-based wastewater.
Table 4 shows a decrease in acetic acid and butyric acid
concentration in the effluent of Condition 4-5-6 compared
to Conditions 1-2-3, which may indicate a change in the metabolic pathway that may have reduced hydrogen production.
Cycle time and influent composition (vinasse/molasses)
– Conditions 6, 7 and 8.
The aim of conditions 6, 7 and 8 was to verify the
effects of cycle time and the influent composition (vinasse/
molasses) on hydrogen production.
also observed in other studies with ASBR treating different
wastewater (Chen et al., 2009; Buitrón and Carvajal, 2010; Cheong et al., 2007; Arooj et al., 2008).
Table 4 shows an increase of acetic acid and butyric acid
concentration in the effluent of Condition 7 compared to
Condition 6, which may indicate a change in the metabolic pathway that improved hydrogen production.
Condition 8 (highest concentration of vinasse among all conditions) did not reach stability and hydrogen production decreased until it was no longer detected in biogas. This
result shows the difficulty of hydrogen production by
vinasse anaerobic treatment, which indicates the importance of the co-digestion study, because an easier biodegradable substrate is necessary to enable a stable system that produces bioenergy. The co-digestion is a feasible option to overcome the drawbacks of monodigestion and to improve the economic feasibility of the process, because it dilutes toxic compounds, balances nutrients, encourages synergy between microorganisms and increases the biodegradable organic matter (Mata-Alvarez et al., 2014; Bouallagui et al., 2009; Wang et al., 2012).
Some authors have shown an improvement in hydrogen production when working with co-digestion, Wang et al. (2011) showed that anaerobic co-digestion offers the best
condition of pH and carbon / nitrogen ratio for hydrogen production using water of cassava processing and sewage sludge (in thermophilic conditions) to yield an increase in hydrogen production with the mixture of substrate. Hydrogen production in the optimum condition was 17% higher than the condition that only treated water from the processing of cassava. Xia et al. (2012) have shown the
influence of three different co-substrates (glucose, xylose,
and starch) on the conversion of cellulose; experiments were carried out in sequential batch in serum bottles of 50 ml with a work volume of 30 mL. Microcrystalline cellulose was used as substrate (concentration 4.0 g.L-1) and glucose, xylose and soluble starch were individually measured as co-substrate (0.4 g.L-1). In conclusion, the use of xylose as co-substrate resulted in higher conversion and
hydrogen production (reaching a yield for hydrogen of 180 mL.L-1).
Reis et al. (2015) worked with AFBR reactors and studied the co-digestion of vinasse and glucose to produce hydrogen (studied percentages of vinasse: 0%, 25%, 75% and 100%). They concluded that the increase in the
percentage of vinasse in the influent damaged the production
of hydrogen and methane production was detected in the condition with 100% of vinasse. In the case of Reis et al. (2015), fixing HRT of 6 hours, the maximum percentage of vinasse in the influent which allows hydrogen production
without the presence of methane in the biogas was 75%, which also shows the importance of studying co-digestion of vinasse with an easier degraded substrate.
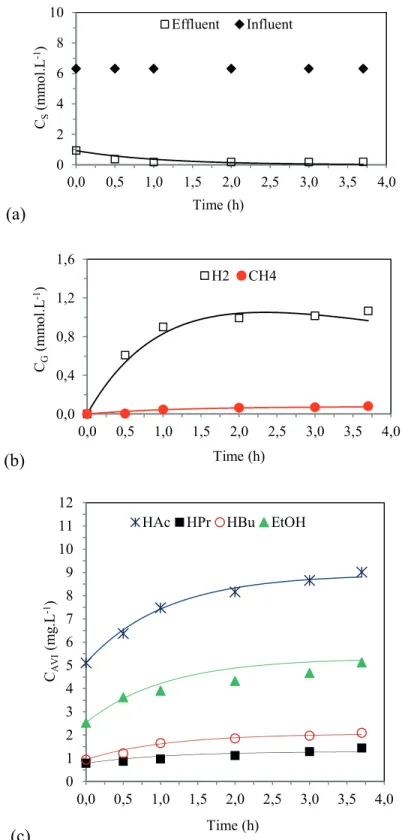
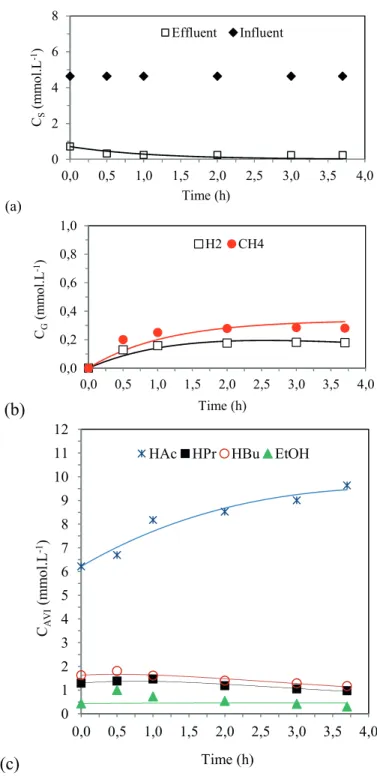
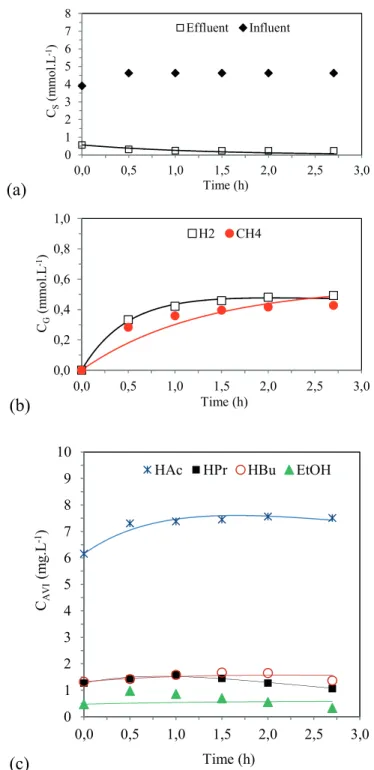
Profiles and kinetic model of the metabolic route
Figures 2, 3 and 4 show the values obtained experimentally (markers) and the values obtained by the adjusted kinetic model (lines), along the cycle for the main variables that are monitored and that are related to the understanding of the acidogenic metabolism in conditions 3, 6 and 7. Substrate is considered as being the sucrose measured by the Dubois method.
From these figures, it is possible to notice that the model was effective in predicting the experimental data
regarding the substrate, acetic acid, propionic acid, butyric acid, ethanol, hydrogen and methane concentrations, validating the interpretation of the kinetic parameters in the experimental conditions.
Thus, from the adjusted kinetic parameters (Table 6), the hydrogen production in Conditions 3 (k1H 0.76 h-1 and k
3H 0.78 h-1), 6 (k
1H 0.32 h -1 and k
3H 0.34 h
-1) and 7 (k 1H 0.84 h
-1 and
k3H 0.76 h-1) mainly occurs via the production of acetic and butyric acids, since the parameters associated with the production of hydrogen by the formation of these acids (k1H and k3H) are higher than the ones associated with the production of hydrogen by acetate formation (Equations 15 and 16).
It can also be noted that in conditions 6 and 7 the parameters associated with hydrogen consumption (k2H) Table 5 – Performance indicators related to biogas production in all conditions.
Condition nH2 MPr SMPr MYALS,m MYALC,m MYRLS,m MYRLC,m VG %H2 %CH4 %CO2
1 63.3 18.1 18.8 3.6 3.6 17.0 3.6 624 38 0 62
2 133.1 37.7 39.5 5.3 5.5 23.7 5.5 1286 39 0 61
3 29.5 8.3 4.5 1.5 2.1 7.4 2.2 361 31 4 65
4 10.8 3.2 3.4 0.6 0.9 2.4 0.9 293 16 13 71
5 27.5 7.9 8.7 1.1 1.6 4.1 1.7 445 23 12 65
6 5.8 1.7 0.3 0.3 0.7 1.4 0.7 198 11 14 75
7 13.0 3.8 1.4 0.5 1.2 2.5 1.3 233 16 14 70
8 0.0 0.0 0.0 0.0 0.0 0.0 0.0 131 0 0 100
Notation: nH2 – (mmolH2.d-1), MPr – (molH 2.m
-3.d-1), SMPr – (molH 2.kgTVS
-1.d-1), MYAL
S,m – (mmolH2.gCOD
-1), MYAL C,m –
(mmolH2.gCarbohydrate-1), MYRL
S,m – (mmolH2.gCOD
-1), MYRL
C,m – (mmolH2.gCarbohydrate -1), V
Figure 2. Profiles of the experimental data (symbols) and of the kinetic model (lines) in Condition 3.
(a)
(b)
(c)
02 4 6 8 10
0,0 0,5 1,0 1,5 2,0 2,5 3,0 3,5 4,0 CS
(mmo
l.
L
-1)
Time (h) Effluent Influent
0,0 0,4 0,8 1,2 1,6
0,0 0,5 1,0 1,5 2,0 2,5 3,0 3,5 4,0 CG
(m
mo
l.
L
-1)
Time (h) H2 CH4
0 1 2 3 4 5 6 7 8 9 10 11 12
0,0 0,5 1,0 1,5 2,0 2,5 3,0 3,5 4,0 CAV
I
(mg
.L
-1)
Figure 3. Profiles of the experimental data (symbols) and of the kinetic model (lines) in Condition 6.
(a)
(b)
(c)
0 2 4 6 80,0 0,5 1,0 1,5 2,0 2,5 3,0 3,5 4,0
CS
(mmo
l.
L
-1)
Time (h)
Effluent Influent
0,0 0,2 0,4 0,6 0,8 1,0
0,0 0,5 1,0 1,5 2,0 2,5 3,0 3,5 4,0
CG
(mmo
l.
L
-1)
Time (h)
H2 CH4
0 1 2 3 4 5 6 7 8 9 10 11 12
0,0 0,5 1,0 1,5 2,0 2,5 3,0 3,5 4,0
CAV
I
(mmo
l.
L
-1)
Time (h)
Figure 4. Profiles of the experimental data (symbols) and of the kinetic model (lines) in Condition 7.
(a)
(b)
(c)
0 1 2 3 4 5 6 7 80,0 0,5 1,0 1,5 2,0 2,5 3,0
CS
(m
m
ol
.L
-1)
Time (h)
Effluent Influent
0,0 0,2 0,4 0,6 0,8 1,0
0,0 0,5 1,0 1,5 2,0 2,5 3,0
CG
(mm
o
l.
L
-1)
Time (h)
H2 CH4
0 1 2 3 4 5 6 7 8 9 10
0,0 0,5 1,0 1,5 2,0 2,5 3,0
CAV
I
(mg
.L
-1)
Time (h)
and propionic acid formation (k2HPR) are higher than the ones obtained in condition 3, which agrees with the values obtained in the experimental data: condition 3 has the highest values of hydrogen production and the lowest values of propionic acid concentration.
Regarding the methane production, the model indicates that the methane formation is via the hydrogenotrophic route for all conditions (the k7M values – kinetic constant for the acetoclastic route – are zero), which is a coherent result, since it is an acidogenic reactor and, theoretically, it would not produce CH4. Observing k8M, condition 3 has the parameter with the lowest value and condition 7 has the highest, which also agrees with the results obtained in the experimental monitoring.
The kinetic parameter for ethanol (k4ETOH) also agrees with the production obtained in the monitoring: condition 3 has the constant with the highest value (2.79 h-1).
CONCLUSIONS
Hydrogen production by co-digestion of vinasse/ sucrose and vinasse/molasses proved feasible in an AnSBBR. In the co-digestion of vinasse/sucrose (33-67%; 5.6 gCOD.L-1.d-1; 4-hour cycle time) a molar productivity of 8.3 molH2.m-3.d-1 was obtained (31% hydrogen and 4% methane) and in the co-digestion of vinasse/molasses (33-67%; 6.9 gCOD.L-1.d-1; 3-hour cycle time) 3.8 molH
2.m
-3.d-1 was obtained (16% hydrogen and 14% methane). The
use of molasses as a co-substrate has economic advantages
over sucrose. Increasing the percentage of vinasse (75-25% vinasse/molasses) was unfavorable and made the system unstable. Moreover, the decrease in cycle time (from 4 to 3 hours) favored the production of biohydrogen, but did not
eliminate methanogenesis. A fist order kinetic model was fitted properly to the obtained data.
NOTATION
%CH4 Molar fraction of methane (%) %CO2 Molar fraction of carbon dioxide (%) %H2 Molar fraction of hydrogen (%)
AnSBBR Anaerobic Sequencing Batch Biofilm
Reactor
ASOLCT Applied specific organic load based on organic matter (gCOD.gTVS-1.d-1)
ASOLST Applied specific organic load based on carbohydrate (gSAC.gTVS-1.d-1)
AVOLCT Applied volumetric organic load based on organic matter (gCOD.L-1.d-1)
AVOLSTApplied volumetric organic load based on carbohydrate (gCarbohydrate. L-1.d-1)
CCT,I Concentration based on organic matter for
unfiltered samples in the influent (mgCOD.L-1)
CST,I Concentration based on carbohydrates for
unfiltered samples in the influent (mgCarbohydrate.L-1) CX Relation between the amount of biomass and the volume of liquid medium in the reactor (gTVS.L-1) HST Heat Shock Treatment
LDPE Low-density polyethylene
MPr Daily molar productivity of hydrogen (molH2.m -3.d-1)
MTVS Total biomassin the reactor in total volatile solids (gTVS)
MYALC,m Molar yield per applied load based on organic matter expressed as kg (mmolH2.gCOD-1)
MYALS,m Molar yield per applied load based on carbohydrates expressed as kg (mmolH2.gCarbohydrate-1) MYRLC,m Molar yield per removed load based on organic matter expressed as kg (mmolH2.gCOD-1)
MYRLS,m Molar yield per removed load based on carbohydrates expressed as kg (mmolH2.gCarbohydrate-1) N Number of cycles per day
nH2 Daily molar production of hydrogen (mmolH2.d-1) pH Hydrogen ion potential (u)
SMPr Daily specific molar productivity of hydrogen
(molH2.kgTVS-1.d-1) TA total alkalinity
tC Cycle length (h.Cycle-1)
TS Total solids concentration (mgTS.L-1)
TSS Total suspended solids concentration (mgTSS.L-1) TVA total volatile acids
TVS Total volatile solids concentration (mgTVS.L-1) VB+S Volume of biomass+support (L)
VF Volume of wastewater fed/discharge during the Table 6. Parameters of the first order kinetic model.
Parameter 3 6 7
k’1S (h-1) 0.93 0.90 0.78
k1HAC (h-1) 3.83 1.03 5.17
k5HAC (h-1) 0.00 0.55 0.00
k6HAC (h-1) 0.00 0.63 3.70
k7HAC (h-1) 0.00 0.11 0.87
k2HPR (h-1) 0.51 0.77 2.28
k5HPR (h-1) 0.00 0.21 0.44
k3HBU (h-1) 1.12 0.67 0.66
k6HBU (h-1) 0.00 0.18 0.04
k4ETOH (h-1) 2.79 0.04 0.17
k1H (h-1) 0.76 0.32 0.84
k2H (h-1) 0.05 0.68 1.16
k3H (h-1) 0.78 0.34 0.76
k5H (h-1) 0.00 0.03 0.00
k6H (h-1) 0.00 0.12 0.61
k8H (h-1) 0.15 0.98 2.10
k7M (h-1) 0.00 0.00 0.00
cycle (L)
VG Volume of total biogas produced in the STP (NmL.d-1)
VR Volume of liquid medium in the reactor (L) VRES Volume of liquid medium maintained in the reactor (L)
VSS Volatile suspended solids concentration (mgVSS.L-1)
VT Total useful reactor volume (L)
eCF Removal efficiency based on organic matter
(COD) for filtered samples (%)
eCT Removal efficiency based on organic matter
(COD) for unfiltered samples (%)
eSF Removal efficiency based on carbohydrates for
filtered samples (%)
eST Removal efficiency based on carbohydrates for
unfiltered samples (%)
ACKNOWLEDGMENTS
This study was supported by the São Paulo Research Foundation (FAPESP, grant #2014/07692-8 and
#2009/15984-0), the National Council for Scientific and
Technological Development (CNPq) and the Coordination for the Improvement of Higher Education Personnel (CAPES).
REFERENCES
Albanez, R.; Canto, C.S.A.; Ratusznei, S.M.; Rodrigues, J.A.D.; Zaiat, M.; Foresti, E. (2009). Feasibility of a sequencing reactor operated in batch and fed-batch mode applied to
nitrification and denitrification processes. Revista de Química Teórica Y Aplicada - Afinidad, 66, 44-55.
Arooj, M. F.; Han, S.; Kim, S.; Kim, D.; Shin, H. (2008). Effect
of HRT on ASBR converting starch into biological hydrogen. International Journal of Hydrogen Energy, 33, 6509-6514. Bagley, D.M.; Brodkorb, T.S. (1999). Modeling microbial kinetics
in an anaerobic sequencing batch reactor – model development and experimental validation. Water Environmental Research, 71, 1320-1332.
Bergamo, C.M.; Monaco, R.; Ratusznei, S.M.; Rodrigues,
J.A.D.; Zaiat, M.; Foresti, E. (2009). Effects of temperature at different organic loading levels on the performance of a fluidized-bed anaerobic sequencing batch bioreactor.
Chemical Engineering and Processing, 48, 789-796.
Bezerra, R.A.; Rodrigues, J.A.D.; Ratusznei, S.M.; Canto,
C.S.A.; Zaiat, M. (2011). Effect of organic load on the
performance and methane production of an AnSBBR treating
effluent from biodiesel production. Applied Biochemistry and
Biotechnology, 165, 347-368.
Bezerra, R.A.; Rodrigues, J.A.D.; Ratusznei, S.M.; Zaiat, M.;
Foresti, E. (2009). Effects of feed time, organic loading and
shock loads in the anaerobic whey treatment by an AnSBBR with circulation. Applied Biochemistry and Biotechnology, 157, 140-158.
Bravo, I.S.M.; Lovato, G.; Ratusznei, S.M.; Rodrigues, J.A.D.; Zaiat, M. (2015). Biohydrogen production in an AnSBBR
treating glycerin-based wastewater: effects of organic loading, influent concentration and cycle time. Applied Biochemistry
and Biotechnology, 175, 1892-1914.
Buitrón, G.; Carvajal, C. (2010). Biohydrogen production from
Tequila vinasses in an anaerobic sequencing batch reactor: Effect
of initial substrate concentration, temperature and hydraulic retention time. Bioresource Technology, 101, 9071-9077. Carvalhinha, P.P.; Flôres, A.; Ratusznei, S.M.; Rodrigues,
J.A.D.; Zaiat, M.; Foresti, E. (2010). AnSBBR applied to the
treatment of metalworking fluid wastewater: effect of organic
and shock load. Applied Biochemistry and Biotechnology, 162, 1708-1724.
Chen, W.; Sung, G.S.; Chen, S. (2009). Biological hydrogen production in an anaerobic sequencing batch reactor: pH and
cyclic duration effects. International Journal of Hydrogen
Energy, 34, 227-234.
Cheong, D-Y.; Hansen, C.L.; Stevens, D.K. (2007). Production of bio-hydrogen by mesophilic anaerobic fermentation in an acid-phase sequencing batch reactor. Biotechnology and Bioengineering, 96, 421-432.
Damasceno, L.H.S.; Rodrigues, J.A.D.; Ratusznei, S.M.; Zaiat,
M.; Foresti, E. (2007). Effects of feeding time and organic loading in an anaerobic sequencing batch biofilm reactor
(ASBBR) treating diluted whey. Journal of Environmental Management, 85, 927-935.
Das, D.; Veziroglu, T.N. (2001). Hydrogen production by biological processes : a survey of literature. International Journal of Hydrogen Energy, 26, 13-28.
Dubois, S.M.; Gilles, K.A.; Hamilton, J.L.; Rebers, P.A.; Smith, F. (1956). Colorimetric methods for determination of sugar and related substance. Analitical Chemistry, 228, 13-21.
Fang, H.H.P.; Liu, H. (2002). Effect of pH on hydrogen production
from glucose by a mixed culture. Bioresource Technology, 82, 87-93.
Friedl, G.F.; Mockaitis, G.; Rodrigues, J.A.D.; Ratusznei, S.M.; Zaiat, M.; Foresti, E. (2009). AnSBBR applied to organic
matter and sulfate removal: interaction effect between feed
strategy and COD/sulfate ratio. Applied Biochemistry and Biotechnology, 159, 95-109.
Inoue, R.K.; Lima, D.M.F.; Rodrigues, J.A.D.; Ratusznei, S.M.;
Zaiat, M. (2014). Effect of organic loading rate and fill time
on the biohydrogen production in a mechanically stirred AnSBBR treating synthetic sucrose based wastewater. Applied Biochemistry and Biotechnology, 174, 2326-2349.
Khanal, S.; Chen, W.; Sung, S. (2003). Biological hydrogen
production: effects of pH and intermediate products.
International Journal of Hydrogen Energy, 29, 1123-1131.
Kim, S; Han, S; Shin, H. (2006). Effect of substrate concentration
on hydrogen production and 16 S rDNA-based analysis of the microbial community in a continuous fermenter. Process Biochemistry, 41, 199-207.
Lay, J.J.; Lee, Y.J.; Noike, T. (1999). Feasibility of biological hydrogen production from organic fraction of municipal solid waste. Water Research, 33, 2579-2586.
hydrogen production: The effects of temperature and substrate
concentration. International Journal of Hydrogen Energy, 39, 6407-6418.
Lima, D.M.F.; Inoue, R.K.; Rodrigues, J.A.D.; Ratusznei, S.M.; Zaiat, M. (2015). Biohydrogen from Cheese Whey Treatment in an AnSBBR: Achieving Process Stability. Brazilian Journal of Chemical Engineering, 32, 397-408.
Lovato, G.; Bezerra, R.A.; Rodrigues, J.A.D.; Ratusznei,
S.M.; Zaiat, M. (2012). Effect of feed strategy on methane production and performance of an AnSBBR treating effluent
from biodiesel production. Applied Biochemistry and Biotechnology, 166, 2007-2029.
Lovato, G.; Bravo, I.S.M.; Ratusznei, S.M.; Rodrigues, J.A.D.,
Zaiat, M. (2015). The effect of organic load and feed strategy
on biohydrogen production in an AnSBBR treating glycerin-based wastewater. Journal of Environmental Management, 154, 128-137.
Lovato, G.; Ratusznei, S.M.; Rodrigues, J.A.D., Zaiat, M. (2016). Co-digestion of Whey with Glycerin in an AnSBBR for Biomethane Production. Applied Biochemistry and Biotechnology, 178, 126–143.
Manssouri, M.; Rodrigues, J.A.D.; Ratusznei, S.; Zaiat, M.
(2013). Effects of organic loading, influent concentration
and feed time on biohydrogen production in a mechanically stirred AnSBBR treating sucrose based wastewater. Applied Biochemistry and Biotechnology, 171, 1832-1854.
Massé, D.I.; Masse, L. (2000). Treatment of slaghterhouse wastewater in anaerobic sequencing batch reactors. Canadian Agricultural Engineering, 42, 131-137.
Mata-Alvarez, J.; Dosta, J.; Romero-Güiza, M.S.; Fonoll, X.; Peces, M.; Astals, S. (2014). A Critical review on anaerobic co-digestion achievements between 2010 and 2013. Renewable & Sustainable Energy Reviews, 36, 412-427.
Michelan, R.; Zimmer, T.R.; Rodrigues, J.A.D.; Ratusznei,
S.M.; Moraes, D.; Zaiat, M.; Foresti E. (2009). Effect of
impeller type and mechanical agitation on the mass transfer and power consumption aspects of ASBR operation treating synthetic wastewater. Journal of Environmental Management, 90, 1357-1364.
Mironczuk, A. M., Rakicka, M., Biegalska, A., Rymowicz, W., Dobrowolski, A. (2015). A two-stage fermentation process of erythritol production by yeast Y. lipolytica from molasses and glycerol. Bioresource Technology, 198, 445-455.
Moraes, B.S.; Junqueira, T.L.; Pavanello, L.G.; Cavalett A.O.; Mantelatto, P. E.; Bonomi, A.; Zaiat, M. (2014). Anaerobic
digestion of vinasse from sugarcane biorefineries in Brazil
from energy, environmental, and economic perspectives:
Profit or expense? Applied Energy, 113, 825–835.
Mu, Y.; Yu, H.Q.; Wang, Y. (2006). The role of pH in the
fermentative H2 production from an acidogenic granule-based reactor. Chemosphere, 64, 350-358.
Oliveira, R.P.; Ratusznei, S.M.; Rodrigues, J.A.D.; Zaiat,
M.; Foresti, E. (2010). Interaction effects of organic load
and cycle time in an ASBR applied to a personal care industry wastewater treatment. Journal of Environmental Management, 91, 2499-2504.
Onodera, T.; Sase, S.; Choeisai, P.; Yoochatchaval, W.; Sumino, H.; Yamaguchi, T.; Ebie, Y.; Xu, K.; Tomioka, N.; Mizuochi, M.; Syutsubo, K. (2013). Development of a treatment system
for molasses wastewater: The effects of cation inhibition on
the anaerobic degradation process. Bioresource Technology, 131, 295-302.
Pant, D.; Adholeya, A. (2007). Biological approaches for treatment of distillery wastewater: A review. Bioresource Technology, 98, 2321-2334.
Reis, C. M., Carosia, M. F., Sakamoto, I. K. Varesche, M. B. A., Silva, E. L. (2015). Evaluation of hydrogen and methane
production from sugarcane vinasse in an anaerobic fluidized
bed reactor. International Journal of Hydrogen Energy, v.40, p. 8498 -8509.
Rodrigues, J. A. D.; Pinto, A. G.; Ratusznei, S. M.; Zaiat, M.; Gedraite, R. (2004). Enhancement of the performance of an anaerobic sequencing batch reactor treating low strength wastewater through implementation of a variable stirring rate program. Brazilian Journal Chemical Engineering, 21, 423-434.
Rodrigues, J.A.D.; Ratusznei, S.M.; Camargo, E.F.M.; Zaiat, M.
(2003). Influence of agitation rate on the performance of an
anaerobic sequencing batch reactor containing granulated biomass treating low-strength wastewater. Advances in Environmental Research, 7, 405-410.
Santos, J.D.; Silva, A.L.L.; Costa, J.L.; Scheidt, G.N.; Novak, A.C.; Sydney, E.B.; Soccol, C.R. (2013). Development of a vinasse nutritive solution for hydroponics. Journal of Environmental Management, 114, 8-12.
Shizas, I; Bagley, D.M. (2002). Improving anaerobic sequencing batch reactor performance by modifying operational parameters. Water Research, 36, 363-367.
Soam, S., Kumar, R., Gupta, R. P., Sharma, P. K., Tuli, D. K., Das, B. (2015). Life cycle assessment of fuel ethanol from sugarcane molasses in northern and western India and its impact on Indian biofuel programme. Energy, 83, 307-315.
Standard Methods for the Examination of Water and Wastewater. (1995). APHA, AWWA, WPCF. 19th edition, American Public Health Association, Washington.
Wang W, Xie L, Chen J, Luo G, Zhou Q. (2011). Biohydrogen
and methane production by co-digestion of cassava stillage and excess sludge under thermophilic condition. Bioresource Technology, 102, 3833-3839.
Wang, J., Wan, W. (2009). Factors influencing fermentative
hydrogen production: A review. International Journal of Hydrogen Energy, 34, 799-811.
Xia, Y.; Cai, L.; Zhang, T.; Fang, H.H.P. (2012). Effects of
substrate loading and co-substrates on thermophilic anaerobic conversion of microcrystalline cellulose and microbial communities revealed using high-throughput sequencing. International Journal of Hydrogen Energy, 37, 13652-13659.
Yang, Y.; Tsukahara, K.; Sawayama, S. (2012). Biodegradation and methane production from glycerol-containing synthetic
wastes with fixed-bed bioreactor under mesophilic and