ISSN 0104-6632 Printed in Brazil
www.abeq.org.br/bjche
Vol. 31, No. 03, pp. 659 - 674, July - September, 2014 dx.doi.org/10.1590/0104-6632.20140313s00002694
*To whom correspondence should be addressed
Brazilian Journal
of Chemical
Engineering
AnSBBR WITH CIRCULATION APPLIED TO
BIOHYDROGEN PRODUCTION TREATING
SUCROSE BASED WASTEWATER: EFFECTS
OF ORGANIC LOADING, INFLUENT
CONCENTRATION AND CYCLE LENGTH
D. A. Santos
1, J. A. D. Rodrigues
2*, S. M. Ratusznei
2and M. Zaiat
11
Departamento de Hidráulica e Saneamento, Escola de Engenharia de São Carlos, Universidade de São Paulo (USP), Av. Trabalhador São-Carlense 400, CEP 13.566-590, São Carlos - SP, Brasil.
2
Departamento de Engenharia Química e de Alimentos, Escola de Engenharia Mauá, Instituto Mauá de Tecnologia (IMT), Praça Mauá 1, CEP: 09.580-900, São Caetano do Sul - SP, Brasil.
E-mail: [email protected]
(Submitted: May 7, 2013 ; Revised: August 26, 2013 ; Accepted: September 18, 2013)
Abstract - An anaerobic sequencing batch biofilm reactor (AnSBBR) containing immobilized biomass and operating with recirculation of the liquid phase (total liquid volume 4.5 L; treated volume per cycle 1.9 L) was used to treat sucrose-based wastewater at 30 ºC and produce biohydrogen. The influence of applied volumetric organic load was studied by varying the influent concentration at 3600 and 5400 mgCOD.L-1 and using cycle lengths of 4, 3 and 2 hours, obtaining in this manner volumetric organic loads of 9, 12, 13.5, 18 and 27 gCOD.L-1.d-1. Different performance indicators were used: productivity and yield of biohydrogen per applied and removed load, reactor stability and efficiency based on the applied and removed organic loads, both in terms of organic matter (measured as COD) and carbohydrate (sucrose). The results revealed system stability (32-37% of H2 in biogas) during biohydrogen production, as well as substrate consumption (12-19% COD; 97-99%
sucrose). Conversion efficiencies decreased when the influent concentration was increased (at constant cycle length) and when cycle lengths were reduced (at constant influent concentrations). The best yield was 4.16 mol-H2.kg-SUC-1 (sucrose load) at 9 gCOD.L-1.d-1 (3600 mgCOD.L-1 and 4 h) with H2 content in the biogas of 36%
(64% CO2 and 0% CH4). However, the best specific molar productivity of hydrogen was 8.5 molH2.kgTVS-1.d-1
(32% H2; 68% CO2; 0% CH4), at 18 gCOD.L -1
.d-1 (5400 mgCOD.L-1 and 3 h), indicating that the best productivity tends to occur at higher organic loads, as this parameter involves the “biochemical generation" of biogas, whereas the best yield tends to occur at lower and/or intermediate organic loads, as this parameter involves "biochemical consumption" of the substrate. The most significant metabolites were ethanol, acetic acid and butyric acid. Microbiological analyses revealed that the biomass contained bacilli and endospore filaments and showed no significant variations in morphology between different experimental conditions.
Keywords: AnSBBR; Biohydrogen; Liquid circulation; Organic loading; Influent concentration; Cycle length.
INTRODUCTION
Concerns regarding the use of fossil fuels, to-gether with environmental issues, have led scientists
660 D. A. Santos, J. A. D. Rodrigues, S. M. Ratusznei and M. Zaiat
of several substrates. Within this perspective, hydro-gen has appeared as a promising substitute for pe-troleum-derived fuels. The advantages of this fuel include clean combustion and high energy potential. At present, studies are focused on finding new ways for large scale production to make production eco-nomically feasible (Lin and Lay, 2005; Argun et al., 2008; Turcot et al., 2008; Wang et al., 2008 and 2009a).
Hydrogen production from waste may become a technological and economically feasible alternative and, at the same time, integrate the principles of sustainable development because different residues can be used as substrate for biohydrogen production, such as: sucrose, wheat starch, organic fraction of solid waste, biological reactor effluent, vegetable oils and waste from biodiesel and ethanol production processes (Lin and Lay, 2005; Argun et al., 2008; Turcot et al., 2008, Wang et al., 2008 and 2009a; Das and Veziroglu, 2001; Kawagoshi et al. 2005; Li and Fang, 2007; Davila-Vazquez et al., 2007; Ren et al., 2008; Wang et al., 2009b). Moreover, the efflu-ent of biohydrogen production units may be used to produce biomethane by anaerobic digestion.
These residues are used in studies that assess hy-drogen productivity and operational stability of the reactors using operation parameters for hydrogen production including several factors, such as the nature of the inocula, pH, temperature, nature and concentration of the substrate, and residence time of the liquid in the reactor. These parameters have spe-cific influences on the productivity and yield per removed load (Tanisho and Ishiwata, 1995; Khanal
et al., 2003; Wu et al., 2003; Lin and Lay, 2004a-b and 2005; Ferchichi et al., 2005; Ito et al., 2005; Zhang et al., 2006; Mu et al., 2006; Liu et al., 2006; Jeong et al., 2007; Nishio and Nakashimada, 2007; Mohan et al., 2007; Alzate-Gaviria et al., 2007; Leite
et al., 2008; Yang et al., 2008; Argun et al., 2008; O-Thong et al., 2008; Oztekin et al., 2008; Sabourin-Provost et al., 2009; Wu et al., 2010; Buitrón and Carvajal, 2010; Sreethawong et al., 2010; Badiei et al., 2011; Mohanakrishna et al., 2011).
Anaerobic reactors operated in sequencing batch and/or fed batch seem to be appropriate for biohy-drogen production. These reactors have a typical cycle that comprises four steps: (i) feeding, in which the fill time may vary, defining the feed strategy as batch and/or fed batch; (ii) the treatment itself, via biotransformation of the wastewater constituents by microorganisms; (iii) sedimentation, only when the biomass is in granular form (ASBR) since this step is not required when the biomass is immobilized
on inert support (AnSBBR); and (iv) discharge, i.e., removal of treated and clarified liquid.
These reactors have been studied in several projects which focus on optimization of conventional bioreactors and on novel configurations that allow application of the system to different wastewaters, as well as full-scale implementation (Bagley and Brodkorb, 1999; Massé and Masse, 2000; Zaiat et al., 2001; Angenent et al., 2002; Shizas and Bagley, 2002; Rodrigues et al., 2003; Damasceno et al., 2008; Oliveira et al., 2008; Oliveira et al., 2009; Friedl et al., 2009; Michelan et al., 2009; Bezerra et al., 2009 and 2011; Mockaitis et al., 2010; Carvalhinha
et al., 2010; Novaes et al., 2010a; Novaes et al., 2010b; Selma et al., 2010; Oliveira et al., 2010; Cubas et al., 2011; Rodrigues et al., 2011). Furthermore, these reactors have shown an increasing potential to gen-erate biomethane (Bezerra et al., 2011; Lovato et al., 2012; Silva et al., 2013) and biohydrogen from wastewaters, i.e., wastewater can be used as raw material to obtain energy.
In this context, the main objective of this work was to assess the stability and performance of an anaerobic sequencing batch biofilm reactor (AnSBBR), with recirculation of the liquid phase and containing im-mobilized biomass, for biohydrogen production, treating sucrose-based synthetic wastewater. Reactor performance was assessed by means of yield and productivity indicators for different applied volumet-ric organic loads, obtained by modifying the influent concentration and cycle length, also taking into ac-count the composition of the produced biogas (hy-drogen, methane and carbon dioxide), the distribu-tion of metabolites in the liquid effluent (volatile acids and ethanol) and substrate removal.
AnSBBR with Circulation Applied to Biohydrogen Production Treating Sucrose Based Wastewater 661
Brazilian Journal of Chemical Engineering Vol. 31, No. 03, pp. 659 - 674, July - September, 2014
MATERIALS AND METHODS
AnSBBR with Liquid Phase Circulation
Figure 1 illustrates the scheme of the system used for biohydrogen production by anaerobic treatment of sucrose-based synthetic effluent. The reactor con-sisted of a cylindrical acrylic column with height of 540 mm, external diameter of 100 mm and wall thickness of 3.5 mm. A 30 mm compartment at the bottom of the reactor allowed enhanced distribution of the wastewater, preventing formation of preferen-tial routes. At the upper part of the reactor a 30 mm region (200 mL) functioned as a biogas collector (H2, CH4 and CO2). Hence, the total volume of the reactor was 4.3 L (empty volume).
The inert support containing the immobilized biomass was placed between perforated stainless steel plates, lined with screens on the upper side. These plates divided the 540 mm high reactor into five parts to avoid bed compacting and passage of the support particles between stages.
The recirculation unit comprised (i) a side reser-voir, with a volume of 2.9 L (empty volume), con-sisting of a cylindrical acrylic container with height of 430 mm, external diameter of 100 mm and wall thickness of 3.5 mm; and (ii) an MCP Ismatec
peristaltic pump with adjustable flow rate of up to 52.3 L.h-1. A 100-mL measuring cylinder was at-tached to the recirculation system for flow rate measurements. Hence, the total resulting volume of the reactor (4.3 L) and reservoir (2.9 L) was 7.2 L.
Feeding and discharge were performed using
Prominent® diaphragm pumps, Beta/5 (30 L.h-1) and Concept/0223 (23 L.h-1), respectively, aided by an automation system consisting of RTST/20 Coel® timers. A control unit was used for automate feeding, discharge and recirculation operations.
The reactor was placed in a chamber kept at 30 ± 1 ºC, where the temperature was maintained constant by a system composed of sensor, controller (Novus®, modelo N480), fan and electric resistance.
Inert Support and Inoculum Immobilization
The support used for biomass immobilization consisted of low-density polyethylene (LDPE) pellets obtained from recycled plastic waste, with length of 5 mm and diameter of 3 mm. The bed formed with these LDPE particles had an apparent and real density of 470 and 825 g.L-1, respectively, and a po-rosity of 43%.
The inoculum used in all experiments came from an up-flow anaerobic sludge blanket reactor (UASB) treating wastewater from a poultry slaughterhouse. This inoculum contained a diverse microbial consor-tium for acclimatization, according to the results of Kawagoshi et al. (2005).
The immobilization procedure consisted of im-mersing the LDPE pellets (850 g) for 1 h in 1 L of inoculum with total volatile solids (TVS) and total solids (TS) of 51 and 62 g.L-1, respectively, previ-ously crushed through a sieve (2 mm mesh) to fa-cilitate its retention/distribution throughout the re-actor bed. The excess sludge was removed and the support material was introduced into the reactor.
1) reactor containing immobilized biomass;
2) circulation reservoir; 3) flow rate meter; 4) circulation pump; 5) discharge pump; 6) feed pump;
7) wastewater reservoir; 8) control unit;
9) effluent measuring cylinder collector; 10)biogas outlet.
662 D. A. Santos, J. A. D. Rodrigues, S. M. Ratusznei and M. Zaiat
Sucrose Based Synthetic Wastewater
The composition (mg.L-1), based on 1000 mg COD.L-1, of the synthetic wastewater used in the experiments was: sucrose (C12O22O11) 893.0; urea (CH4N2O) 5.80; nickel sulfate (NiSO4.6H2O) 0.50; ferrous sulfate (FeSO4.7H2O) 2.50; ferric chloride (FeCl3.6H2O) 0.25; calcium chloride (CaCl2.2H2O) 2.06; cobalt chloride (CoCl2.6H2O) 0.04; selenium dioxide (SeO2) 0.04; monobasic potassium phos-phate (KH2PO4) 5.36; dibasic potassium phosphate (K2HPO4) 1.30; dibasic sodium phosphate (Na2HPO4) 2.70; sodium bicarbonate (NaHCO3) 250.0; initial pH adjusted with 12 M hydrochloric acid.
The ratio of the carbon and nitrogen-urea source (C/N) was set at approximately 140 and COD/P ratio at approximately 500 (1000:2) (Leite et al., 2008). Initial influent pH was adjusted so as to maintain the effluent pH near 5. The C/N ratio (g-C/g-N) was calculated according to the mass percentage of the elements carbon and nitrogen in sucrose (glucose-fructose – C12H22O11 – 144g-C/342g-sucrose) and urea (CH4N2O – 28g-N/60g-urea), which were part of the medium, resulting in a C/N ratio of 139.3 g-C/g-N (= 893/5.8 = (893·144/342) / (5.8·28/60) = 376.0/2.7). The C/P ratio (g-C/g-P) was calculated according to the mass percentage of the elements carbon and phos-phorus in sucrose (glucose-fructose – C12H22O11 – 144g-C/ 342g-sucrose) and phosphorus salts (KH2PO4 – 31g-P/136g-KH2PO4; K2HPO4 – 31g-P/174g-K2HP O4; Na2HPO4 – 31g-P/142g-Na2HPO4), which were part of the medium, resulting in C/P ratios: (i) 184.3 g-C/g-P [= (893·144/342) / (5.36·31/136 + 1.30·31/174 + 2.70·31/142) = 376.0/2.04] in terms of C; and (ii) 490.2 g-COD/g-P [= (1000) / (5.36·31/136 + 1.30·31/ 174 + 2.70·31/142) = 1000/2.04] in terms of COD.
Physical-Chemical Analyses and Microbiological Tests
Reactor monitoring was carried out by measuring influent and effluent samples, unfiltered (CCT) and filtered (CCF) organic matter concentration as chemi-cal oxygen demand (COD) and by the Dubois method for determining unfiltered (CST) and filtered (CSF) carbohydrates, bicarbonate alkalinity (BA), total volatile acids (TVA), total solids (TS), total volatile solids (TVS), total suspended solids (TSS), volatile suspended solids (VSS); pH and volume fed/discharged per cycle (Standard Methods for Examination of Water and Wastewater, 1995).
The intermediate compounds of the anaerobic metabolism (acetone, methanol, ethanol, n-butanol, acetic, propionic, butyric, isobutyric, valeric, isovaleric
and caproic acid) were analyzed by an Agilent Technologies 7890 gas chromatograph equipped with a flame ionization detector (FID), automatic injection (head space), GC Sampler 80, and an HP-Innowax column (30 m × 0.25 mm × 0.25 μm). Carrier gas was hydrogen with flow rate of 1.56 mL.min-1. Injector temperature was 250 ºC, injection volume 400 μL and split ratio 10. Oven temperature was programmed as follows: from 35 ºC to 38 ºC at 2 ºC. min-1, from 38 ºC to 75 ºC at 10 ºC.min-1, from 75 ºC to 120 ºC at 35 ºC.min-1, at 120ºC for 1 min, from 120 ºC to 170 ºC at 10 ºC.min-1 and at 170 ºC for 2 min. Detector temperature was 280 ºC with hydrogen flow (fuel) of 30 mL.min-1, synthetic air flow (oxidant) of 300 mL.min-1 and make up (nitrogen) flow of 30 mL.min-1. The head space method was employed in these analyses, using as internal standard crotonic acid (for volatile acids determination) and isobutanol (for determination of acetone and alcohols).
Composition of the biogas generated via an-aerobic degradation was analyzed by gas chro-matography using an Agilent Technologies® 7890 gas chromatograph equipped with thermal conductivity detector (TCD) and GS-Carbonplot column (30 m × 0.53 mm × 3.0 μm). The carrier gas used was argon at 3.67 mL.min-1, the injector temperature was 185 ºC, injection volume 200 μL and split ratio 10. Oven temperature was programmed as follows: 40 °C iso-thermal for 5 min. Detector temperature was 150 ºC, with makeup (argon) flow rate of 8.33 mL.min-1.
Volumetric production was measured with a Ritter Milligacounter gas meter.
Quantification of the biomass inside the reactor was performed at every two experimental conditions to calculate the applied and removed specific organic load.
Microbiological tests were examined under glass slides by means of common optical and fluorescence phase contrast using an Olympus® BX-41-FL-III microscope with a 3.3 MPixel QCOLOR3C digital camera and IMAGE PRO-EXPRESS v. 5.1 image analyzer.
Experimental Procedure
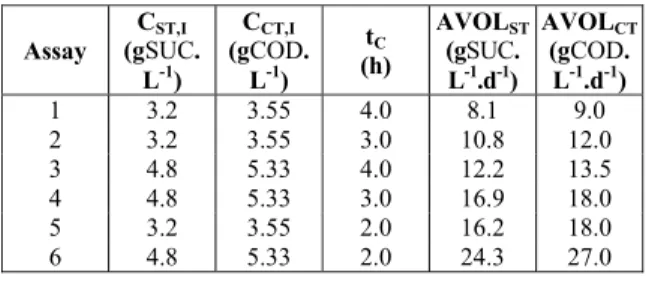
Assays were performed using increasing volumet-ric organic loads, by varying the influent concentra-tion: 3600 and 5200 mgCOD.L-1, and cycle length: 4, 3 and 2 h, i.e., 6, 8 and 12 daily cycles (Table 1). The number of samples used for monitoring was 20 for each experimental condition, over a 30-day testing period.
AnSBBR with Circulation Applied to Biohydrogen Production Treating Sucrose Based Wastewater 663
Brazilian Journal of Chemical Engineering Vol. 31, No. 03, pp. 659 - 674, July - September, 2014
of medium retained in the system, 1.9 L of medium treated per cycle (volume fed at the start of the cycle and discharged at the end of the cycle), 1.8 L of sup-port material, and the remaining 0.9 L for biogas collection (0.2 L at the top of the reactor and 0.7 L at the top of the reservoir).
Table 1: Summary of the investigated experimental
conditions*.
Assay CST,I
(gSUC. L-1)
CCT,I
(gCOD. L-1)
tC
(h)
AVOLST
(gSUC. L-1.d-1)
AVOLCT
(gCOD. L-1.d-1)
1 3.2 3.55 4.0 8.1 9.0 2 3.2 3.55 3.0 10.8 12.0 3 4.8 5.33 4.0 12.2 13.5 4 4.8 5.33 3.0 16.9 18.0 5 3.2 3.55 2.0 16.2 18.0 6 4.8 5.33 2.0 24.3 27.0
* VF = 1.9 ± 0.1 L and VR = 4.5 ± 0.1 L.
Reactor operation (with inert support and inocu-lum) was performed as follows: in the first cycle 4.5 L of medium were fed to the system (2.6 L of medium in the reactor and 1.9 L in the reservoir) for 20 min). After the end of feeding the recirculation flow (20 L.h-1 – recirculation rate of 0.2 cm.s-1) was turned on. At the end of the cycle, of which the duration was a function of the experimental conditions, recir-culation was switched off and 1.9 L of medium was discharged in 10 min, with 2.6 L residual volume held in the reactor (besides the 1.8 L inert support). Immediately after this discharge, a new cycle started, in which 1.9 L of medium was fed in 10 min, and recirculation was turned on. At the end of the cycle, recirculation was stopped and then discharge started, which lasted 10 min. Thus, the cycles were repeated, characterizing the sequencing batch operation.
After reaching stability, verified by the attainment of approximately constant values for the monitored effluent parameters at the end of the cycles, profiles of the following were obtained: filtered organic matter concentrations, total carbohydrates, bicarbonate al-kalinity, total volatile acids, intermediate metabolites (acetone, acids and alcohols), pH and biogas (com-position and production). To obtain the aforemen-tioned profiles, samples were taken at 30-min time intervals during a cycle. The volume collected did not exceed 240 mL, being always 8% below the total volume of wastewater in the reactor. After each op-eration, sludge samples were taken from the reactor for microbiological analysis.
The experimental results obtained from the sys-tem monitoring and from the profiles at each oper-ating condition were analyzed considering the effect
of the investigated variables on process stability and performance, as well as the different hydrogen pro-duction indicators. The microbiological analyses allowed assessment of microbial morphology.
Theoretical
The organic matter removal efficiencies for un-filtered (εCT) and filtered (εCF) samples were calcu-lated by Equation (1), in which CCT,I is the concen-tration of total organic matter (COD) in the influent, CCT and CCF are organic matter concentrations for unfiltered and filtered samples in the effluent, respectively.
CT,I CT CT
CT,I
CT,I CF CF
CT,I
C C
(%) 100
C
C C
(%) 100
C −
ε = ⋅
−
ε = ⋅
(1)
The organic matter removal efficiencies based on carbohydrates (sucrose) for unfiltered (εST – CST,I and CST) and filtered (εSF – CST,I and CSF) samples were calculated in a similar way (Equation (2)).
ST,I ST ST
ST,I
ST,I SF SF
ST,I
C C
(%) 100
C
C C
(%) 100
C −
ε = ⋅
−
ε = ⋅
(2)
Equation (3) was used to calculate the applied volumetric organic load (AVOLST or AVOLCT), ex-pressed as kgSUC.m-3.d-1 or kgCOD.m-3.d-1, respec-tively, defined as the amount of carbohydrate (su-crose) or organic matter (measured as COD) applied to the reactor per unit time and per reactor medium volume, where VF is the volume of wastewater fed in the cycle, N is the number of cycles per day and VR is the volume of liquid medium in the reactor.
(
)
(
)
F ST,I ST
R
F CT,I CT
R
V N C
AVOL
V
V N C
AVOL
V
⋅ ⋅
=
⋅ ⋅
=
(3)
re-664 D. A. Santos, J. A. D. Rodrigues, S. M. Ratusznei and M. Zaiat
spectively, defined as the amount of carbohydrate (sucrose) or organic matter (COD) applied to the reactor per unit time and per mass of total volatile solids in the reactor, where MTVS is the mass of total volatile solids in the reactor.
(
)
(
)
F ST,I ST TVS F CT,I CT TVSV N C
ASOL
M
V N C
ASOL M ⋅ ⋅ = ⋅ ⋅ = (4)
The removed volumetric organic load (RVOLSF or RVOLCF), expressed as kgSUC.m-3.d-1 or kgCOD. m-3.d-1, respectively, for filtered samples, defined as the amount of carbohydrate (sucrose) or organic matter (measured as COD) removed by the reactor per unit time and per reactor medium volume, was calculated by Equation (5).
(
)
(
)
(
)
(
)
F ST,I SF SF
R
F CT,I CF CF
R
V N C C
RVOL
V
V N C C
RVOL V ⋅ ⋅ − = ⋅ ⋅ − = (5)
The removed specific organic load (RSOLSF or RSOLCF), expressed as kgSUC.gTVS
-1
.d-1 or kgCOD.gTVS-1.d-1, respectively, for filtered samples, defined as the amount of carbohydrate (sucrose) or organic matter (measured as COD) removed by the reactor per unit time and per mass of total volatile solids in the reactor, was calculated by Equation (6).
(
)
(
)
(
)
(
)
F ST,I SF SF
TVS
F CT,I CF CF
TVS
V N C C
RSOL
M
V N C C
RSOL M ⋅ ⋅ − = ⋅ ⋅ − = (6)
Equation (7) was used to calculate the molar pro-ductivity (MPr), expressed as molH2.m-3.d-1, defined by the ratio between hydrogen produced per unit time (
2
H
n ) and the volume of liquid medium in the
reactor (VR), where nH2is the number of moles of hydrogen produced during the cycle. Equation (8) was used to calculate the specific molar productivity (SMPr), expressed as molH2.kgTVS-1.d-1, defined by the ratio between hydrogen produced per unit time
( 2
H
n ) and the mass of total volatile solids inside the
reactor (MTVS).
2
H
R N . n M Pr
V
= (7)
2
H
TVS N . n SM Pr
M
= (8)
The molar yield per applied load (MYALS,m or MYALC,m), expressed as molH2.kgSUC-1 or molH2.kgCOD-1, respectively, for unfiltered samples, defined by the relation between the hydrogen pro-duced per unit time (nH2) and the applied organic matter based on carbohydrate (sucrose) or organic matter (measured as COD), was calculated by Equation (9). 2 2 H S,m F ST,I H C,m F CT,I n MYAL
N . V . C
n MYAL
N . V . C =
=
(9)
The molar yield per removed load (MYRLS,m or MYRLC,m), expressed as molH2.kgSUC-1 or molH2.kgCOD-1, respectively, for filtered samples, defined by the relation between the hydrogen produced per unit time (
2
H
n ) and the applied
organic matter based on carbohydrate (sucrose) or organic matter (measured as COD), was calculated by Equation (10).
(
)
(
)
2 2 H S,mF ST,I SF
H C,m
F CT,I CF n
MYRL
N . V . C C
n MYRL
N . V . C C
=
−
=
−
(10)
RESULTS AND DISCUSSION
AnSBBR with Circulation Applied to Biohydrogen Production Treating Sucrose Based Wastewater 665
Brazilian Journal of Chemical Engineering Vol. 31, No. 03, pp. 659 - 674, July - September, 2014
5/6 – same cycle length). In the biogas samples only hydrogen and carbon dioxide were detected, i.e., no methane was detected under the experimental condi-tions (detection limit of 0.01 mmol.L-1).
The average value of total volatile solids in the bed (MTVS) was 23 ± 2 gTVS and of support material (MSupport) was 1536 g-support, resulting in specific (C'X-TVS) and volumetric (CX-TVS) biomass concentra-tion of 0.015 ± 0.002 gTVS.gsupport-1 and 5.1 ± 0.3 gTVS.L-1, respectively, for a volume fed per cycle (VF) of 1.9 ± 0.1 L and total liquid medium in the reactor (VR) of 4.5 ± 0.1 L.
The biomass inside the reactor presented en-dospores under all conditions and no significant dif-ferences in biomass between conditions was de-tected. The presence of endospores and the presence of metabolites in the effluent such as ethanol, acetic acid and butyric acid, accompanied by the pro-duction of hydrogen gas indicate fermentation bybacteria of the genus Clostridium (Lin et al, 2007).
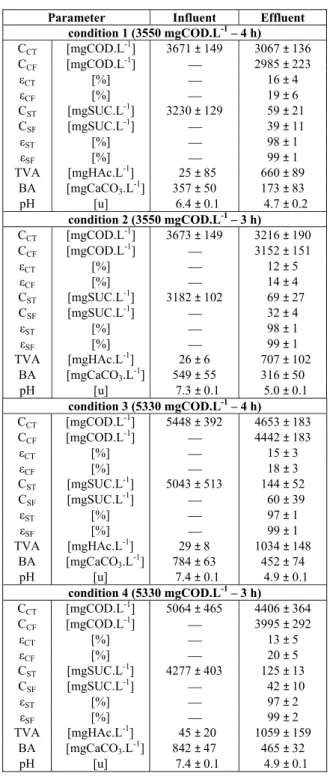
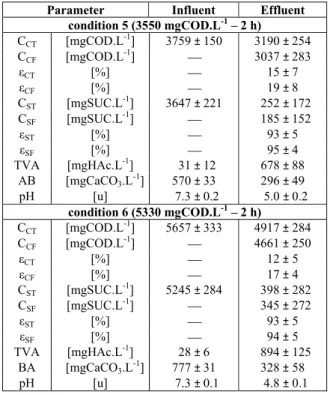
Organic Matter (COD and Carbohydrate) Removal
The results obtained for the six different experi-mental conditions contained in Table 2 showed that the average removal efficiency of organic matter (COD) for filtered samples was 18% while stability was maintained throughout the experimental phase. It can be observed that different applied volumetric organic loads from the different cycle lengths (with the same influent concentration) and different influ-ent concinflu-entrations (with the same cycle length) did not affect COD removal, since the organic matter was converted into intermediates, resulting in re-duced COD removal under all conditions.
The behavior of influent and effluent carbohy-drate (sucrose) concentration under all conditions showed that nearly all sucrose introduced into the reactor was consumed, giving rise to intermediate acids and alcohols resultant from acidogenesis. Average carbohydrate conversion efficiency during the experimental period was 98%, which demon-strates efficient and stable acidogenesis throughout the experimental phase. The high organic loads from conditions 5 and 6 caused a slight reduction in car-bohydrate conversion efficiency from 99% to 95% and 94%, respectively.
Thus, under all experimental conditions the car-bohydrate conversion efficiency remained high and approximately constant and was not significantly influenced by the applied organic load (which was different depending on cycle length and influent concentration). The results obtained in this work (AVOLC of 8.2-26.6 kgCOD.m-3.d-1) may be
com-pared with Cheong et al. (2006), Vijaya Bhaskar et al. (2008), Chen et al. (2009) and Sreethawong et al.
(2010) who used an ASBR treating a synthetic sub-strate (glucose or sucrose) to produce biohydrogen with AVOLC of 32-128, 6.3-7.9, 22.1 and 10-56 kgCOD.m-3.d-1, respectively.
Table 2:Values of the monitored variables in
con-ditions 1 to 6.
Parameter Influent Effluent
condition 1 (3550 mgCOD.L-1 – 4 h)
CCT [mgCOD.L-1] 3671 ± 149 3067 ± 136
CCF [mgCOD.L-1] ⎯ 2985 ± 223
εCT [%] ⎯ 16 ± 4
εCF [%] ⎯ 19 ± 6
CST [mgSUC.L-1] 3230 ± 129 59 ± 21
CSF [mgSUC.L-1] ⎯ 39 ± 11
εST [%] ⎯ 98 ± 1
εSF [%] ⎯ 99 ± 1
TVA [mgHAc.L-1] 25 ± 85 660 ± 89 BA [mgCaCO3.L-1] 357 ± 50 173 ± 83
pH [u] 6.4 ± 0.1 4.7 ± 0.2
condition 2 (3550 mgCOD.L-1 – 3 h)
CCT [mgCOD.L-1] 3673 ± 149 3216 ± 190
CCF [mgCOD.L-1] ⎯ 3152 ± 151
εCT [%] ⎯ 12 ± 5
εCF [%] ⎯ 14 ± 4
CST [mgSUC.L-1] 3182 ± 102 69 ± 27
CSF [mgSUC.L-1] ⎯ 32 ± 4
εST [%] ⎯ 98 ± 1
εSF [%] ⎯ 99 ± 1
TVA [mgHAc.L-1] 26 ± 6 707 ± 102 BA [mgCaCO3.L-1] 549 ± 55 316 ± 50
pH [u] 7.3 ± 0.1 5.0 ± 0.1
condition 3 (5330 mgCOD.L-1 – 4 h)
CCT [mgCOD.L-1] 5448 ± 392 4653 ± 183
CCF [mgCOD.L-1] ⎯ 4442 ± 183
εCT [%] ⎯ 15 ± 3
εCF [%] ⎯ 18 ± 3
CST [mgSUC.L-1] 5043 ± 513 144 ± 52
CSF [mgSUC.L-1] ⎯ 60 ± 39
εST [%] ⎯ 97 ± 1
εSF [%] ⎯ 99 ± 1
TVA [mgHAc.L-1] 29 ± 8 1034 ± 148 BA [mgCaCO3.L-1] 784 ± 63 452 ± 74
pH [u] 7.4 ± 0.1 4.9 ± 0.1
condition 4 (5330 mgCOD.L-1 – 3 h)
CCT [mgCOD.L-1] 5064 ± 465 4406 ± 364
CCF [mgCOD.L-1] ⎯ 3995 ± 292
εCT [%] ⎯ 13 ± 5
εCF [%] ⎯ 20 ± 5
CST [mgSUC.L-1] 4277 ± 403 125 ± 13
CSF [mgSUC.L-1] ⎯ 42 ± 10
εST [%] ⎯ 97 ± 2
εSF [%] ⎯ 99 ± 2
TVA [mgHAc.L-1]
45 ± 20 1059 ± 159 BA [mgCaCO3.L-1] 842 ± 47 465 ± 32
pH [u] 7.4 ± 0.1 4.9 ± 0.1
666 D. A. Santos, J. A. D. Rodrigues, S. M. Ratusznei and M. Zaiat
Continuation Table 2
Table 2:Values of the monitored variables in
con-ditions 1 to 6.
Parameter Influent Effluent
condition 5 (3550 mgCOD.L-1 – 2 h)
CCT [mgCOD.L-1] 3759 ± 150 3190 ± 254
CCF [mgCOD.L-1] ⎯ 3037 ± 283
εCT [%] ⎯ 15 ± 7
εCF [%] ⎯ 19 ± 8
CST [mgSUC.L-1] 3647 ± 221 252 ± 172
CSF [mgSUC.L-1] ⎯ 185 ± 152
εST [%] ⎯ 93 ± 5
εSF [%] ⎯ 95 ± 4
TVA [mgHAc.L-1] 31 ± 12 678 ± 88 AB [mgCaCO3.L-1] 570 ± 33 296 ± 49
pH [u] 7.3 ± 0.2 5.0 ± 0.2
condition 6 (5330 mgCOD.L-1 – 2 h)
CCT [mgCOD.L-1] 5657 ± 333 4917 ± 284
CCF [mgCOD.L-1] ⎯ 4661 ± 250
εCT [%] ⎯ 12 ± 5
εCF [%] ⎯ 17 ± 4
CST [mgSUC.L-1] 5245 ± 284 398 ± 282
CSF [mgSUC.L-1] ⎯ 345 ± 272
εST [%] ⎯ 93 ± 5
εSF [%] ⎯ 94 ± 5
TVA [mgHAc.L-1] 28 ± 6 894 ± 125 BA [mgCaCO3.L-1] 777 ± 31 328 ± 58
pH [u] 7.3 ± 0.1 4.8 ± 0.1
Biogas (H2 and CO2 with no CH4) Production
Analysis of the biogas production (Table 3) shows that the increase in applied volumetric organic load, obtained by reducing cycle length at constant influ-ent concinflu-entration (conditions 1/2/5 and 3/4/6 - 50% reduction in cycle length), resulted in approximately the same value as conditions 1/2/5 (lower influent concentration) and increased biogas production for conditions 3/4/6 (higher influent concentration) (952/ 836/939 and 1285/1489/1619 NmL.cycle-1). When the increase in applied organic volumetric load was due to the increase in influent concentration at constant cycle length (condition 1/3, 2/4 and 5/6 - 50% increase in influent concentration), this also resulted in in-creased biogas production (952/1285, 836/1489 and 939/1619 NmL.cycle-1), but with higher intensity, i.e., biogas production was more sensitive to influent concentration than to cycle length.
Comparing conditions 4/5 (1489/939 NmL.cycle-1), in which applied volumetric organic load is the same, but condition 5 was performed with lower influent concentration and cycle length in relation to condition 4, there was increased biogas production in condition 4, i.e., the reduction in cycle length with a proportional reduction in influent concentration (so
as to maintain the same volumetric organic load) did not favor biogas production.
Analysis of biogas composition (Table 3) enabled identification of the fractions of each constituent and allowed correlation of these fractions with the volumes obtained; an average value of 37% was obtained for hydrogen, i.e., the applied volumetric load did not influence hydrogen content in the formed biogas. As a result, when the increase in applied volumetric organic load was due to the reduction in cycle length, maintaining influent concentration (conditions 1/2/4 and 3/4/6 - 50% reduction in cycle length), biohy-drogen content also remained approximately con-stant (average of 36% and standard deviation of 2%). When the applied volumetric organic load increased due to increasing influent concentration at constant cycle length (condition 1/3, 2/4 and 5/6 - 50% in-crease in influent concentration), biohydrogen con-tent also remained approximately constant.
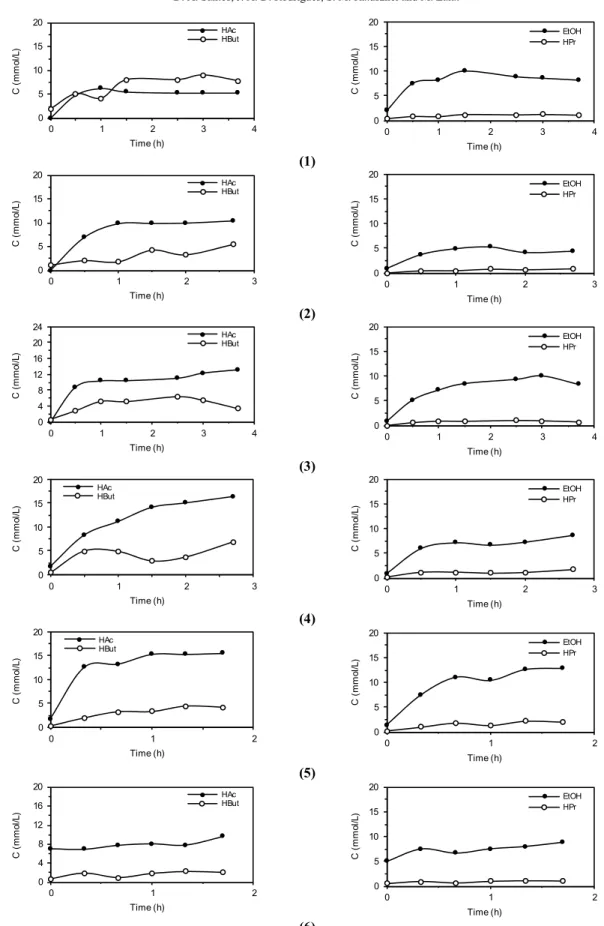
The main metabolites produced during operation (Table 3) were acetic acid, ethanol and butyric acid, produced in a similar manner during the entire op-eration. It can be observed that the major metabolite derived from the conversion of sucrose to produce biohydrogen was acetic acid.
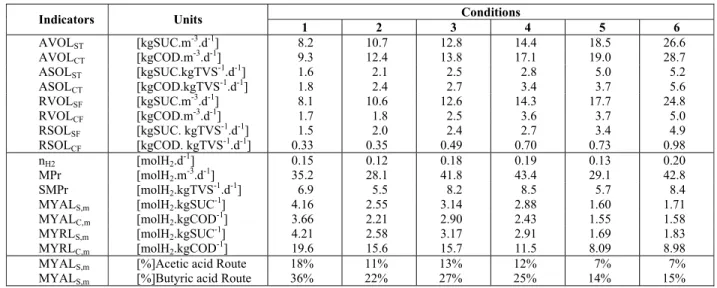
Hydrogen Productivity and Yield
Table 4 contains the biohydrogen production in-dicators for all experimental conditions: applied/ removed and volumetric/specific organic load, molar production, volumetric/specific molar productivity and yield per applied/removed organic load. It can be inferred that biohydrogen production (nH2) should not be used because the results indicate that the applied load does not systematically alter biohydro-gen production. Such behavior can be attributed to the fact that the engineering factors involved in the different conditions were not included in this parameter.
In this context, biohydrogen productivity indica-tors in volumetric (MPr) and specific (SMPr) terms contain in the biohydrogen production value the bio-reactor volume (MPr) and the amount of biomass in the bioreactor (SMPr), respectively.
AnSBBR with Circulation Applied to Biohydrogen Production Treating Sucrose Based Wastewater 667
Brazilian Journal of Chemical Engineering Vol. 31, No. 03, pp. 659 - 674, July - September, 2014
Table 3:Concentration of compounds in conditions 1 to 6*.
Molar fraction (%) Compounds
1 2 3 4 5 6
Acetone - - -
Methanol - - -
Ethanol 29.0 24.6 27.5 24.1 25.8 29.1
n-Butanol 0.4 0.3 0.2 0.3 0.2 0.3
Acetic acid 43.0 43.4 45.9 49.1 46.0 43.9
Propionic acid 3.7 3.8 3.9 5.1 5.0 4.6
Isobutyric acid 3.8 4.3 3.4 2.9 3.6 3.8
Butyric acid 13.7 15.6 12.2 12.3 12.1 12.6
Isovalyric acid 0.4 0.4 0.3 0.3 0.3 0.3
Valyric acid 1.6 1.7 1.2 1.5 2.1 1.7
Caproic acid 4.4 5.9 5.4 4.4 4.9 3.7
Total concentration (mmol.L-1) 28.2 26.7 29.1 29.2 28.2 28.5
H2(%) 36 34 37 32 38 37
CH4(%) 0 0 0 0 0 0
CO2(%) 64 66 63 68 61 63
CH2 (mmol.L-1) 7.8 6.1 9.1 7.2 7.0 9.8
VG (NmL.cycle-1) 952 836 1285 1489 939 1619
*Average standard deviation: 6.8% (intermediates), 2% (biogas concentration), 0.4 mmol.L-1
(hydrogen concentration), and 34 NmL.cycle-1 for 6 samples in each condition.
Table 4: Performance indicators in conditions 1 to 6*.
Conditions Indicators Units
1 2 3 4 5 6
AVOLST [kgSUC.m-3.d-1] 8.2 10.7 12.8 14.4 18.5 26.6
AVOLCT [kgCOD.m-3.d-1] 9.3 12.4 13.8 17.1 19.0 28.7
ASOLST [kgSUC.kgTVS-1.d-1] 1.6 2.1 2.5 2.8 5.0 5.2
ASOLCT [kgCOD.kgTVS-1.d-1] 1.8 2.4 2.7 3.4 3.7 5.6
RVOLSF [kgSUC.m-3.d-1] 8.1 10.6 12.6 14.3 17.7 24.8
RVOLCF [kgCOD.m-3.d-1] 1.7 1.8 2.5 3.6 3.7 5.0
RSOLSF [kgSUC. kgTVS-1.d-1] 1.5 2.0 2.4 2.7 3.4 4.9
RSOLCF [kgCOD. kgTVS-1.d-1] 0.33 0.35 0.49 0.70 0.73 0.98
nH2 [molH2.d-1] 0.15 0.12 0.18 0.19 0.13 0.20
MPr [molH2.m-3.d-1] 35.2 28.1 41.8 43.4 29.1 42.8
SMPr [molH2.kgTVS-1.d-1] 6.9 5.5 8.2 8.5 5.7 8.4
MYALS,m [molH2.kgSUC-1] 4.16 2.55 3.14 2.88 1.60 1.71
MYALC,m [molH2.kgCOD-1] 3.66 2.21 2.90 2.43 1.55 1.58
MYRLS,m [molH2.kgSUC-1] 4.21 2.58 3.17 2.91 1.69 1.83
MYRLC,m [molH2.kgCOD-1] 19.6 15.6 15.7 11.5 8.09 8.98
MYALS,m [%]Acetic acid Route 18% 11% 13% 12% 7% 7%
MYALS,m [%]Butyric acid Route 36% 22% 27% 25% 14% 15%
Acetic acid Route: C12H22O11+5H2OÆ4CH3COOH+4CO2+8H2; MYALS,n=8 molH2.molSUC-1
; MYALS,m=23.4 molH2.kgSUC-1 Butyric acid Route: C12H22O11+2H2OÆ2CH3CH2CH2COOH+4CO2+4H2; MYALS,n=4 molH2.molSUC-1
; MYALS,m=11.7 molH2.kgSUC-1 * C'X-TVS = 0.015 ± 0.002 gTVS.gsupport-1
and CX-TVS= 5.1 ± 0.3 gTVS.L-1
Vijaya Bhaskar et al. (2008), Chen et al. (2009) and Sreethawong et al. (2010) obtained MPr of 5.2-11.9, 63-106 and 18-332 molH2.m-3.d-1, respectively. Thus, the reactor in this work (28.1-43.4 molH2.m-3.d-1) under some conditions performed better and under others worse than those in the cited literature, indi-cating that this configuration may be interesting for application in biohydrogen production.
Indicators based on the applied load, both the ap-plied organic loading rate (COD - MYALC,n) and the
668 D. A. Santos, J. A. D. Rodrigues, S. M. Ratusznei and M. Zaiat
load was due to the increase in influent concentration at constant cycle length (condition 1/3, 2/4 5/6 - 50% increase in influent concentration: 4.16/3.14, 2.55/2.88 and 1.60/1.71 molH2.kgSUC-1), biohydrogen produc-tion was higher at the lowest influent concentraproduc-tion when the cycle length was 4 hours, i.e., was the longest. However, this behavior was the opposite for cycle lengths of 3 and 2 hours; at these cycle lengths the highest biohydrogen yield occurred at the highest influent concentration.
It is noteworthy that this reversal of behavior oc-curred with values very close to those of hydrogen production. Comparing conditions 4 and 5 (2.88/1.60 molH2.kgSUC-1), i.e. the same applied load with lower influent concentration and shorter cycle length, biohydrogen yield increased for condition 4. Thus, the reduction in cycle length with a propor-tional reduction in influent concentration (and the same organic loading rate) seems not to favor biogas production. Comparing these results (MYALC 1.6-4.2 molH2.kgSUC-1) with Cheong et al. (2006), Vijaya Bhaskar et al., (2008), Chen et al. (2009) and Sreethawong et al. (2010), who obtained MYALC of 0.8-4.7, 0.7-1.9, 2.8-4.7 and 1.8-8.3, respectively, the performance of the AnSBBR used can be considered satisfactorily.
The indicator based on removed volumetric or-ganic load (COD - MYRLC,n) should not be consid-ered due to the approximately constant behavior and low value of organic matter removal (COD) under all conditions, regardless of the applied load. At this point it is important to mention the result obtained by Bhaskar (2008), who studied biohydrogen produc-tion from synthetic effluent under acidogenic an-aerobic conditions by varying the applied organic load in the system from 6.3 to 7.9 kgCOD.m3.d-1 and obtaining a reduction in MYRLC,n from 13.4 to 6.1 molH2.kgCOD
-1 .
The indicator based on removed carbohydrate load (sucrose – MYRLS,n) is possibly the most ap-propriate indicator for analysis of system perform-ance, as it quantifies biohydrogen production in terms of effectively consumed substrate, showing a relationship between the production of the product of interest (biohydrogen) and consumption of available reagent (sucrose). However, the results were analo-gous to those for the indicator based on applied car-bohydrate load because, undert all conditions, the removal of carbohydrates was similar and high, and no significantly different values were observed when the applied loads changed. Thus, when the applied load was increased due to the reduction in cycle length at constant influent concentration (1/2/5 and 3/4/6 conditions - 50% reduction in cycle length:
4.21/2.58/1.69 and 3.17/2.19/1.83 molH2.kgCOD -1
), biohydrogen production increased for the longer cycle.
When the applied load was increased with in-creasing influent concentration at constant cycle length (conditions 1/3, 2/4 5/6 - 50% increase in the influent concentration: 4.21/3.17, 2.58/2.91 and 1.69/1.83 molH2.kgCOD-1), the behavior was similar to the above, i.e., biohydrogen production was higher at the lowest influent concentration for the 4-h cycle, i.e., the longest cycle. However, this behavior was reversed for 2 and 3-h cycle lengths, i.e., at these cycle lengths the highest biohydrogen production occurred at the highest influent concentration, noting that this reversal of behavior occurred at similar hy-drogen production values. Comparing conditions 4/5 (2.91/1.69 molH2.kgCOD-1), i.e., same applied load but lower influent concentration and cycle length in condition 5 in relation to condition 4, there is in-creased production of biohydrogen in condition 4, i.e., a reduction in cycle length with a proportional reduction in influent concentration (and the same organic loading rate) seems not to favor biogas pro-duction.
Considering the theoretical yield of the produc-tion route of acetic and butyric acids (Table 4), the reactor performance reached a maximum of 18% when using the acetic acid pathway and 36% when using the butyric acid pathway in condition 1, i.e., the values obtained were below the maximum yield observed in other synthetic wastewater treatments, but remained within the same order of magnitude (Cheong et al., 2006; Vijaya Bhaskar et al., 2008; Chen et al., 2009; Sreethawong et al., 2010).
Profiles Along the Cycle
AnSBBR with Circulation Applied to Biohydrogen Production Treating Sucrose Based Wastewater 669
Brazilian Journal of Chemical Engineering Vol. 31, No. 03, pp. 659 - 674, July - September, 2014
0 500 1000 1500 2000 2500 3000
0 1 2 3 4
CSF (m g S UC/ L ) Time (h) 0 500 1000 1500 2000 2500 3000
0 1 2 3
CSF (m g S UC/ L ) Time (h) (1) (2) 0 500 1000 1500 2000 2500 3000
0, 0 1, 0 2, 0 3, 0 4, 0
CSF (mg S U C /L ) Time (h) 0 500 1000 1500 2000 2500 3000
0 1 2 3
CSF (mg S U C /L ) Time (h) (3) (4) 0 500 1000 1500 2000 2500 3000
0 1 2
CSF (m g S U C /L ) Time (h) 0 500 1000 1500 2000 2500 3000
0 1 2
CSF (m g S U C /L ) Time (h) (5) (6)
Figure 2: Profiles of sucrose concentration along the cycles under all conditions.
0 10 20 30 40 50 60 70
0 1 2 3 4
NG (mm o l) Time (h) 0 10 20 30 40 50 60 70
0 1 2 3
NG (m m o l) Time (h) (1) (2) 0 10 20 30 40 50 60 70
0 1 2 3 4
NG (mm o l) Time (h) 0 10 20 30 40 50 60 70
0 1 2 3
NG (mmo l) Time (h) (3) (4) 0 10 20 30 40 50 60 70
0 1 2
NG (mmo l) Time (h) 0 10 20 30 40 50 60 70
0 1 2
NG
(mmo
l)
Time (h)
(5) (6)
Figure 3: Profiles of biogas quantity along the cycles under all conditions
670 D. A. Santos, J. A. D. Rodrigues, S. M. Ratusznei and M. Zaiat 0 5 10 15 20
0 1 2 3 4
C ( m m o l/ L ) Time (h) HAc HBut 0 5 10 15 20
0 1 2 3 4
C ( m m o l/ L ) Time (h) EtOH HPr (1) 0 5 10 15 20
0 1 2 3
C (m m o l/ L ) Time (h) HAc HBut 0 5 10 15 20
0 1 2 3
C ( m m o l/ L ) Time (h) EtOH HPr (2) 0 4 8 12 16 20 24
0 1 2 3 4
C (m m o l/ L ) Time (h) HAc HBut 0 5 10 15 20
0 1 2 3 4
C ( m m o l/ L ) Time (h) EtOH HPr (3) 0 5 10 15 20
0 1 2 3
C ( m m o l/ L ) Time (h) HAc HBut 0 5 10 15 20
0 1 2 3
C ( m m o l/ L ) Time (h) EtOH HPr (4) 0 5 10 15 20
0 1 2
C ( m m o l/ L ) Time (h) HAc HBut 0 5 10 15 20
0 1 2
C ( m m o l/ L ) Time (h) EtOH HPr (5) 0 4 8 12 16 20
0 1 2
C ( m m o l/ L ) Time (h) HAc HBut 0 5 10 15 20
0 1 2
C (mmo l/ L ) Time (h) EtOH HPr (6)
AnSBBR with Circulation Applied to Biohydrogen Production Treating Sucrose Based Wastewater 671
Brazilian Journal of Chemical Engineering Vol. 31, No. 03, pp. 659 - 674, July - September, 2014
Figure 2 shows the decrease in carbohydrates due to microorganism consumption and Figure 3 shows the formation of biogas, specifically formation of hydrogen and non-formation of methane, where it can be seen that the influent concentration has a stronger effect than cycle length on comparing Con-ditions 1/3, 2/4 and 5/6 (different influent concentra-tion and same cycle length) and Condiconcentra-tions 1/2/5 and 3/4/6 (different cycle length and same influent con-centration). Thus, increasing influent concentration is more effective in obtaining higher initial concen-tration than decreasing cycle length, which accounts for the higher carbohydrate consumption and hydro-gen formation rates.
This behavior is in accordance with the previous discussion on reactor performance, indicating that the best productivity tends to occur at higher organic loads (high influent concentration and low cycle length) as this parameter involves “biochemical generation" of biogas (hydrogen) and the best yield tends to occur at lower organic loads (low influent concentra-tion and high cycle length) because this parameter involves "biochemical consumption" of the substrate.
Figure 3 shows the formation of acetic, propionic, butyric/iso-butyric acids and ethanol, where no clear effect can be seen of influent concentration (Condi-tions 1/3, 2/4 and 5/6) and cycle length (Condi(Condi-tions 1/2/5 and 3/4/6). However, it can be seen that the formation of acetic acid was higher in relation to butyric and especially to propionic acid, and that a significant amount of ethanol was present throughout the cycle, which might have reduced the process yield. The reason is probably due to the substrate up-take rate characteristics (simple biodegradation). However, research using glucose and lactose, i.e., other simple substrates but with different up-take rate characteristics, is necessary for more insight into features of the metabolism.
CONCLUSIONS
The results showed that, in general, it is possible to produce biohydrogen with an AnSBBR with liquid phase recirculation treating sucrose based syn-thetic wastewater. The system maintained an organic matter (COD) conversion efficiency in the range of 12-20% and a carbohydrate (sucrose) conversion ef-ficiency in the range of 93-99% throughout the ex-perimental conditions, i.e., applied and removed or-ganic loads (or influent concentration and cycle length) did not influence system performance. High concentrations of the major volatile acids such as acetic and butyric acids, and of ethanol were obtained
in all experimental conditions. Biogas composition under the experimental conditions ranged from 32-39% H2 (6.1-9.8 mmolH2.L-1) with no CH4. The influence of removed specific organic load (RSOL) on specific molar productivity (SMPr) and molar yield (MYRL) indicated that the influent concentra-tion exerted a stronger effect than cycle length. The experimental conditions 4 and 6 (higher influent concentration and intermediate/shorter cycle length) and condition 1 (lower influent concentration and longer cycle) showed the best results in terms of MPr and MYRL, respectively.
ACKNOWLEDGMENTS
This study was supported by the Fundação de Amparo à Pesquisa do Estado de São Paulo – FAPESP (São Paulo, Brasil), process numbers 09/15.984-0 and 10/03.874-3 (D.A. Santos). The authors gratefully acknowledge Dr. Baltus C. Bonse for the revision of this paper.
NOTATION
ASOLCT Applied specific organic load based on organic matter – non-filtered sample [kgCOD.m-3.d-1]
ASOLST Applied specific organic load based on carbohydrate (sucrose) – non-filtered sample [kgSUC.m-3.d-1]
AVOLCT Applied volumetric organic load based on organic matter – non-filtered sample [kgCOD.m-3.d-1]
AVOLST Applied volumetric organic load based on carbohydrate (sucrose) – non-filtered sample [kgSUC.m-3.d-1]
BA Bicarbonate alkalinity [mgCaCO3.L -1
] CCF Concentration based on organic matter for
filtered samples in the effluent [mgCOD.L-1]
CCT Concentration based on organic matter for unfiltered samples in the effluent
[mgCOD.L-1]
CCT,I Concentration based on organic matter for unfiltered samples in the influent
[mgCOD.L-1]
CH2 Concentration of hydrogen [mmol.L-1] CSF Concentration based on carbohydrates
(sucrose) for filtered samples in the effluent [mgSUC.L-1 or mmolSUC.L-1] CST Concentration based on carbohydrates
672 D. A. Santos, J. A. D. Rodrigues, S. M. Ratusznei and M. Zaiat
effluent [mgSUC.L-1]
CST,I Concentration based on carbohydrates (sucrose) for unfiltered samples in the influent [mgSUC.L-1]
CCF Concentration based on organic matter for filtered samples[mgCOD.L-1]
CX-TVS Concentration of biomass in the reactor in total volatile solids per volume of liquid [gTVS.L-1]
C'X-TVS Concentration of biomass in the reactor in total volatile solids per mass of support [gTVS.g-support-1]
MTVS Total biomassin the reactor in total volatile solids[gTVS]
MPr Daily molar productivity of hydrogen [molH2.m-3.d-1]
MYALC,m Molar yield per applied load based on organic matter expressed as kg [molH2.kgCOD
-1 ]
MYALC,n Molar yield per applied load based on organic matter expressed as mole [molH2.molCOD-1]
MYALS,m Molar yield per applied load based on carbohydrates (sucrose) expressed as kg [molH2.kgSUC-1]
MYALS,n Molar yield per applied load based on carbohydrates (sucrose) expressed as mole [molH2.molSUC-1]
MYRLC,m Molar yield per removed load based on organic matter expressed as kg
[molH2.kgCOD-1]
MYRLC,n Molar yield per removed load based on organic matter expressed as mole [molH2.molCOD-1]
MYRLS,m Molar yield per removed load based on carbohydrates (sucrose) expressed as kg [molH2.kgSUC-1]
MYRLS,n Molar yield per removed load based on carbohydrates (sucrose) expressed as mole [molH2.molSUC-1]
N Number of cycles a day
NG molar quantity of biogas (H2, CO2 and CH4) produced along a cycle (mmol) nH2 Daily molar production of hydrogen
[mol.d-1]
RSOLCF Removed volumetric specific load based on organic matter – filtered sample [kgCOD.gTVS-1.d-1]
RSOLSF Removed volumetric specific load based on carbohydrate (sucrose) – filtered sample [kgSUC.gTVS-1.d-1]
RVOLCF Removed specific organic load based on organic matter – filtered sample
[kgCOD.m-3.d-1]
RVOLSF Removed specific organic load based on carbohydrates (sucrose) – filtered sample [kgSUC.m-3.d-1]
SMPr Daily specific molar productivity of hydrogen [molH2.kgTVS-1.d-1] tC Cycle length [h.cycle-1]
TS Total solids concentration [mg.L-1] TSS Total suspended solids concentration
[mg.L-1]
TVA Total volatile acids [mgHAC.L-1]
TVS Total volatile solids concentration [mg.L-1] VSS Volatile suspended solids concentration
[mg.L-1]
VF Volume of wastewater fed during the cycle [L.cycle-1]
VG normal volume of biogas (H2, CO2 and CH4) produced along a cycle (NmL) VR Volume of liquid medium in the reactor
[L]
εCF Removal efficiency based on organic matter for filtered samples[%]
εCT Removal efficiency based on organic matter for unfiltered samples [%]
εSF Removal efficiency based on carbohydrates (sucrose) for filtered samples [%]
εST Removal efficiency based on
carbohydrates (sucrose) for unfiltered samples[%]
HAC Acetic acid
HBut Butyric acid
HPr Propionic acid
EtOH Ethanol
REFERENCES
Alzate-Gaviria, L. M., Sebastian, P. J., Pérez-Hernández, A., Eapen, D., Comparison of two anaerobic systems for hydrogen production from the organic fraction of municipal solid waste and synthetic wastewater. International Journal of Hydrogen Energy, v. 32, p. 3141-3146 (2007). Arooj, M., Han, S., Kim, S., Kim, D., Shin, H.,
Ef-fect of HRT on ASBR converting starch into bio-logical hydrogen. International Journal of Hy-drogen Energy, v. 33(22), p. 6509-6514 (2008). Badiei, M., Jahim, J. M., Anuar, N., Sheikh Abdullah,
S. R., Effect of hydraulic retention time on biohy-drogen production from palm oil mill effluent in anaerobic sequencing batch reactor. International Journal of Hydrogen Energy, v. 36, p. 5912-5919 (2011).
AnSBBR with Circulation Applied to Biohydrogen Production Treating Sucrose Based Wastewater 673
Brazilian Journal of Chemical Engineering Vol. 31, No. 03, pp. 659 - 674, July - September, 2014
Canto, C. S. A., Zaiat, M., Effect of organic load on the performance and methane production of an AnSBBR treating effluent from biodiesel produc-tion. Applied Biochemistry and Biotechnology, v. 165, p. 347-368 (2011).
Chen, W., Sung, S., Chen, S., Biological hydrogen production in an anaerobic sequencing batch re-actor: pH and cyclic duration effects. Interna-tional Journal of Hydrogen Energy, v. 34, p. 227-234 (2009).
Cheong, D.-Yeol., Hansen, C. L., Stevens, D. K., Production of bio-hydrogen by mesophilic an-aerobic fermentation in an acid-phase sequencing batch reactor. Biotechnology, v. 96, p. 421-432 (2007).
Das, D., Veziroglu, T. N., Hydrogen production by biological processes: A survey of literature. Inter-national Journal of Hydrogen Energy, v. 26, p. 13-28 (2001).
Davila-Vazquez, G., Arriaga, S., Alatriste-Mondragón, F., Fermentative biohydrogen production: Trends and perspectives. Reviews in Environmental Sci-ence and Bio/Technology, v. 7, p. 27-45 (2007). Dubois, S. M., Gilles, K. A., Hamilton, J. L., Rebers,
P. A., Smith, F., Colorimetric methods for deter-mination of sugar and related substance. Analyti-cal Chemistry, v. 228, p. 13-21 (1956).
Ito, T., Nakashimada, Y., Senba, K., Matsui, T., Nishio, N., Hydrogen and ethanol production from glycerol containing wastes discharges after biodiesel manufacturing process. Journal of Bio-science and Bioengineering, v. 100, p. 260-265 (2005).
Jeong, T., Cha, G., Yoo, I., Kim, D., Hydrogen pro-duction from waste activated sludge by using separation membrane acid fermentation reactor and photosynthetic reactor. International Journal of Hydrogen Energy, v. 32, p. 525-530 (2007). Kawagoshi, Y., Hino, N., Fujimoto, A., Effect of
inoculum conditioning on hydrogen fermentation and pH effect on bacterial community relevant to hydrogen production. Journal of Bioscience and Bioengineering, v. 100, p. 524-530 (2005). Khanal, S., Chen, W., Sung, S., Biological hydrogen
production: effects of pH and intermediate prod-ucts. International Journal of Hydrogen Energy, v. 29, p. 1123-1131 (2003).
Leite, J. A. C., Fernandes, B. S., Pozzi, E., Barboza, M., Zaiat, M., Application of an anaerobic packed-bed bioreactor for the production of hydrogen and organic acids. International Journal of Hydrogen Energy, v. 33, p. 579-586 (2008).
Li, C., Fang, H., Fermentative hydrogen production from wastewater and solid wastes by mixed
cul-tures. Critical Reviews in Environmental Science and Technology, v. 37, p. 1-39 (2007).
Lin, C., Lay, C., A nutrient formulation for fermen-tative hydrogen production using anaerobic sew-age sludge microflora. International Journal of Hydrogen Energy, v. 30, p. 285-292 (2005). Lin, C., Lay, C., Carbon/nitrogen ratio effect on
fer-mentative hydrogen production by mixed micro-flora. International Journal of Hydrogen Energy, v. 29, p. 41-45 (2004a).
Lin, C., Lay, C., Effects of carbonate and phosphate concentrations on hydrogen production using an-aerobic sewage sludge microflora. International Journal of Hydrogen Energy, 29, 275-281 (2004b). Liu, X., Zhu, Y., Yang, S. T., Butyric acid and hy-drogen production by Clostridium tyrobutyricum
ATCC 25755 and mutants. Enzyme and Micro-bial Technology, v. 38, p. 521-528 (2006).
Lovato, G., Bezerra, R. A., Rodrigues, J. A. D., Ratusznei, S. M., Zaiat, M., Effect of feed strategy on methane production and performance of an AnSBBR treating effluent from biodiesel produc-tion. Applied Biochemistry and Biotechnology, v. 166, p. 2007-2029 (2012).
Mohan, S. V., Babu, V. L., Sarma, P., Anaerobic biohydrogen production from dairy wastewater treatment in sequencing batch reactor (ASBR): Effect of organic loading rate. Enzyme and Mi-crobial Technology, v. 41, p. 506-515 (2007). Mohanakrishna, G., Venkata Subhash, G., Venkata
Mohan, S., Adaptation of biohydrogen producing reactor to higher substrate load: Redox controlled process integration strategy to overcome limita-tions. International Journal of Hydrogen Energy, v. 36, p. 8943-8952 (2011).
Mu, Y., Zheng, X., Yu, H., Zhu, R., Biological hy-drogen production by anaerobic sludge at various temperatures. International Journal of Hydrogen Energy, v. 31, p. 780-785 (2006).
Nishio, N., Nakashimada, Y., Recent development of digestion process for energy recovery from wastes. Journal of Bioscience and Bioengineering, v. 103, p. 105-112 (2007).
Novaes, L. F., Borges, L. O., Rodrigues, J. A. D., Ratusznei, S. M., Zaiat, M., Foresti, E., Effect of fill time on the performance of pilot-scale ASBR and AnSBBR applied to sanitary wastewater treatment. Applied Biochemistry and Biotech-nology, v. 162, p. 885-899 (2010).
674 D. A. Santos, J. A. D. Rodrigues, S. M. Ratusznei and M. Zaiat
sludge. International Journal of Hydrogen Energy, v. 33, p. 1221-1231 (2008).
Oztekin, R., Kapdan, I., Kargui, F., Argun, H., Op-timization of media composition for hydrogen gas production from hydrolyzed wheat starch by dark fermentation. International Journal of Hydrogen Energy, v. 33, p. 4083-4090 (2008).
Ren, N., Guo, W., Wang, X., Effects of different pretreatment methods on fermentation types and dominant bacteria for hydrogen production. In-ternational Journal of Hydrogen Energy, v. 33, p. 4318-4324 (2008).
Silva, R. C., Ratusznei, S. M., Rodrigues, J. A. D., Zaiat, M., Anaerobic treatment of industrial bio-diesel wastewater by an ASBR for methane pro-duction. Applied Biochemistry and Biotechnol-ogy, v. 170, p. 105-118 (2013).
Sreethawong, T., Niyamapa, T., Neramitsuk, H., Hy-drogen production from glucose-containing waste-water using an anaerobic sequencing batch reac-tor: Effects of COD loading rate, nitrogen con-tent, and organic acid composition. Chemical En-gineering Journal, v. 160, p. 322-332 (2010). Standard Methods for the Examination of Water and
Wastewater APHA, AWWA, WPCF. 19th Edi-tion, American Public Health AssociaEdi-tion, Washington (1995).
Tanisho, S., Ishiwata, Y., Continuous hydrogen pro-duction from molasses by fermentation using urethane foam as a supprt of flocks. International Association for Hydrogen Energy, v. 20, p. 541-545 (1995).
Turcot, J., Bisaillon, A., Hallenbeck, P., Hydrogen production by continuous cultures of Escherichia coli under different nutrient regimes.
Interna-tional Journal of Hydrogen Energy, 33, 1465-1470 (2008).
Vijaya Bhaskar, Y., Venkata Mohan, S., Sarma, P. N., Effect of substrate loading rate of chemical wastewater on fermentative biohydrogen produc-tion in biofilm configured sequencing batch re-actor. Bioresource Technology, v. 99, p. 6941-6948 (2008).
Wang, J., Wan, W., Factors influencing fermentative hydrogen production: A review. International Jour-nal of Hydrogen Energy, v. 34, p. 799-811 (2009b). Wang, X., Monis, P. T., Saint, C. P., Jin, B., Bio-chemical kinetics of fermentative hydrogen pro-duction by Clostridium butyricum W5. Interna-tional Journal of Hydrogen Energy, v. 34, p. 791-798 (2009a).
Wang, Y., Zhao, Q., Mu, Y., Biohydrogen produc-tion with mixed anaerobic cultures in the pres-ence of high-concentration acetate. International Journal of Hydrogen Energy, v. 33, p. 1164-1171 (2008).
Wu, S. Y., Lin, C. N., Chang, J. S., Hydrogen pro-duction with immobilized sewage sludge in three-phase fluidized-bed bioreactors. Biotechnology Progress, v. 19, p. 828-832 (2003).
Wu, X., Yao, W., Zhu, J., Effect of pH on continu-ous biohydrogen production from liquid swine manure with glucose supplement using an an-aerobic sequencing batch reactor. International Journal of Hydrogen Energy, v. 35, p. 6592-6599 (2010).