ISSN 0104-6632 Printed in Brazil
www.abeq.org.br/bjche
Vol. 31, No. 03, pp. 683 - 691, July - September, 2014 dx.doi.org/10.1590/0104-6632.20140313s00002890
Brazilian Journal
of Chemical
Engineering
COMPARISON BETWEEN A CONVENTIONAL
MEMBRANE BIOREACTOR (C-MBR) AND A
BIOFILM MEMBRANE BIOREACTOR (BF-MBR)
FOR DOMESTIC WASTEWATER TREATMENT
E. L. Subtil
1*, J. C. Mierzwa
2and I. Hespanhol
31
Engineering, Modeling and Applied Social Sciences Center (CECS), Federal University of ABC (UFABC), Avenida dos Estados 5001, Santo Andre - SP, Brasil.
E-mail: [email protected] 2
Department of Hydraulic and Environmental Engineering (PHA), Polytechnic School, University of São Paulo, Av. Professor Almeida Prado 83, Travessa 2, Butanta, São Paulo - SP, Brazil.
3
International Reference Center on Water Reuse (CIRRA), Polytechnic School, University of São Paulo, Av. Prof. Lucio Martins Rodrigues 120, Paulo - SP, Brazil.
(Submitted: August 3, 2013 ; Accepted: October 16, 2013)
Abstract - In this paper, the influence of biofilm carriers in a MBR on the performance of organic matter and
nitrogen removal and the influence on membrane fouling were evaluated. The configurations studied included a Conventional Membrane Bioreactor (C-MBR) and a Biofilm Membrane Bioreactor (BF-MBR) operated in parallel, both fed with domestic wastewater. Regarding organic matter removal, no statistically significant differences were observed between C-MBR and BF-MBR, producing an effluent with a Soluble COD concentration of 27 ± 9.0 mgO2/L and 26 ±1.0 mgO2/L and BOD concentration of 6.0 ± 2.5 mgO2/L and 6.2 ±
2.1 mgO2/L, respectively. On the other hand, the BF-MBR produced a permeate with lower ammonia and
total nitrogen concentrations, which resulted in a removal efficiency of 98% and 73%, respectively. It was also observed that the fouling rate was about 35% higher in the C-MBR than that for the BF-MBR, which also presented a reduction of total membrane resistance, about 29%, and increased operational cycle length around 7 days, compared to C-MBR.
Keywords:Biofilm membrane bioreactor; Fouling; Membrane bioreactor; Wastewater treatment.
INTRODUCTION
Membrane Bioreactors (MBR) were commer-cialized 30 years ago and their application in waste-water treatment has increased over the past decades. However, the breakthrough for the MBR came in 1989 with the idea to submerge the membranes in the bioreactor (Yamamoto et al., 1989) which re-sulted in lower Transmembrane Pressure (TMP) and lower operational costs (Le-Clech et al., 2006). This combination made it possible to obtain compact units with small footprints, complete solids removal,
Despite the potential benefits of MBR systems and the role they can play in water conservation and reuse (Subtil et al., 2013), reduction in membrane permeability caused by fouling phenomena, due to a complex membrane/biomass interaction, still re-mains one of the major drawbacks of MBR. Mem-brane fouling reduces system performance, mainly because it constrains permeate flow by the accumu-lation of materials on the membrane surface or inside its pores. As a final result, fouling has a significant economic impact on system operation and, for this reason, it has been under investigation since the early age of MBRs, and still remains one of the most challenging issues regarding their development (Le-Clech et al., 2006; Yang et al., 2006; Anja, 2010). Nowadays, about 30% of all scientific MBR-related literature published deals directly or indirectly with membrane fouling issues (Santos et al., 2011). Al-though there is no clear agreement regarding the exact phenomena occurring on the membrane inter-face during activated sludge filtration, membrane fouling in MBRs has been mainly attributed to Ex-tracellular Polymeric Substances (EPS) (Le-Clech et al., 2006), the structural construction material for microbial aggregates. In order to minimize and con-trol the negative effect of membrane bioreactor fouling, different methods have been developed and tested, including the addition of Powdered Activated Carbon (PAC) (Khan et al., 2012; Remya et al., 2010) metal salts (Zhang et al., 2008), organic and inorganic polyelectrolytes (Dizge et a., 2011) and biopolymer (Koseoglu, 2008) in the mixed liquor.
Although chemical additions to the mixed liquor for fouling control in MBR systems generally result in an enhanced filterability, it is important to keep in mind that their use also represents a substantial in-crease in operational costs. Thus, several studies focused their attention on a hybrid system as an al-ternative to the conventional MBR (C-MBR), trying to combine the advantages of biofilm and MBR processes in order to overcome some of the limita-tions of C-MBR. Results from recent research demon-strated that biofilm carriers can reduce the negative effect of suspended solids on the membrane surface and improve its filterability because of a low fouling rate (Leiknes and Ødegaard, 2001; Ivanovic and Leiknes, 2012). Although some studies have been made with Biofilm MBR there is no consensus and some results are controversial. Yang et al. (2006) showed that, during long-term experiments, the in-creasing rate of suction pressure for a Hybrid MBR accounted for 30% of that of a C-MBR, indicating that the degree of membrane fouling for a Hybrid MBR was far lower than that for a C-MBR. Another
study developed by Liu et al. (2010) showed that the increase of TMP was slowed down in a Hybrid MBR, in which the time to perform a chemical cleaning was 92 days or longer, while in a C-MBR the time was 57-65 days. On the other hand, Yang et al. (2009) found worse membrane performance after the addition of carriers, where the rate of membrane fouling in Hybrid MBR was about three times that of Conventional MBR.
In this context the influence of biofilm carriers in a MBR on the performance of organic matter and nitrogen removal and the influence on membrane fouling were evaluated. The configurations studied included a Conventional Membrane Bioreactor (C-MBR), as a control system, and a Biofilm Membrane Bioreactor (BF-MBR) operated in parallel and fed with domestic wastewater.
MATERIAL AND METHODS
Experimental Set-Up and Operating Conditions
The study was carried out using two membrane bioreactor pilot-plants (C-MBR and BF-MBR), work-ing in parallel and gravity fed with domestic waste-water, derived from the student housing and univer-sity restroom of Univeruniver-sity of São Paulo (Figure 1). Prior to the MBR system, wastewater passed through a screening, grit chamber and an oils & grease re-moval device. Both reactors were made of acrylic, with an effective volume of 100 L, and were oper-ated at a mean Hydraulic Retention Time (HRT) of 10.2 hours and a Solid Retention Time (SRT) of 10 days. The BF-MBR had 40% of its volume occupied by the carriers which were cylindrical polypropylene rings having outer diameters and lengths of 9 mm and 7 mm, respectively, resulting in a specific sur-face area of 330 m2.m-3. During the evaluation period the total biomass concentration in the C-MBR and BF-MBR (suspended and attached biomass) were kept around 5540 ± 693 mg MLSS.L-1 and 5186 ± 435 mg MLSS.L-1, respectively.
by a peristaltic pump operating with a cycle of 8 minutes of filtration and 1.6 minutes of relaxation. In the permeate line the temperature, pressure and flow were continuously monitored and recorded with a data logger (Field-Logger 8812010000, from Novus). Membranes were chemically cleaned with a solution of NaOH (4%) when the TMP reached 0.15 bar.
Membrane Module and Characterization
As shown in Figure 1, both reactors were equipped with submerged membranes, which consisted of two Flat Sheet Ultrafiltration membrane modules (FS-UF).
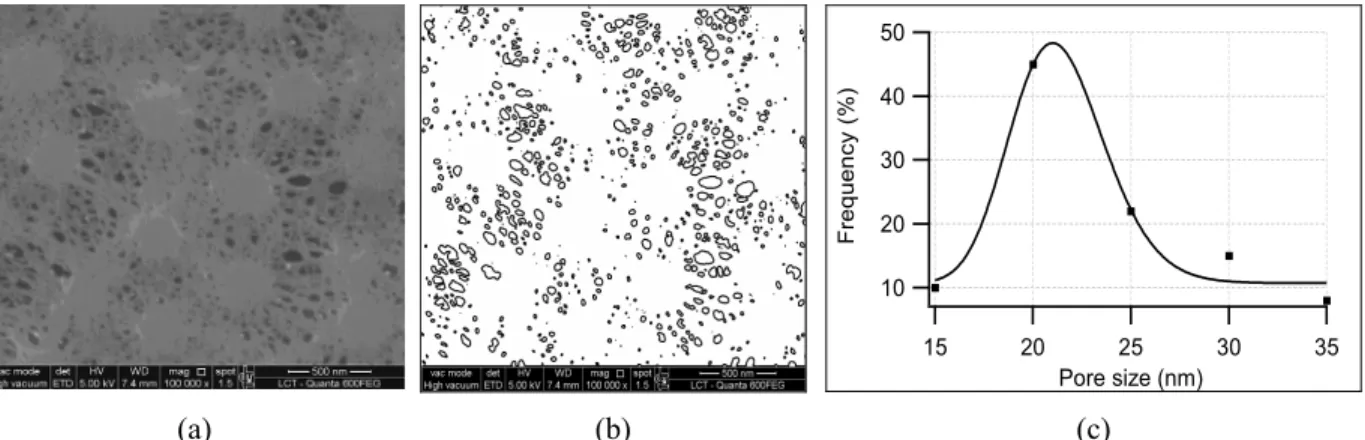
Each FS-UF system consisted of 16 plates with a total membrane area of 1.8 m2. The system was de-veloped in the International Reference Center for Water Reuse of the University of São Paulo with membranes supplied by the AMFOR INC Company. Membrane pore size distribution was performed using Scanning Electron Microscopy (SEM) (Figure 2-(a)) with membrane images analyzed with the ImageJ (NIH) software’s “Analyze Particles” function (Figure 2-(b)) as described in Mierzwa et al. (2012). The UF membranes used in the study were made of Polyvi-nylidene Fluoride (PVDF) and had a mean pore size of 22 ± 6 nm (Figure 2-(c)).
Figure 1: Pilot-plant schemes, where S1–low-flow sensor (model 8031, Burket);
S2–pressure sensor (model GTP 1000, Gluton); S3–temperature sensor (model NKTM-2200, NAKA).
50
40
30
20
10
F
re
q
u
e
n
cy
(%
)
35 30 25 20 15
Pore size (nm)
(a) (b) (c)
Figure 2: Membrane top surface image (a), after manipulation with ImageJ (b) and membrane pore size
Membrane Fouling Analysis
The degree of membrane fouling between C-MBR and BF-MBR was measured using the series resis-tance model (Cheryan, 1998; Bae, 2005):
p
m
Q J
A
= (1)
t t J P R n Δ
= (2)
t m f
R =R +R (3)
where J is the membrane permeate flux (m3.m-2.s-1),
p
Q is the permeate flowrate (m3.s-1), Am is the mem-brane surface area (m2), ΔPt is the Transmembrane Pressure (TMP) (Pa), n is the viscosity of the permeate (Pa s), Rt is the total filtration resistance (m-1), Rm is the membrane resistance (m-1) and Rf
is the total fouling resistance that includes the cake resistance (m-1).
The membrane permeability (Jp) was calculated
according to Equation (4).
( p)
t
J J
P =
Δ (4)
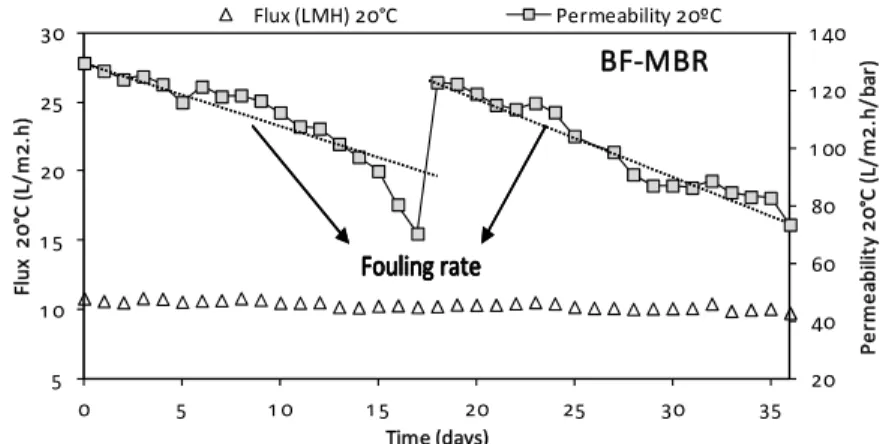
As presented in Figure 3 the fouling rate was es-timated during constant flux operation and represents the decrease of permeability per day (L/m2.h.bar.d).
Analytical Methods
Influent and effluent samples from the C-MBR and BF-MBR were analyzed according to the Stan-dard Methods (APHA, 2005) with a frequency of three times per week for Chemical Oxygen Demand (COD), organic nitrogen (Norg.-N), ammonium nitro-gen (NH4+–N), nitrate nitrogen (NO3-–N), and nitrite nitrogen (NO2-–N). Five day Biochemical Oxygen Demand (BOD5) was determined using manometric systems from Aqualitic (BOD-System, OxiDirect). Turbidity, pH, and color were measured by a pH meter (model Q400MT, Quimis), turbidimeter (model 2100Q, Hach) and spectrophotometer (model B572, Micronal), respectively. Mixed Liquor Suspended Solids (MLSS) and Mixed Liquor Volatile Sus-pended Solids (MLVSS) samples from each reactor were analyzed twice in a week according to the Standard Methods (APHA, 2005). Attached Biomass quantification consisted of extracting the biofilm attached to the carriers. The collected carriers (10 units) were put in a flask and kept in a shaker for 10 minutes to pre-release the adhered material. At the end, the remaining material was scraped with a toothbrush and transferred to a beaker, and the re-sulting volume was measured. Later determinations were performed for concentrations of TSS and VSS.
20 40 60 80 1 00 1 20 1 40 5 1 0 1 5 20 25 30
0 5 1 0 1 5 20 25 30 35
P e rm e a b il it y 2 0 °C (L / m 2 .h / b a r) F lu x 2 0 °C (L / m 2 .h )
Time (days)
BF‐MBR
Flux (LMH) 20°C Permeability 20ºC
Fouling rate
20 40 60 80 1 00 1 20 1 40 5 1 0 1 5 20 25 30
0 5 1 0 1 5 20 25 30 35
P e rm e a b il it y 2 0 °C (L / m 2 .h / b a r) F lu x 2 0 °C (L / m 2 .h )
Time (days)
BF‐MBR
Flux (LMH) 20°C Permeability 20ºC
Fouling rate
Fouling rate
RESULTS AND DISCUSSION
Feed Wastewater Characteristics
Table 1 presents the main characteristics of the wastewater fed into the two membrane treatment systems. The average T-COD and BOD correlation of 2.8 indicates it corresponds to a typical domestic wastewater (Metcalf & Eddy, 2003).
Table 1: Wastewater characteristics fed to both membrane reactors.
Parameter* Unit Mean Maximum Minimum
pH - 7.1 7.4 6.1
Temperature ºC 23.6 26.3 21.0
Turbidity NTU 412 896 145
Color Uc 569 973 244
T-COD** mg O2.L-1 912 1279 512
S-COD*** mg O2.L-1 397 762 145
BOD mg O2.L-1 289 523 186
NH4-N mg N.L-1 39.3 58.6 30.8
Norg-N mg N.L-1 14.2 26.0 5.8
TN mg N.L-1 53.5 70.3 42.3
*NO3-and NO2- were always below 0.4 mg N/L.
**Total COD ***Soluble COD
Permeate Quality
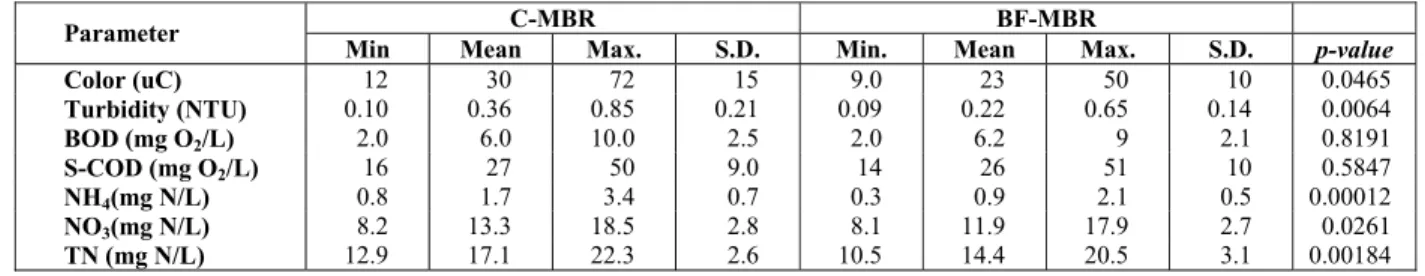
Permeate quality obtained during the operation of both membrane bioreactors is presented in Table 2. The use of UF membranes in wastewater treatment has great potential for effluent clarification, which was demonstrated by both systems, resulting in a quite clear effluent, reaching a turbidity removal of 99.9% in both systems (Figure 4). Besides turbidity, color is another parameter related to clarification and it is considered to be one of the most difficult aes-thetic parameters for MBR systems (Arévalo et al., 2009). As was expected, in contrast to the results obtained for turbidity, color was present in the efflu-ent from both MBR systems, although better results were obtained by BF-MBR, producing an effluent with statistically significant differences from the C-MBR effluent. Regarding organic matter removal,
no statistically significant differences were observed between C-MBR and BF-MBR, with average Solu-ble COD concentrations of 27 ± 9.0 mgO2.L-1 and 26 ±1.0 mgO2.L
-1
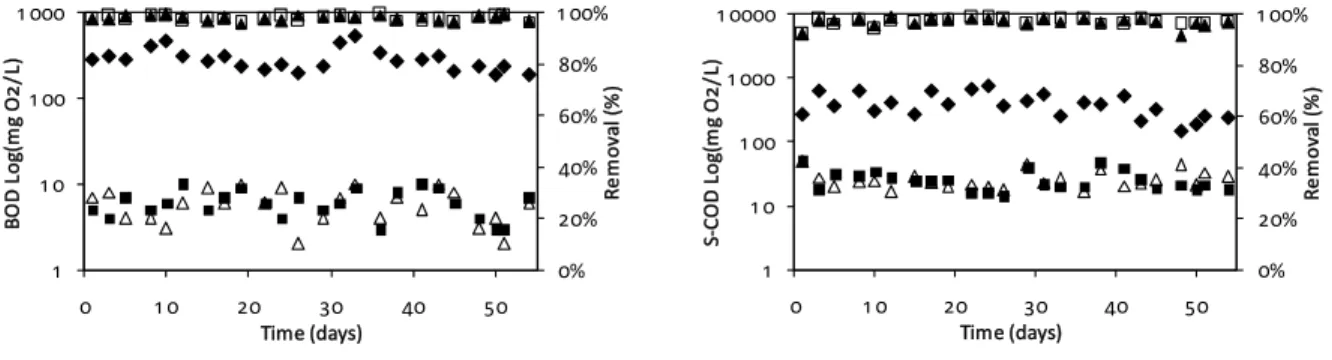
and BOD concentrations of 6.0 ± 2.5 mgO2.L-1 and 6.2 ± 2.1 mgO2.L-1, respectively. Liu
et al. (2010) and Khan et al. (2012) reported better COD removal in a biofilm MBR, while Liang et al. (2010) and Yang et al. (2009) found a worse removal rate in a biofilm MBR (Figure 6). However, in all cases differences in organic matter removal were very small, indicating, as cited by Ivanovic et al. (2006), that generally there is no difference in the degree of organic removal between an activated sludge MBR and biofilm MBR when operated at similar HRT and SRT. The authors also reported that both systems can sustainably achieve high COD removal, typically 95 – 99%. Actually, the biomass attached to the carriers has higher activity, making it possible to achieve the same organic matter removal rates with lower biomass concentrations, as was re-ported by Lee et al. (2002). With the biofilm MBR, the same removal of organic matter was achieved as that in the activated sludge MBR, but with almost 1/3 of the biomass.
Besides organic matter removal, another water quality parameter evaluated was nitrogen removal. Different from the results obtained for organic mat-ter, which showed no statistically significant differ-ences in the removal rate, the reactor configuration played an important role in total nitrogen (TN) and ammonia removal. Figure 5 illustrates the temporal variation of TN and NH4+ concentrations, as well as their removal efficiencies for both systems (C-MBR and BF-MBR) throughout the whole experiment. The C-MBR reached ammonia and total nitrogen removal efficiencies of 96% and 67%, with final effluent concentrations of 1.7 ± 0.7 mg NH4-N/L and 17.1 ± 2.6 mg TN-N/L, respectively. On the other hand, the BF-MBR produced a permeate with lower ammonia and total nitrogen concentrations, resulting in removal efficiencies of 98% and 73%, respec-tively, and an effluent with 0.9 ± 0.5 mg NH4-N/L and 14 ± 3.1 6 mg TN-N/L.
Table 2: Results for the main parameters utilized to characterize the effluent quality for C-MBR and BF-MBR (N=24).
C-MBR BF-MBR Parameter
Min Mean Max. S.D. Min. Mean Max. S.D. p-value
Color (uC) 12 30 72 15 9.0 23 50 10 0.0465
Turbidity (NTU) 0.10 0.36 0.85 0.21 0.09 0.22 0.65 0.14 0.0064
BOD (mg O2/L) 2.0 6.0 10.0 2.5 2.0 6.2 9 2.1 0.8191
S-COD (mg O2/L) 16 27 50 9.0 14 26 51 10 0.5847
NH4(mg N/L) 0.8 1.7 3.4 0.7 0.3 0.9 2.1 0.5 0.00012
NO3(mg N/L) 8.2 13.3 18.5 2.8 8.1 11.9 17.9 2.7 0.0261
Higher TN removal in BF-MBR can mostly be attributed to multifunctional microbial reactions that take place in the developed biofilm, especially si-multaneous nitrification and denitrification (SND), which play an important role in nitrogen removal. Yang et al. (2009) evaluated carbon and nitrogen removals under different COD/TN ratios in a moving
bed membrane bioreactor (MBMBR) and demon-strated that simultaneous nitrification and denitrifi-cation were the main processes in the TN removal, where up to 89.1% was removed by SND while, for the same period, the TN removal by SND in the acti-vated sludge MBR was only 42.5%. A comparison with other studies is presented in Figure 5.
0% 20% 40% 60% 80% 1 00% 1 1 0 1 00 1 000
0 1 0 20 30 40 50
Re m o v a l (% ) BO D L o g (m g O 2 / L )
Time (days)
Affluent C‐MBR BF‐MBR C‐MBR (Eff.%) BF ‐MBR (Eff.%)
0% 20% 40% 60% 80% 1 00% 1 1 0 1 00 1 000 1 0000
0 1 0 20 30 40 50
Re m o v a l (% ) S ‐ C O D L o g (m g O 2 / L )
Time (days)
Affluent C‐MBR BF‐MBR C‐MBR (Eff.%) BF ‐MBR (Eff.%)
Figure 4: BOD and S-COD profiles in C-MBR and BF-MBR during the experimental evaluation period.
0% 20% 40% 60% 80% 1 00% 0 1 1 0 1 00
0 1 0 20 30 40 50
Re m o v a l (% ) A m m o n ia L o g (m g N H 4 ‐ N / L )
Time (days)
Affluent C‐MBR BF‐MBR C‐MBR (Eff.%) BF ‐MBR (Eff.%)
0% 20% 40% 60% 80% 1 1 0 1 00 1 000
0 1 0 20 30 40 50
Re m o v a l (% ) T N L o g (m g N / L )
Time (days)
Affluent C‐MBR BF‐MBR C‐MBR (Eff.%) BF ‐MBR (Eff.%)
Figure 5: Ammonia and TN profiles in the C-MBR and BF-MBR during the experimental evaluation
period.
‐20
‐1 5
‐1 0
‐5 0 5 1 0 1 5 20 Im p ro v m e n t (% )
COD NH4 TN COD NH4 TN COD NH4 TN COD NH4 TN COD NH4 TN
Khan et.al (201 2) Liang et.al (201 0) Yang et.al (2009)
Liu et.al (201 0) in this study
Figure 6: Efficiency improvement of organic matter and
Filtration Characteristics
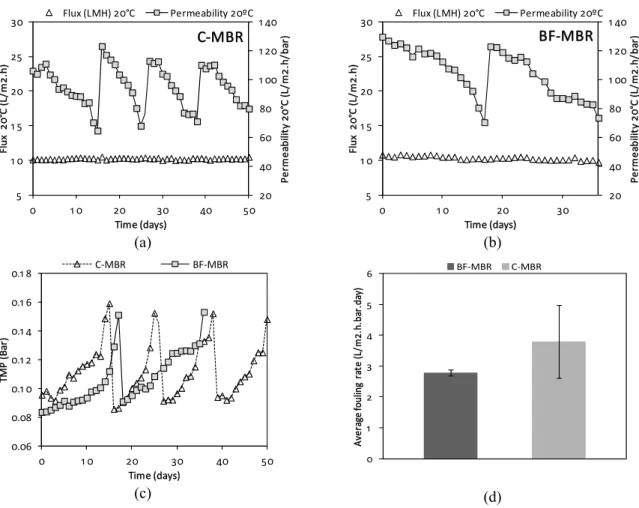
The transmembrane pressure (TMP) profile is an important parameter to evaluate membrane perform-ance in submerged membrane bioreactors since it is directly influenced by the membrane fouling rate. TMP was monitored at a constant flux condition of 10.2 ± 0.2 LMH for the C-MBR and 10.4 ± 0.3 LMH for the BF-MBR. Figure 7 illustrates the TMP profile and fouling rate throughout the whole experiment. It can be observed in Figure 7 that the TMP rate for C-MBR was higher than that for the biofilm mem-brane bioreactor, resulting in a mean fouling rate for C-MBR and BF-MBR of 3.8 ± 1.2 L/m2.h.bar.d and 2.8 ± 0.1 L/m2.h.bar.d, respectively. As a result, the
mean length of operational cycles increased by 7 days in the BF-MBR compared to the C-MBR. The resistance analysis results are presented in Table 3 and represent the mean values during the entire ex-perimental period. Total resistance was reduced in the BF-MBR by about 29%. The fouling resistance (Rf), which included the resistance due to cake for-mation, pore blocking, and adsorption on the mem-brane surface, was found to be the predominant re-sistance fraction in the C-MBR, representing 58%. On the other hand in the BF-MBR the fouling resis-tance represented only 40%. Several studies found lower fouling rates and improved filterability when attached biomass was applied with a membrane bio-reactor.
Table 3: Resistance analysis, fouling rate and permeability for C-MBR and BF-MBR during the opera-tional period.
Process Rt (m-1) Rm (m-1) Rf (m-1) Rm/Rt Rf/Rt Permeability
(L/h.m2.bar)
C-MBR 5.8x10¹² 2.5x10¹² 3.4x10¹² 0.42 0.58 94 ± 14
BF-MBR 4.1x10¹² 2.5x10¹² 1.6x10¹¹ 0.60 0.40 105 ± 37
Rt is the total resistance, Rm is the membrane resistance; Rf is the fouling resistance.
20 40 60 80 1 00 1 20 1 40 5 1 0 1 5 20 25 30
0 1 0 20 30 40 50
P e rm e a b il it y 2 0 °C (L / m 2 .h / b a r) F lu x 2 0 °C (L / m 2 .h )
Time (days)
C‐MBR
Flux (LMH) 20°C Permeability 20ºC
(a) 20 40 60 80 1 00 1 20 1 40 5 1 0 1 5 20 25 30
0 1 0 20 30
P e rm e a b il it y 2 0 °C (L / m 2 .h / b a r) F lu x 2 0 °C (L / m 2 .h )
Time (days)
BF‐MBR
Flux (LMH) 20°C Permeability 20ºC
(b) 0.06 0.08 0.1 0 0.1 2 0.1 4 0.1 6 0.1 8
0 1 0 20 30 40 50
T M P (B a r)
Time (days)
C‐MBR BF‐MBR
(c) 0 1 2 3 4 5 6 A ve ra ge fo u lin g ra te (L /m 2 .h .b ar .d ay )
BF‐MBR C‐MBR
(d)
Figure 7: Membrane filterability during the experimental period, where: (a) and (b) permeability; (c)
Wang et al. (2010) reported a reduction of 48% in total resistance by introducing biofilm carriers into the mixed liquor, which increased the operational cycles three times. Li and Yang (2007) indicated that attached biomass can absorb some soluble organic polymers from the mixed liquor, and therefore can decrease their effect on membrane fouling.
CONCLUSIONS
This study evaluated the influence in overall per-formance of an attached biomass membrane biore-actor compared to a suspended biomass membrane bioreactor. The following conclusions can be drawn:
1 - No significant differences were observed re-garding organic matter removal. Both systems pro-duced an effluent with low COD concentration and about 96% COD removal;
2 - The biofilm membrane bioreactor improved the total nitrogen removal. Average TN removal in the BF-MBR was enhanced by 6%, compared with that in the C-MBR;
3 - The attached biomass in the membrane biore-actor improved the permeability and significantly reduced the fouling rate. As a result, the operational cycle length increased around 7 days in the BF-MBR compared to the C-MBR.
ACKNOWLEDGMENTS
The authors want to express their gratitude to the Council for Technological and Scientific Develop-ment (CNPq) for their financial support. Also a spe-cial thanks to Kirsten Van Fossen for the text revision.
REFERENCES
Anja, D., Membrane fouling in membrane bioreac-tors–characterisation, contradictions, cause and cures. Journal of Membrane Science, 363, p. 1-28 (2010).
Arévalo, J., Garralón, G., Plaza, F., Moreno, B., Pérez, J. and Goméz, M. A., Wastewater reuse after treatment by tertiary ultrafiltration and a membrane bioreactor (MBR): A comparative study. Desalination, 243, p. 32-41 (2009).
APHA, Standard Methots for the Examination of Water and Wastewater. 21st Ed. (2005).
Bae, T. and Tak, T., Interpretation of fouling charac-teristics of ultrafiltration membranes during the filtration of membrane bioreactor mixed liquor.
Journal of Membrane Science, 267, p. 151-160 (2005).
Cheryan, M., Ultrafiltration and Microfiltration Handbook. Florida, CRC PRESS (1998).
Dizge, N., Koseoglu-Imer, D. Y., Karagunduz, A. and Keskinler, B., Effects of cationic polyelec-trolyte on filterability and fouling reduction of submerged membrane bioreactor (MBR). Journal of Membrane Science, 377, p. 175-181 (2011). Guo, W., Ngo, H., Palmer, C. G., Xing, W., Hu, A.
Y. and Listowski A., Roles of sponge sizes and membrane types in a single stage sponge-sub-merged membrane bioreactor for improving nu-trient removal from wastewater for reuse. Desali-nation, 249, p. 672-676 (2009).
Ivanovic, I., Leiknes, T. O. and Ødegaard H., Influ-ence of loading rates on production and charac-teristics of retentate from a biofilm membrane bioreactor. Desalination, 199, p. 490-492 (2006). Ivanovic I. and Leiknes T. O., The biofilm
mem-brane bioreactor (BF-MBR) - a review. Desalina-tion and Water Treatment, 37, p. 288-295 (2012). Khan, S. J., Visvanathan, C. and Jegatheesan, V.,
Effect of powdered activated carbon (PAC) and cationic polymer on biofouling mitigation in hy-brid MBRs. Bioresource Technology, 113, p. 165- 168 (2012).
Koseoglu, H., Yigit, N. O., Iversen, V., Drews, A., Kitis, M., Lesjean, B. and Kraume, M., Effects of several different flux enhancing chemicals on filterability and fouling reduction of membrane bioreactor (MBR) mixed liquors. Journal of Mem-brane Science, 320, p. 57-64 (2008).
Le-Clech, P., Chen, V. and Fane, T. A. G., Fouling in membrane bioreactors used in wastewater treatment. Journal of Membrane Science, 284, p. 17-53 (2006).
Lee, J., Ahn, W. Y. and Lee C. H., Comparison of the filtration characteristics between attached and suspended growth microorganisms in submerged membrane bioreactor. Water Research, 35, p. 2435-2445 (2002).
Leiknes, T. O. and Ødegaard, H., The development of a biofilm membrane bioreactor. Desalination, 202, p. 135-143 (2001).
Liang, Z., Das, A., Beerman, D. and Hu, Z., Biomass characteristics of two types of submerged mem-brane bioreactors for nitrogen removal from waste-water. Water Research, 44, p. 3313-3320 (2010). Li, X. Y. and Yang S. F., Influence of loosely bound
extracellular polymeric substances (EPS) on the
Liu, Q., Wang, X., Liu, Y., Yuan, H. and Yujiao, D., Performance of a hybrid membrane bioreactor in municipal wastewater treatment. Desalination, 258, p. 143-147 (2010).
Metcalf, L., Eddy, H. P. and Tchobanoglous, G., Wastewater Engineering: Treatment, Disposal, Reuse. EUA, McGraw-Hill, 4th Ed. (2003). Mierzwa, J. C., Vecitis, C. D., Carvalho, J., Arieta,
V. and Verlage M., Anion dopant effects on the structure and performance of polyethersulfone membranes. Journal of Membrane Science, 421, p. 91-102 (2012).
Remya, M., Potiera, V., Temminka, H., Rulkensb, W., Why low powdered activated carbon addition reduces membrane fouling in MBRs. Water Re-search, 44, p. 861-867 (2010).
Santos, A., Ma, W. and Judd, S. J., Membrane biore-actors: Two decades of research and implementa-tion. Desalination, 273, p. 148-154 (2011). Subtil, E. L., Hespanhol, I., Mierzwa, J. C.,
Biorrea-tores com membranas submersas (BRMs): Alter-nativa promissora para o tratamento de esgotos sanitários para reúso. Rev. Ambient. Água, 8(3), p. 129-142 (2013). (In Portuguese).
Susan, H., Membrane Bioreactors: Global Markets (Report MST047C). BCC Research (2011). Wang, X. C., Liu, Q. and Liu, Y. J., Membrane
fouling control of hybrid membrane bioreactor. Effect of extracellular polymeric substance.
Sepa-ration Science and Technology, 45, p. 928-934 (2010).
Yamamoto, K., Hiasa, M., Mahmood, T. andMatsuo, T., Direct solid–liquid separation using hollow fi-ber membrane in an activated-sludge aeration tank. Water Science and Technology, 21, p. 43-54 (1989).
Yang, W., Cicek, N. and Ilg, J., State-of-the-art of membrane bioreactors: Worldwide research and commercial applications in North America. Jour-nal of Membrane Science 207, p. 201-211 (2006). Yang, Q., Chen, J. and Zhang, F., Membrane fouling control in a submerged membrane bioreactor with porous, flexible suspended carriers. Desalination, 189, p. 292-302 (2006).
Yang, S., Yang, F., Fu, Z. and Lei, R., Comparison between a moving bed membrane bioreactor and a conventional membrane bioreactor on organic carbon and nitrogen removal. Bioresource Tech-nology, 100, p. 2369-2374 (2009).
Yang, S., Yang, F., Fu, Z. and Lei, R., Comparison between a moving bed membrane bioreactor and a conventional membrane bioreactor on mem-brane fouling. Bioresource Technology, 100, p. 6655-6657 (2009).