The Rockefeller University Press $30.00 J. Cell Biol. Vol. 186 No. 1 11–26
I. Matos and A.J. Pereira contributed equally to this paper. Correspondence to Helder Maiato: maiato@ibmc.up.pt
Abbreviations used in this paper: CID, centromere identifier; CLASP, cytoplas-mic linker associated protein; FSM, fluorescent speckle cytoplas-microscopy; ipMT, inter-polar MT; kMT, kinetochore MT; MT, microtubule; ROI, region of interest; SAC, spindle assembly checkpoint.
Introduction
The sense and purpose of mitosis is revealed in its climax
dur-ing anaphase, when sister chromatids migrate synchronously
toward opposite poles. This critical task is accomplished by a
highly dynamic microtubule (MT)-based apparatus: the mitotic
spindle, which interacts with specialized structures at the
centro-mere of each chromosome termed kinetochores (Maiato et al.,
2004a). Anaphase synchrony prevents the occurrence of
lag-ging chromosomes that could lead to the formation of
micro-nuclei after nuclear envelope restoration or reversion of cleavage
furrow ingression during cytokinesis. These cytological features
may lead to aneuploidy or polyploidy, and have been associated
with elevated risk of cancer in mammalian models and humans
(Tucker and Preston, 1996; Ganem et al., 2007). In higher
eukaryotic cells, anaphase synchrony is ensured by the strategic
positioning of all chromosomes at the cell equator during
meta-phase and the strict coordination of sister chromatid separation.
Although anaphase onset is regulated by the spindle assembly
checkpoint (SAC), which ensures that all kinetochores are
prop-erly attached to the spindle before loss of sister chromatid
co-hesion (Musacchio and Salmon, 2007), the mechanism responsible
for the uniform action of spindle forces at kinetochores remains
to be elucidated.
During metaphase, many animal and plant spindles are
characterized by a conspicuous “flux” activity due to
continu-ous MT poleward translocation, while maintaining steady-state
length (Mitchison, 1989; Rogers et al., 2005). Spatio-temporal
scales of flux dictate that spindle MTs are fully recycled before
anaphase, which results from continuous incorporation of
tubu-lin subunits at kinetochores (Maiato et al., 2005) balanced by
MT depolymerization at the poles (Rogers et al., 2004). In
addi-tion, sister kinetochores on metaphase chromosomes are pulled
toward opposite poles by spindle forces that stretch the
inter-connecting centromeric chromatin. This tension is thought to
control the maturation (King and Nicklas, 2000) and correction
(Nicklas and Ward, 1994) of kinetochore–MT attachments
be-fore cells enter anaphase.
T
he synchronous movement of chromosomes during
anaphase ensures their correct inheritance in every
cell division. This reflects the uniformity of spindle
forces acting on chromosomes and their simultaneous
entry into anaphase. Although anaphase onset is
con-trolled by the spindle assembly checkpoint, it remains
unknown how spindle forces are uniformly distributed
among different chromosomes. In this paper, we show
that tension uniformity at metaphase kinetochores and
subsequent anaphase synchrony in
Drosophila
S2 cells
are promoted by spindle microtubule flux. These results
can be explained by a mechanical model of the spindle
where microtubule poleward translocation events
associ-ated with flux reflect relaxation of the kinetochore–
microtubule interface, which accounts for the redistribution
and convergence of kinetochore tensions in a timescale
comparable to typical metaphase duration. As predicted
by the model, experimental acceleration of mitosis
pre-cludes tension equalization and anaphase synchrony.
We propose that flux-dependent equalization of
kineto-chore tensions ensures a timely and uniform maturation
of kinetochore–microtubule interfaces necessary for
error-free and coordinated segregation of chromosomes
in anaphase.
Synchronizing chromosome segregation by
flux-dependent force equalization at kinetochores
Irina Matos,
1António J. Pereira,
1Mariana Lince-Faria,
1Lisa A. Cameron,
2Edward D. Salmon,
2and Helder Maiato
1,31Instituto de Biologia Molecular e Celular, Universidade do Porto, 4150-180 Porto, Portugal
2Department of Biology, University of North Carolina, Chapel Hill, NC 27599
3Laboratory of Cell and Molecular Biology, Faculdade de Medicina, Universidade do Porto, 4200-319 Porto, Portugal
© 2009 Matos et al. This article is distributed under the terms of an Attribution– Noncommercial–Share Alike–No Mirror Sites license for the first six months after the publica-tion date (see http://www.jcb.org/misc/terms.shtml). After six months it is available under a Creative Commons License (Attribution–Noncommercial–Share Alike 3.0 Unported license, as described at http://creativecommons.org/licenses/by-nc-sa/3.0/).
THE
JOURNAL
OF
CELL
BIOLOGY
on December 29, 2010
jcb.rupress.org
Downloaded from
http://jcb-dataviewer.rupress.org/jcb/browse/1402 Original image data can be found at:
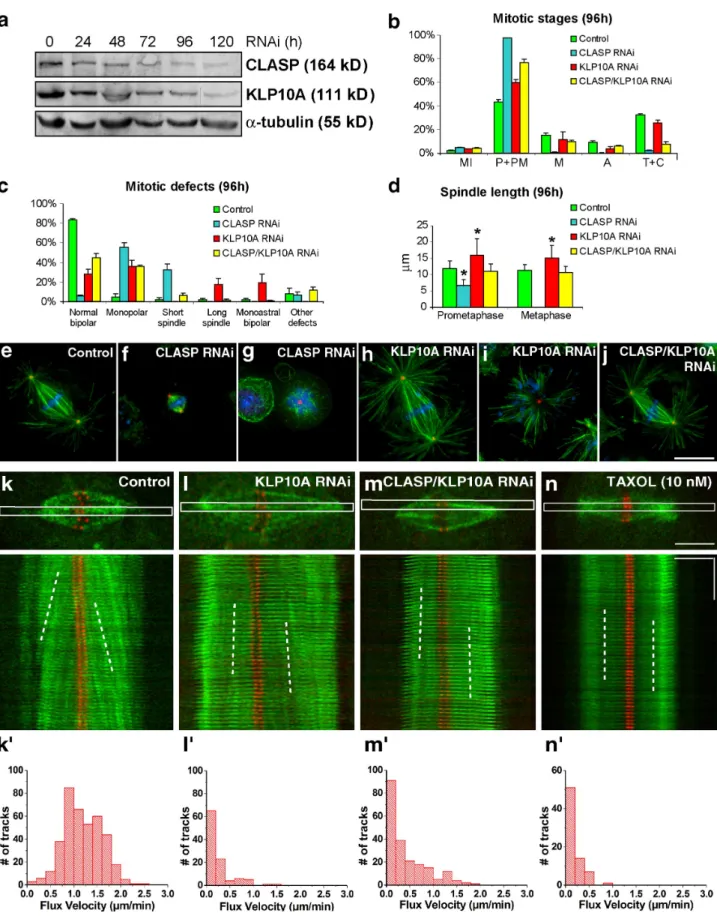
Figure 1. Phenotypic analyses of CLASP, KLP10A, and CLASP/KLP10A RNAi in Drosophila S2 cells. (a) Western blot analysis after CLASP and KLP10A RNAi at different time points revealed a 70–90% reduction in protein levels after 96 h of RNAi treatment. -tubulin was used as loading control. (b) Quantification of mitotic parameters reveals a significant rescue of the CLASP phenotype by simultaneous depletion of KLP10A. Note that metaphases and anaphases were restored in the double RNAi experiments. (c and d) Quantification of mitotic defects in controls and after CLASP, KLP10A, and CLASP/ KLP10A RNAi show that simultaneous depletion of CLASP and KLP10A significantly restored spindle bipolarity and length. Plotted values in panels b–d represent the mean from three experiments, and error bars represent the respective standard deviations. Asterisks in panel d indicate statistically signifi-cant differences when compared with controls (P < 0.001; Mann-Whitney test). (e–j) Immunofluorescence analysis of mitotic spindles from control, CLASP, KLP10A, and CLASP/KLP10A RNAi. MTs (green) and centrosomes (red) were, respectively, revealed with anti–- and -tubulin antibodies, whereas DNA
on December 29, 2010
jcb.rupress.org
(blue) was counterstained with DAPI. S2 cells stably expressing low levels of GFP--tubulin (green) and CID-mCherry (red) were used to analyze kMT poleward flux by FSM. Bar, 10 µm. (k–n) Control (k), KLP10A RNAi (l), CLASP/KLP10A RNAi (m), and Taxol-treated cells (n). Speckle poleward veloc-ity was determined by measuring the slopes obtained from the kymographs (white broken lines). (k–n) Distribution of flux velocity in control, KLP10A RNAi, CLASP/KLP10A RNAi, and Taxol-treated cells, respectively. Horizontal bar, 5 µm; vertical bar, 1 min. All treatments were statistically different from controls (P < 0.05; Dunn’s test).
Simultaneity of tension and MT translocation/flux relative
to the kinetochore suggests that the flux-driving force is not
generated at the kinetochore–MT interface. Indeed, any
me-chanical event at this interface that hypothetically pushes
kineto-chore MTs (kMTs) poleward (e.g., a kinesin power stroke)
would react against the kinetochore structure, leading to
centro-mere compression, not stretching. MT poleward flux may be
driven by active MT minus-end depolymerization at the poles
(Waters et al., 1996; Rogers et al., 2004; Ganem et al., 2005) or
by motors acting along the length of kMTs (Mitchison, 2005;
Forer et al., 2008). Growing emphasis in several cell types is
being given to kinesin-5 motors, which slide apart antiparallel
interpolar MTs (ipMTs), as the main flux-driving force (Miyamoto
et al., 2004; Goshima et al., 2005; Brust-Mascher et al., 2009).
Polymerization and depolymerization at MT plus and minus
ends, respectively, are viewed as downstream responses to MT
poleward translocation that regulate spindle length (Gaetz and
Kapoor, 2004; Maiato et al., 2005). In this framework, kinesin-5
motors may drive kMT flux by directly cross-linking kMTs to
ipMTs of opposite polarity (Mitchison, 2005) or, indirectly, by
laterally transmitting the force generated by sliding ipMTs to
kMTs within the same half spindle (Brust-Mascher et al., 2009).
The key ingredient in both models is that ipMT sliding may
prompt kMT poleward translocation through force transmission
via a mechanical coupler, which in a more general view may
consist of proteins with MT cross-linking activity (Manning
and Compton, 2007) or a viscoelastic network (Brangwynne
et al., 2006). The existence of such mechanical coupler may be
heuristically inferred by the fact that spindles rotate and
trans-late as a unified structure, which ultimately means that all
chromosomes are mechanically connected.
The conservation and energetic cost of flux during
meta-phase, together with its dispensability for chromosome segregation
in systems where it is normally present (Ganem et al., 2005; Buster
et al., 2007), poses obvious questions regarding its functional roles.
Besides, MT poleward translocation relative to the kinetochore
(i.e., kMT flux) reflects the relaxation of the kinetochore–MT
inter-face (implying a certain loss of tension), which may be seen
as an apparent disadvantage to the cell. Here, we used
Drosoph-ila S2 cells to test whether the existence of flux represents a
way to redistribute excess tensions on metaphase chromosomes,
thereby contributing to the equalization of forces acting at
kinetochores and anaphase “quality.”
Results
Experimental attenuation of kMT flux in Drosophila S2 cells
The poleward flux of kMTs requires a corresponding rate of MT
polymerization and slippage at the kinetochore. To test whether
flux-associated slippage at the kinetochore–MT interface
contributes to a uniform distribution of forces acting on
kineto-chores, we started by experimentally reducing kMT flux on bipolar
spindles. In Drosophila S2 cells, kMT flux requires cytoplasmic
linker associated protein (CLASP)-mediated incorporation of
tubulin subunits at kinetochores (Maiato et al., 2005) balanced
by KLP10A-dependent MT depolymerization at the poles (Rogers
et al., 2004; Buster et al., 2007). Although CLASP RNAi causes
kMT shortening and a strong accumulation of prometaphase
cells with monopolar or short spindles (Fig. 1, a–g; Maiato
et al., 2005), KLP10A RNAi increases spindle length without
precluding bipolar spindle formation and function (Fig. 1, a–e,
h, and i; Goshima et al., 2005; Buster et al., 2007).
Simultane-ous knockdown of CLASP and KLP10A significantly restores
normal spindle bipolarity, length, and morphology (Fig. 1, a–e,
and j; Laycock et al., 2006). To verify that bipolar spindles after
KLP10A or CLASP/KLP10A RNAi undergo slower kMT flux,
we used S2 cells stably expressing GFP–
-tubulin under the
control of an inducible promoter and the kinetochore marker
mCherry–centromere identifier (CID)-mCherry. The leaky
ex-pression of GFP–
-tubulin can be used to measure kMT flux by
fluorescent speckle microscopy (FSM; Goshima et al., 2005;
Danuser and Waterman-Storer, 2006). KMT flux in control
metaphase cells is 1.2 µm/min (median) at 25°C, with only 2%
of the speckles moving slower than 0.2 µm/min relative to
kinetochores (Fig. 1, k and k
; Table I). After KLP10A or CLASP/
KLP10A RNAi, kMT flux drops to 0.2 µm/min (Fig. 1, l–m
;
Table I), which is comparable to the velocity of kMT flux
ob-served after MT stabilization with 10 nM taxol (Fig. 1, n and n
;
Table I). Although flux velocity is slow, these slowly fluxing
spin-dles satisfy the SAC, enter anaphase, and segregate
chromo-somes. We conclude that KLP10A or CLASP/KLP10A RNAi
represent valid strategies to reduce kMT flux, while allowing
the formation of functional bipolar spindles in S2 cells.
Flux-associated kMT minus-end
depolymerization is down-regulated at anaphase onset and has a minor role in anaphase chromosome-to-pole motility in Drosophila S2 cells
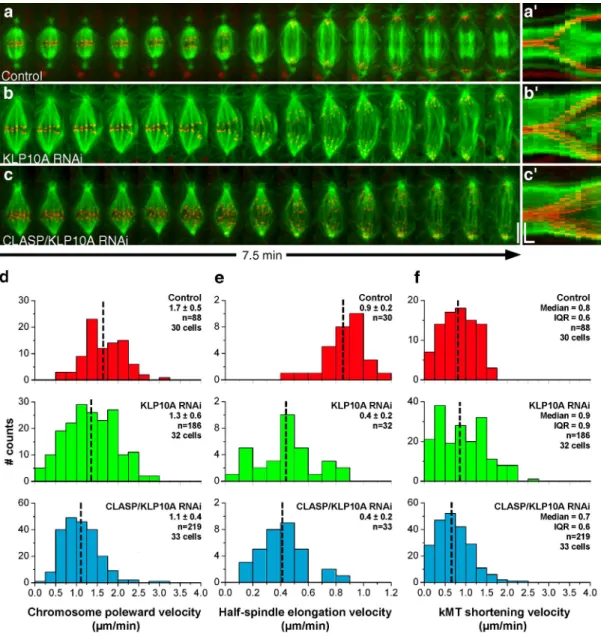
We next used dual-wavelength spinning-disk confocal
micros-copy to investigate the impact of reduced kMT flux on
chromo-some segregation. Anaphase poleward velocity of sister
chromatids after KLP10A or CLASP/KLP10A RNAi was
re-duced by
0.5 µm/min relative to controls. This reduction was
essentially caused by a KLP10A-dependent decrease in the
locity of spindle elongation and not reduced kMT shortening
ve-locity (Fig. 2, a–f; Table I). Because KLP10A is apparently not
required for the formation of the spindle midzone or recruitment
of kinesin-5 motors to this location (unpublished data), we
rea-soned that the slower spindle elongation could be caused by
in-creased resistance due to cortical interactions with the abnormally
on December 29, 2010
jcb.rupress.org
Table I. Summary of measured mitotic parameters
Experiment Metaphase flux velocity
Anaphase kMT minus-end depolymerization
velocity
Inter-KT distance measured from
fixed cells
Pixel intensity BubR1/CID
Inter-KT distance measured from
live imaging
Chromosome poleward velocity
[Vch]
Half-spindle elongation velocity [Vpole]
KMT shortening
velocity [Vch-Vpole]
µm/min µm/min µm µm µm/min µm/min µm/min
Control
M 1.2a 0.4a 1.0a 1.1 0.9a 1.7 0.9 0.8
SD 0.4 0.4 0.2 0.6 0.1 0.5 0.2 0.4
IQR 0.6 0.5 0.2 0.8 0.2 0.7 0.2 0.6
n 392 tracks; 23 cells
43 tracks; 8 cells
207 tracks; 34 cells
59 tracks; 9 cells
198 tracks; 21 cells
88 tracks; 30 cells
30 cells 88 tracks; 30 cells Control + colchicine
M 0.7
SD 0.1
IQR 0.2
n 56 tracks; 8
cells Control + MG132
M 1.1a 1.2
SD 0.2 0.6
IQR 0.4 0.7
n 125 tracks; 20
cells
57 tracks; 9 cells Control (Prophase)
M 0.4a
SD 0.1
IQR 0.2
n n = 102; 3
cells KLP10A RNAi
M 0.2a 0.9a 1.6 0.8a 1.3 0.4 0.9a
SD 0.3 0.2 0.9 0.1 0.6 0.2 0.6
IQR 0.2 0.2 1.2 0.2 0.9 0.3 0.9
n 105 tracks; 6 cells
137 tracks; 16 cells
50 tracks; 8 cells
267 tracks; 25 cells
186 tracks; 32 cells
32 cells 186 tracks; 32 cells KLP10A RNAi +
MG132
M 0.9
SD 0.2
IQR 0.2
n 50 tracks;
7 cells KLP10A RNAi +
(Prophase)
M 0.4a
SD 0.1
IQR 0.1
n n = 79; 3 cells
CLASP/KLP10A RNAi
M 0.2a 0.2a 1.0 1.7a 0.8a 1.1 0.4 0.7a
SD 0.4 0.4 0.2 1.7 0.2 0.4 0.2 0.4
IQR 0.6 0.4 0.2 1.4 0.2 0.6 0.2 0.6
n 208 tracks; 13 cells
51 tracks; 10 cells
159 tracks; 23 cells
51 tracks; 9 cells
241 tracks; 25 cells
219 tracks; 33 cells
33 cells 219 tracks; 33 cells CLASP/KLP10A
RNAi + MG132
M 1.1a 1.4a
SD 0.2 0.7
IQR 0.2 1.0
n 129 tracks;
20 cells
44 tracks; 8 cells
on December 29, 2010
jcb.rupress.org
long astral MTs observed after perturbation of KLP10A (Fig. 1,
h and j). Indeed, codepletion of KLP10A with Sas4, a protein
required for the formation of functional centrosomes and astral
MTs (Basto et al., 2006), restores normal spindle elongation
ve-locity (Table I and Fig. S1, a–d).
Our results show that a substantial decrease in metaphase
flux velocity does not significantly affect the mean velocity of
kMT shortening in anaphase. This finding is surprising in light of
the recent proposal that MT minus-end depolymerization
associ-ated with flux is the main force driving chromosome-to-pole
movement during anaphase in S2 cells (Buster et al., 2007). One
important difference between this previous report and our study
was our inclusion of a kinetochore marker and collection of
z stacks through the entire volume of the cell, which allowed us to
directly measure kMT shortening velocities for the full
chromo-some set. To investigate this further, we performed FSM in control
anaphase cells and found that kMT translocation velocity is
equiv-alent to that observed in metaphase, as revealed by the constant
Table I. Summary of measured mitotic parameters (Continued)
Experiment Metaphase flux velocity
Anaphase kMT minus-end depolymerization
velocity
Inter-KT distance measured from
fixed cells
Pixel intensity BubR1/CID
Inter-KT distance measured from
live imaging
Chromosome poleward velocity
[Vch]
Half-spindle elongation velocity [Vpole]
KMT shortening
velocity [Vch-Vpole]
CLASP/KLP10A RNAi (Prophase)
M 0.4a
SD 0.1
IQR 0.1
n 22 tracks;
2 cells Mad2 RNAi
M 0.8a
SD 0.2
IQR 0.2
n 122 tracks;
12 cels Mad2 RNAi
(Prophase)
M 0.4a
SD 0.1
IQR 0.1
n 54 tracks;
3 cells KLP10A/SAS4 RNAi
M 1.6 0.7 0.9
SD 0.6 0.2 0.5
IQR 0.6 0.2 0.7
n 84 tracks;
14 cells
14 cells 84 tracks; 14 cells Taxol
M 0.1a 0.7 3.3a
SD 0.2 0.1 2.0
IQR 0.2 0.1 3.4
n 73 tracks; 5 cells
44 tracks; 7 cells
42 tracks; 7 cells
Blank cells indicate that the value was not determined. KT, kinetochore; M, represents the mean, except for the distributions that do not follow a normal distribution; IQR, interquartile range; n, the number of measurements (in the prophase situation, n represents the number of interkinetochore distances measured before nuclear envelope breakdown).
aDistrubutions that do not follow a normal distribution, where median is represented.
slope of speckle tracks on kMTs (Fig. 3 a and Table I). Because
spindles elongate immediately after anaphase onset at
0.9 µm/
min in S2 cells, this indicates that MT minus-end
depolymeriza-tion must be attenuated by an equivalent rate. Indeed, we found
that >50% of the speckles move slower than 0.4 µm/min relative to
spindle MT minus ends (Fig. 3, a and c; and Table I), which is
con-sistent with a model where the extent of down-regulation of MT
minus-end depolymerization governs the rate of spindle
elonga-tion during anaphase (Brust-Mascher et al., 2004). Finally, the rate
of speckle movement relative to kMT minus ends in anaphase is
only marginally affected after RNAi depletion of CLASP/KLP10A,
which suggests that their flux-associated activities during
meta-phase in untreated cells are significantly down-regulated at
ana-phase onset (Fig. 3, b and c; and Table I). These results support the
finding that, as in human cells (Gorbsky et al., 1987; Ganem et al.,
2005), kinetochore motility coupled to MT plus-end
depolymer-ization (“Pac-Man” activity) is the main driver of anaphase
chromosome-to-pole movement in Drosophila S2 cells (Fig. 3 a).
on December 29, 2010
jcb.rupress.org
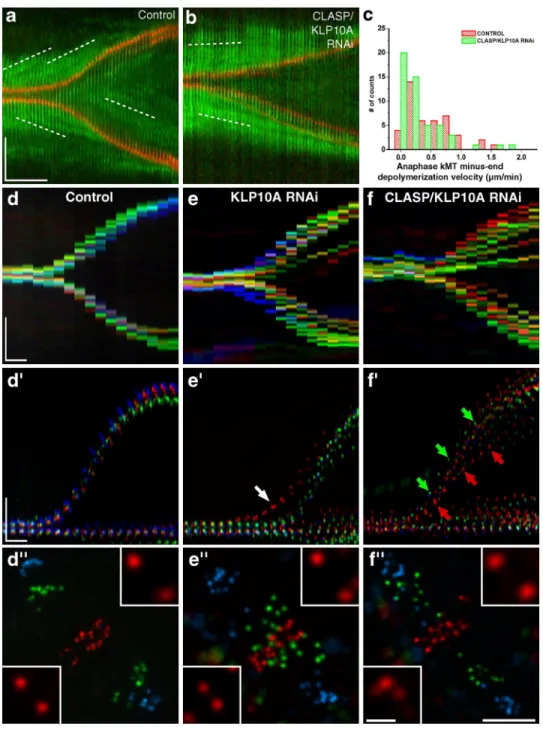
KMT flux ensures anaphase synchrony in Drosophila S2 cells
Although experimental attenuation of flux has only a minor
effect on mean kinetochore-to-pole velocity, we discovered that
it significantly impaired anaphase synchrony (Fig. 2, a–c
). To
measure the uniformity of chromosome segregation after
attenu-ation of flux, we developed a chromo-kymograph algorithm to
show the movements of multiple kinetochores as a function of
time through the metaphase–anaphase transition. In control
cells, we generally observed 2 main kinetochore tracks during
anaphase, which indicated synchronous segregation of
chromo-somes (Fig. 3, d and d
; n = 30 cells). After KLP10A or CLASP/
KLP10A RNAi, we typically found 3–12 kinetochore tracks per
cell (Fig. 3, e, e
, f, and f
; n = 31 cells for each RNAi), despite
the formation of normal metaphase plates. Closer inspection of
the chromo-kymographs revealed marked asynchrony in the
entry and/or poleward migration during anaphase (Fig. 3, d–f
).
One plausible explanation for the observed asynchrony during
anaphase could be the presence of kinetochores with merotelic
attachments (Cimini et al., 2004). Indeed, members of the
kinesin-13 family were implicated in correcting kinetochore–MT
attachments in human cells (Ganem et al., 2005; Bakhoum et al.,
2009). Therefore, it is possible that KLP10A, which localizes to
centromeres in addition to spindle poles (Rogers et al., 2004), is
also involved in this process. Analysis of KLP10A RNAi
spin-dles revealed the persistence of cold-resistant kMTs that were
indistinguishable from controls, which suggests normal
kineto-chore function (Fig. S1, e–g). Because the correction of merotelic
Figure 2. Analysis of chromosome and spindle dynamics during anaphase. (a–c) S2 cells stably expressing GFP–-tubulin (green) and CID-mCherry (red) were used to track kinetochore movement and spindle elongation during anaphase. Control (a), KLP10A RNAi (b), and CLASP/KLP10A RNAi cells (c). Bar, 5 µm. (a–c) Corresponding collapsed kymograph analysis. Horizontal bar, 60 s; vertical bar, 5 µm. (d) Distribution of chromosome poleward velocity in control, KLP10A, and CLASP/KLP10A RNAi. All RNAi treatments are statistically different from control (P < 0.05; Dunn’s test). (e) Distribution of spindle elongation velocity. All RNAi treatments were statistically different from controls (P < 0.001; Student-Newman-Keuls test). (f) Distribution of kMT shortening velocity in control, KLP10A, and CLASP/KLP10A RNAi. The differences were not statistically significant. The mean ± SD or median and inter-quartile range are indicated for each distribution. The mean or median values are marked with a broken vertical line.
on December 29, 2010
jcb.rupress.org
Figure 3. Analysis of chromosome segregation during anaphase. (a and b) S2 cells stably expressing low levels of GFP–-tubulin (green) and CID-mCherry (red) were used to track tubulin speckle movement (white broken lines) relative to spindle MT minus ends by FSM. (a) Control cell. (b) CLASP/ KLP10A RNAi cell. Note that in both cases, kinetochores approach the speckles. (c) Distribution of kMT minus end depolymerization velocity in control and CLASP/KLP10A RNAi cells. The differences are statistically significant (P < 0.05; Mann-Whitney test). (d–f) Chromo-kymograph analysis of kinetochores in control, KLP10A RNAi, and CLASP/KLP10A RNAi cells at the metaphase–anaphase transition. (d–f) Overlay of guided kymographs showing three kineto-chore pairs color coded red/green/blue. Arrows indicate precocious entry of anaphase (white) or differential poleward migration (green/red). (d–f) Respective projections of three different time frames. Red/green/blue frames correspond to 1, 3.5, and 7 min after anaphase onset. Insets highlight the kinetochore pairs where interkinetochore distances were maximum and minimum. Bars: (space) 5 µm; (time) 1 min; (inset) 1 µm.
attachments involves mechanisms acting before and during
ana-phase (Cimini et al., 2003), we quantified merotelic attachments
after KLP10A RNAi using two criteria: accumulation of Aurora B
at the inner centromere during metaphase (Knowlton et al.,
2006) and stretching of the merotelic kinetochore during
ana-phase (Cimini et al., 2004). We were unable to detect a
signifi-cant enrichment of Aurora B on metaphase plates after knocking
down KLP10A (Fig. S1, h–j). In contrast, our live-cell analysis
of anaphase did reveal a two-to-three–fold increase in the
per-centage of KLP10A (n = 31)- and CLASP/KLP10A (n =
29)-depleted cells with merotelic attachments in anaphase (13% and
10%, respectively, as opposed to 4% of control cells [n = 25]).
However, we never found more than one chromosome or
chro-matid with merotelic-attached kinetochores per depleted cell,
which is too infrequent to account for the observed level of
asyn-chrony in anaphase cells depleted of KLP10A or CLASP/KLP10A.
on December 29, 2010
jcb.rupress.org
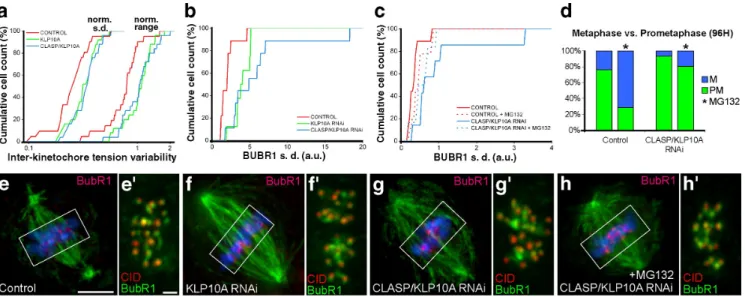
Figure 4. Experimental analysis of tension uniformity during metaphase. (a) Cumulative histogram for the normalized standard deviation (left) and range (right) of intracellular interkinetochore distances along a metaphase plate for control (n = 21), KLP10A RNAi (n = 25), and CLASP/KLP10A RNAi (n = 25), where n is the number of cells. CLASP/KLP10A RNAi is statistically different from control but not KLP10A RNAi (P < 0.05; Dunn’s test). (b) Cumulative histograms for the standard deviation of BubR1 fluorescence intensity for control (n = 10), KLP10A RNAi (n = 7), and CLASP/KLP10A RNAi (n = 7) cells. Both treatments cause a statistically significant variability relative to controls (P < 0.05; Dunn´s test). (c) Cumulative histograms for the standard deviation of BubR1 fluorescence intensity on metaphase kinetochores in control and CLASP/KLP10A RNAi before and after incubation with MG132 for 2 h. Note the approximation of the control and CLASP/KLP10A RNAi distributions after MG132 treatment. Only CLASP/KLP10A RNAi is statistically different from controls (P < 0.05; Dunn´s test). (d) Quantification of prometaphase and metaphase figures in fixed cells before and after MG132 treatment. Note that CLASP/KLP10A RNAi-treated cells have problems aligning chromosomes at the metaphase plate, which is slightly attenuated if additional time is provided by incubation with MG132. The asterisks indicate the presence of MG132. (e–h) Mitotic spindles from control, KLP10A RNAi, CLASP/KLP10A RNAi, and CLASP/KLP10A RNAi after MG132 treatment, respectively. -tubulin is shown in green, BubR1 in red, and DNA in blue. Bar, 5 µm. (e–h) Insets of the respective metaphase plates indicated in e–h, where CID is shown in red and BubR1 in green. Only cells with aligned chromosomes after CLASP/KLP10A RNAi were used for all quantitative analyses of metaphase. Bar, 1 µm.
Still, it remains possible that these numbers represent an
under-estimate of the full complement of merotelic attachments,
espe-cially more subtle cases, which cannot be resolved by the
abovementioned methods. We conclude that molecular players
involved in kMT flux may be implicated in correcting erroneous
kinetochore–MT attachments invisible to the SAC and somehow
help in ensuring the coordinated movement of chromosomes
during anaphase.
Anaphase synchrony reflects the uniformity of forces acting on metaphase kinetochores
Flux players may promote anaphase synchrony by mediating
the equalization of forces acting at kinetochores of metaphase
chromosomes. Indeed, measurement of interkinetochore
dis-tances as a readout of centromere tension in living metaphase
cells revealed that tension was highly variable between sister
kinetochore pairs after KLP10A or CLASP/KLP10A RNAi
(Fig. 4 a). In agreement, live-cell imaging of the tension-sensitive
protein BubR1 in KLP10A or CLASP/KLP10A-depleted cells
revealed that several kinetochores retain abnormal high levels
of BubR1, which correlated with a delayed initiation of
pole-ward migration and local degradation of the cohesin subunit
Scc1 (Fig. S2). Quantitatively, we confirmed that flux reduction
by these methods causes an increase in the variability of BubR1
at metaphase kinetochores, which is attenuated if cells are
allowed to stay in metaphase for 2 h by incubation with the
proteasome inhibitor MG132 (Fig. 4, b–h
).
Force equalization by flux can be explained by an MT-coupling model
In an attempt to explain how kMT flux contributes to the
unifor-mity of forces on metaphase kinetochores, we developed a
min-imal mathematical model for the metaphase spindle, which
assumes that kMT flux is driven by forces that are laterally
transmitted through a mechanical coupler cross-linking kMTs
with sliding ipMTs. In this context, antiparallel ipMT sliding
may be driven either by plus end–directed bipolar motors
(Brust-Mascher et al., 2009; Goshima et al., 2005) or by active
depolymerases at ipMT minus ends (Rogers et al., 2004). We
support the finding that forces are laterally transmitted to kMTs
based on the uninterrupted poleward translocation at near flux
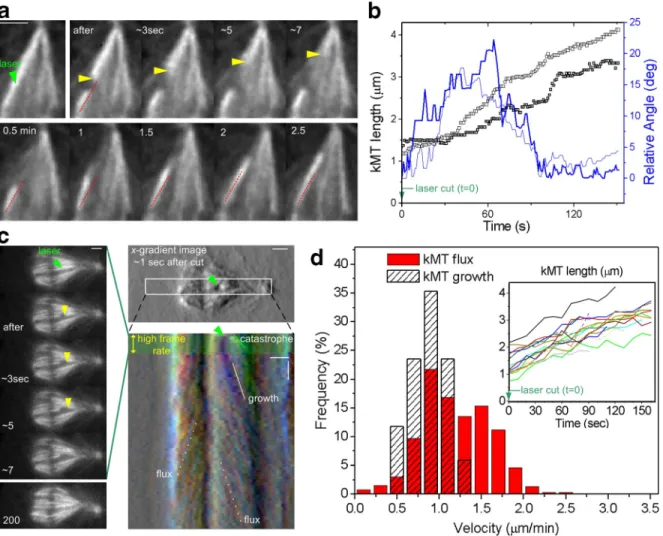
rates of laser-severed kMTs (Fig. 5, a–d; kMT growth = 0.9 ±
0.2 µm/min, n = 17; Table I), which don’t reach near the poles
and whose minus ends are not depolymerizing (Maiato et al.,
2004b), suggesting that kMT minus-end depolymerization by
itself is not a major flux-driving force.
We next simulated the mechanical behavior of the
pro-posed fluxing metaphase spindle model (Fig. 6 a; see Materials
and methods for details), where ipMTs translocate poleward
driven by a force
P (a generalization for non-ipMT forces is
discussed in Materials and methods). In this context, motor
force decreases with sliding velocity (Valentine et al., 2006), a
dependence that is assumed to be linear. ipMT sliding is not
free; instead, it is resisted by MT cross-linking or coupling,
here modeled as a serial linkage of viscous and elastic
ele-ments. This viscoelastic coupler cross-links spindle MTs, and
on December 29, 2010
jcb.rupress.org
plausible, however, that it applies to systems where chromosomes
do oscillate, given that MT poleward translocation is independent
of the directional state (poleward or antipoleward) of metaphase
chromosomes (Cameron et al., 2006).
Analytical solution of the model shows that two
charac-teristic time scales fully describe the system dynamics (Fig. 6 b;
and Materials and methods). First, mean interkinetochore
ten-sion at the metaphase plate tends exponentially to an
equilib-rium tension. Second, individual tensions converge exponentially
to the evolving mean tension within the timescale
τ
ε ε
λ
∆= +
+
− −
− −
k k f
c k
c k
1 1
1 1~ ,
(1)
hereafter referred as the equalization time, which in the high
cou-pling regime (
c=
and k
c=
) is simply
k/k
c. Importantly,
is
therefore acts as a mechanical mediator that allows force
transfer-ence between ipMTs and kMTs. As a result, kMTs are pulled
pole-ward, exhibiting flux, which is primarily resisted by friction at the
kinetochore–MT interface. We represent this friction as a viscous
interaction, T(t) =
kV
+(t), where T is the centromeric tension,
kis
the friction drag coefficient associated with kinetochore-MT affinity,
and V
+is the slippage/flux velocity of the MT relative to the
kineto-chore. Finally, the centromere is assumed to be linearly elastic,
with tension given by T(t) = k
kE
k(t), where k
kis the elastic constant
characterizing centromere stiffness and E
kis the interkinetochore
elongation resulting from an applied tension T. In parallel, all
n chromosomes are described by equivalent interdependent
equa-tions. The mechanical coupling between adjacent MTs integrates
the system, which will react globally to local events on individual
chromosomes. For simplicity, this model disregards position and
velocity-dependent forces driving chromosome oscillation. It is
Figure 5. KMT fiber regrowth after laser microsurgery at near-flux velocity. (a) Selected frames of a laser microsurgery experiment on a kMT fiber dur-ing metaphase. The readouts for a successful laser cut are (1) a catastrophe of newly created kMT plus ends (20 µm/min) and (2) reorientation of the kinetochore-associated MT fiber after a laser cut (red lines have equal length and slope). (b) kMT fiber length and orientation over time after microsurgery. Data points correspond to two high-speed acquisitions (light and dark lines) in kMT fibers associated with chromosomes positioned at the periphery of the metaphase plate. The relative angle corresponds to the fiber deviation from the initial (presurgery) orientation. (c) FSM during metaphase after laser microsurgery on a kMT fiber. A first high-speed acquisition phase (1 s interval) is used to confirm the catastrophe of newly created kMT plus ends (left). After the catastrophe, images are acquired at a 10-s interval to observe kinetochore-associated MT fiber growth and intact kMT fiber flux, as revealed by the chromo-kymograph. The kymograph is based on intensity-gradient images along the horizontal direction, which helped observation of the minus ends of a growing kMT fiber. Green arrowheads in a and c indicate the location of the laser cut. Yellow arrowheads indicate the catastrophe of newly created kMT plus ends after surgery. (d) Velocity distributions of growing kMT fibers after laser microsurgery and of poleward flux, i.e., translocating intact kMT fibers. The elongation of kMT fibers was tracked and is shown in the inset. Bars: (space) 2 µm; (time) 1 min.
on December 29, 2010
jcb.rupress.org
to dynein; Yang et al., 2007) at the kinetochore–MT interface (see
Materials and methods).
Using dimensional analysis, a trade-off between low
kinetochore–MT affinity (resulting in low tension) and high
kinetochore–MT affinity (leading to high tension but slow
equalization) may be found in the form of a centromeric power
yield, reflecting the fact that centromeric elastic energy should
maximally and uniformly accumulate in the metaphase plate in
the shortest possible time (Fig. 6, c and d; and Materials and
methods). An optimal flux regime is found for high coupling
and when kinetochore–MT attachments are strong/weak enough
to allow metaphase flux at a velocity between one and three
eighths of the unloaded velocity of motors that slide ipMTs
(note that these figures are strongly dependent on the shape of
the force–velocity relation characterizing motor activity).
Fi-nally, the model predicts that ipMT flux is faster than kMT flux
also the characteristic decay time of the tension standard
devia-tion on the entire chromosome set, and therefore represents a
global measure of the tension equalization time in the spindle.
and f are, respectively, typical elastic deformation and flux
veloc-ity scales of the metaphase spindle. The magnitude for
lies
be-tween interkinetochore stretch (typically around 0.5 µm; Waters
et al., 1996; Maddox et al., 2003; Meraldi et al., 2004; Maiato
et al., 2006) and MT–coupler stretch, which should be less than
one half the spindle length (typically 5–15 µm; Waters et al., 1996;
Gaetz and Kapoor, 2004; Goshima et al., 2005; Bird and Hyman,
2008). Using f of
1 µm/min we get from Eq. 1,
= 0.5–15 min.
This estimate is in agreement with metaphase duration in several
systems (Rieder et al., 1994; Meraldi et al., 2004; Maiato et al.,
2005; Brust-Mascher et al., 2009), regardless of the different
number of chromosomes (note the independence of n), and is not
affected by the introduction of a tension-assisting force (e.g., due
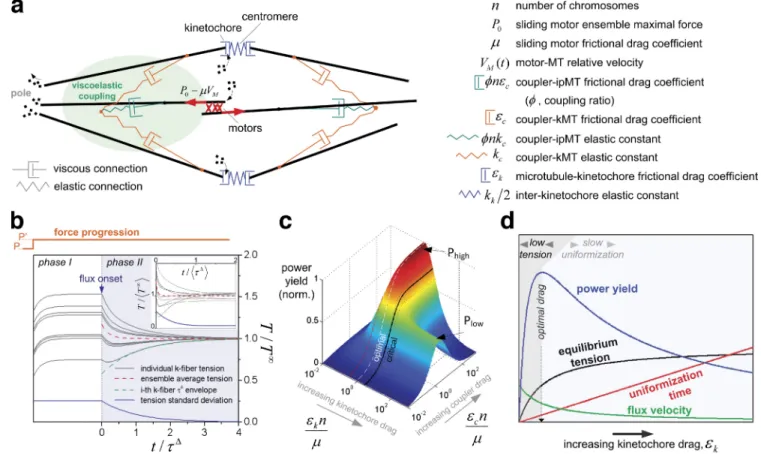
Figure 6. MT coupling leads to tension uniformity in the presence of flux. (a) Spring-dashpot (elastic-viscous) functional representation of the coupled spindle. Viscous and elastic elements describe both coupler–MT and MT–chromosome interactions. (b) Normalized centromeric tensions as a function of normalized time without flux (phase I) and with flux (phase II). A force P generates initial (random) tension values. A step-increased force (P) is applied to the system (see “force progression” above the graph). First, to simulate a nonfluxing spindle, phase I shows the system dynamics when no slippage is allowed at the viscous connections, i.e., totally rigid kinetochore–MT and coupler–MT attachments. The system reaches a static (stretched) state when elastic force balances the applied force. Tension heterogeneity (as measured by the standard deviation, blue line) does not decrease because slippage-mediated tension redistribution does not occur. At t = 0, viscous drag coefficients drop to a finite value, allowing slippage to begin (phase II). Throughout phase II, tensions converge with timescale to the mean tension, which itself decreases (red broken line) to a new asymptotic level T. The inset shows the system
behavior when kinetochore–MT attachment drags are variable among chromosomes on the same metaphase plate, following a normal distribution with full width equal to 10% of the mean. (c) Power yield of the mechanical system as a function of normalized MT–coupler drag and normalized kinetochore–MT drag. The system reaches a plateau of highest efficiency (Phigh) when kMTs are tightly coupled to ipMTs (high coupler drag) but only partially coupled to
kinetochores (intermediate kinetochore drag). A secondary plateau (Plow) is found if kinetochore drag is higher than a critical value (black line; sub- and
supracritical black broken lines are also shown), a condition in which it is beneficial to have a finite coupler drag and infinite kinetochore drag (no kMT flux). Critical kinetochore drag represents an unbiased estimate of the maximal drag expectable for fluxing spindles; i.e., the minimum flux. The critical point-associated power may be used to define the low end of expected drag (red broken line). (d) Summary of the system behavior as a function of kineto-chore–MT drag in the high-coupling regime. High kinetochore drag maximizes tension at equilibrium, but it comes at the expense of a long equalization time. The reverse happens for low kinetochore drag, suggesting optimal behavior in an intermediate situation (maximal power yield), where flux velocity is not zero and not as high as it could be if generated by free ipMT motors.
on December 29, 2010
jcb.rupress.org
further work, thus providing extra tension to other chromosomes.
Sustained slippage events occurring along the metaphase plate
eventually drive the spindle to an equilibrium state characterized
by homogeneous tension. An analogy to this tension
redistribu-tion mechanism is illustrated in Fig. 8. Tension equalizaredistribu-tion
dur-ing metaphase ensures that any mechanism relydur-ing on tension,
such as the maturation and correction of kinetochore–MT
at-tachments (Nicklas and Ward, 1994; King and Nicklas, 2000;
Liu et al., 2009), recruitment of SAC proteins (Pinsky and
Biggins, 2005; Musacchio and Salmon, 2007), or even the
coor-dination of cohesin degradation between sister chromatids (this
study) operates uniformly along the metaphase plate.
The close match found between equalization time and
metaphase duration is, in our opinion, the strongest support for a
flux-dependent mechanism for tension equalization. However,
such correlation poses a delicate question regarding the
relation-ship between equalization time and the SAC. One possibility is
that SAC silencing requires that all chromosomes overcome a
given tension threshold. In fact, a uniform distribution of tension
maximizes the probability of globally surpassing any threshold.
Alternatively, SAC satisfaction may rely only on MT occupancy
at kinetochores. A cell with a satisfied SAC in the absence of
such tension equalization mechanism would be expected to
seg-regate its chromosomes at distinct times and/or with distinct
ve-locities. Because metaphase duration is not significantly affected
after experimental perturbation of flux, and acceleration of
mito-sis precludes tension equalization, a plausible explanation for the
observed asynchronous chromosome segregation is the reduced
as a result of imperfect force transmission, a feature indeed
ob-served in several systems (Maddox et al., 2003; LaFountain et al.,
2004; Yang et al., 2008; see Materials and methods).
The SAC extends the duration of mitosis to allow the uniform distribution of forces acting on metaphase kinetochores
If cells require time for a uniform distribution of tension on
meta-phase chromosomes, one would predict that acceleration of
mito-sis prevents this equalization. Mad2 is a key signaling component
of the SAC that extends the duration of mitosis until all
kineto-chores are attached to the spindle (Meraldi et al., 2004). Indeed,
RNAi depletion of Mad2 in S2 cells (Fig. 7 a) significantly
accel-erated mitosis so that cells entered anaphase prematurely (Fig. 7 b;
see Orr et al., 2007). Additionally, Mad2-depleted cells that were
able to form a metaphase plate showed increased
interkineto-chore tension variability (Fig. 7 c) and underwent asynchronous
chromosome segregation during anaphase (Fig. 7 d–d
). These
results support our theoretical prediction that cells require time
for a uniform distribution of forces acting on kinetochores.
Discussion
In this paper, we propose that flux-associated slippage of MTs at
kinetochores allows spindle forces to become evenly distributed
along the metaphase plate. The rationale behind this model is
that MT slippage at a given kinetochore interface reflects a
me-chanical relaxation event that allows ipMT sliding motors to do
Figure 7. Tension uniformity and synchrony analysis after acceleration of mitosis. (a) Western blot showing Mad2 depletion 96 h after RNAi. -tubulin was used as loading control. (b) Cumulative histogram for the normalized standard deviation (left) and range (right) of intracellular interkinetochore dis-tances along a metaphase plate for control (n = 21) and Mad2 RNAi (n = 12), where n is the number of cells. Mad2 RNAi is statistically different from controls (P < 0.05, Student t test). (c) Metaphase duration in control, KLP10A RNAi, CLASP/KLP10A RNAi, and Mad2 RNAi cells, where n represents the number of cells capable of forming a metaphase plate. The box plot determines the interquartile range, the line inside the box represents the median, the point inside the box represents the mean, and the whiskers determine the limits of the distribution disregarding outliers. Mad2 RNAi is the only treatment that is statistically different from controls (P < 0.001, Mann-Whitney test). (d–d) Kymograph (d), collapsed kymograph (d), and cromo-kymograph (d) analysis of a representative Mad2-depleted cell. Vertical scale bar, 10 µm; horizontal time bar, 1 min.
on December 29, 2010
jcb.rupress.org
complex to MTs, which impairs kMT flux and turnover, while
causing a 50% reduction of CLASP levels at kinetochores in
Ptk1 cells (DeLuca et al., 2006). It is interesting to note that,
although in this cell type the described perturbation leads to
hyperstretching of the centromere without affecting spindle
bipolarity, CLASP RNAi in S2 cells leads to spindle collapse
without any obvious increase in interkinetochore tension
(Maiato et al., 2005). These different responses might reflect
mechanical peculiarities associated with each cell type. KLP10A
depletion likely prevents MT depolymerization at the poles,
leading to increased resistance to kMT poleward translocation
and consequent flux reduction (see Materials and methods).
Similar to polymerization at the kinetochore, depolymerization
at the pole seems essentially a reactive mechanism that
regu-lates kMT length upon translocation. Additionally, localization
of KLP10A at the centromeres may account for the observed
role in the correction of erroneous attachments described in this
paper, which may be intrinsically coupled to its role in flux.
One important outcome of asynchronous chromosome
segregation is the increased risk of aneuploidy. Recent work in
budding yeast, which lack any detectable flux (Maddox et al.,
2000), provided a molecular explanation for the abrupt
degrada-tion of cohesins at anaphase onset (Holt et al., 2008). It is
note-worthy that budding yeast do not align their chromosomes at the
cell equator and rely heavily on spindle elongation for accurate
chromosome segregation (Straight et al., 1997). In contrast,
animal and plant cells establish a metaphase plate, a high-order
state that is only justified if the subsequent synchronous
migra-tion of sister chromatids is ensured, where a mechanism
in-volved in force equalization may be essential. The emergence of
capacity to evenly mature and correct kinetochore–MT
attach-ments that nevertheless satisfy the SAC. Recent works support the
finding that interkinetochore tension is dispensable in satisfying
the SAC (O’Connell et al., 2008; Maresca and Salmon, 2009;
Uchida et al., 2009). However, tension may provide an important
readout to allow the detection and correction of potential errors
be-fore anaphase onset (Pinsky and Biggins, 2005). Indeed,
applica-tion of tension to kinetochores is known to promote its saturaapplica-tion
with MTs (King and Nicklas, 2000), possibly by increasing MT
stability due to spatial separation of kinetochore substrates from
Aurora B at centromeres (Liu et al., 2009). However, maximizing
tension by firmly grabbing MTs at their kinetochore attachment
sites would not only prevent the release of erroneous attachments,
but also hinder kMT flux/slippage, which could lead to
chromo-some segregation defects (Ganem and Compton, 2006; Bakhoum
et al., 2009). Therefore, at the expense of some local loss of
ten-sion, MT affinity at kinetochores must be regulated to allow MTs
to slip and possibly detach. According to our MT-coupling model,
the system will respond globally to equilibrate tensions, and,
con-sequently, all tension-dependent processes, precluding the need for
tight spatial regulation of force distribution.
Our experimental perturbation of kMT flux involved
down-regulation of CLASP and KLP10A, which appeared not
to be implicated in force production but rather on how the
spin-dle responds to it. Localization of CLASP at the kinetochore
and its requirement for kMT flux away from the kinetochore
(Maiato et al., 2005) suggest that its main function is to regulate
the affinity of kMT attachments by decreasing the frictional
drag (
k). In support of this conclusion, preventing Hec1
phos-phorylation by Aurora B increases the affinity of the Ndc80
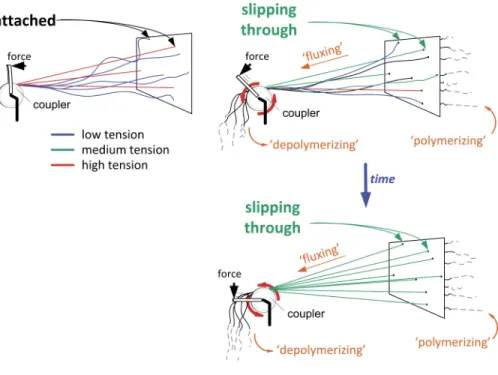
Figure 8. Schematic representation of the flux-dependent tension redistribution principle.
Several cables (representing kMTs) with random lengths are firmly attached to the wall (repre-senting chromosomes at the metaphase plate). Cables are connected to a coupler, which is subjected to a “rotating force” (torque). In the “no flux” condition (left), the coupler will only rotate up to the point where the first cables be-come under tension, a point in which they resist further rotation: the system reaches a static equi-librium characterized by large tension hetero-geneity. In the strict analogy of inextensible cables, a maximum of three cables experience tension. The “flux” condition (right) is charac-terized by a single modification: instead of be-ing firmly attached, cables are now passbe-ing through tight holes in the wall and thereby slip, although not freely, in response to the applied force. Cable “growth” by slippage allows the coupler to keep rotating, eventually leading to stretching (i.e., development of tension) in previously relaxed cables. The system eventu-ally reaches a dynamic equilibrium, character-ized by tension homogeneity, although at the expense of diminished mean tension. For clar-ity, we represent a point-coupler instead of an extended structure. Rotation of the motorized coupler emulates the linear “hand-over-hand” dynamics that characterize permanent attach-ment/detachment dynamics of system motors/ cross-linkers, which allows maintenance of the coupler “position.”
on December 29, 2010
jcb.rupress.org
τ φ
µ φ ε ε
∞ − − − − − − − =
(
+)
+ + +(
)
+ 1 11 1 1
1 1 1 1 k k
n
c k
c k
,
to the equilibrium tension
T T t
P n P n i k c ∞ ∞ − ∗ = = + + + = +
( τ ) ,
µ ε φ ε µ ε 0 1 0
1 1
(5)
where * is defined as the friction drag coefficient coupling ipMTs to kinetochores. At equilibrium, kMT fiber slippage velocity (or flux veloc-ity) is V+∞=T∞ εk. As * increases, T tends to its maximum value P0/n, a condition in which flux velocity would drop to zero. If *
de-creases, kMT flux velocity tends asymptotically to V0/2, where V0 is the
free motor velocity.
For the second step, we study how any individual centromere ten-sion Ti approaches the evolving mean tension T E, where the subscript
denotes that averaging is done along the chromosome ensemble. The time-scale of the decay of Ti− T E is equal to that of ∆Tij≡ −Ti Tj, where i and j are any distinct chromosomes. We calculate Tij using Eq. 4, where
the summation terms vanish, yielding
k k T t T t
c− + k− ij c− k− ij
(
1 1)
∆( )+(
ε 1+ε 1)
∆ ( )=0.Thus, individual tension levels redistribute by approaching each other (and the mean tension) in the timescale defined by
τ ε ε ∆= + + − − − −
kc kk
c k
1 1 1 1,
the equalization time.
We assumed throughout that the system’s viscous and elastic properties may be characterized by bulk magnitudes for both MT– kinetochore and MT–coupler interactions. Regarding coupling, the model assumes that all kMT fiber pairs are (1) equally coupled to each other and (2) equally coupled to the ipMTs. However, we let the coupling effi-ciencies 1 and 2 be different, which is reflected by the coupling ratio parameter . This factor allows variation of ipMT number or its substitu-tion by other (non–MT dependent) motorized structures. For example:
= 1 represents a spindle in which ipMT-coupler total drag is equiva-lent to kMT-coupler total drag; = may represent a situation in which the number of ipMTs is very large, with its connections to the coupler being dominant relative to kMT connections to the coupler, or the case of a non-ipMT–based force generation mechanism, which is tightly bound to the coupler.
Ratio between ipMT and kMT poleward translocation velocities
At equilibrium, the ratio between the translocation/flux velocity of ipMTs and kMTs, R, is given by
R
V V
M k k
c ≡ ∞ = = + +
(
)
+∞ ∗ − ε ε φ ε ε1 1 1 ,
where we used Eq. 5 along with the relationsP0−µVM∞=nT∞and
εkV+∞=T∞. In general R > 1 unless the perfect-coupling regime strictly
holds (c = ). We did not determine this factor experimentally because
of the low number of fluxing ipMTs that we were able to measure, but it has been consistently shown in several systems, including Drosophila S2 cells, that R > 1 (Maddox et al., 2003; LaFountain et al., 2004; Goshima et al., 2005).
Optimal performance of the model mechanical system
We now study the trade-off between loose and tight attachment at the microtubule–kinetochore interface. In search of a compromise, we maxi-mize tension and minimaxi-mize redistribution time by defining a dimension-ally meaningful parameter to be maximized, Ω∝T∞2
( )
kkτ∆ (Fig. 6 c), which is a measure of centromeric power. Power maximization reflects the fact that the physical system is tuned to allow the largest fraction of the available energy in the spindle to be uniformly accumulated in the form of elastic energy at the metaphase plate within the shortest possibleflux in higher eukaryotes and its contribution to anaphase
“qual-ity” may play particularly important roles in the prevention of
chromosomal abnormalities observed in cancers or in several
human syndromes, many of which result from defects in
chromosome segregation during meiosis, where flux is indeed
maintained at high rates.
Materials and methods
Model description
We supported in the main text the finding that poleward translocation of spindle MTs allows the spindle to relax by passively redistributing excess tensions, thereby smoothening initial deviations from average tension. The underlying model is defined by the mechanical circuit in Fig. 6 a in the main text and in the scheme below, which represents a “half-spindle,”
where Vpre is the pre-junction coupler dashpot slippage velocity, Vpost,i is
the post-junction coupler dashpot slippage velocity (chromosome-indexed), Epre is the pre-junction spring strain, Epost,i is the post-junction spring strain
(chromosome-indexed), V+,i is microtubule-kinetochore relative velocity
(chromosome-indexed), and Ek,i is the interkinetochore strain
(chromosome-indexed). To represent the system mathematically, we first use the homo-geneous stress condition, i.e., the sum of forces along o is equal to that along o or along any other parallel plane. Assuming linearity of the motor force–velocity (F-V) relation and of all elastic and viscous responses in the spindle we get
P V t n V t nk E t
k E t V
M c pre c pre
c post i
i n c p
0
1
− = = =
= =
=
∑
µ φ ε φ
ε
( ) ( ) ( ) ( )
,
, i n oost i i n k i i n k k i
t V t k E t
,
, , , , ,
( )= ( )= ( ),
=
∑
1 =∑
1 + =∑
1ε
(2)
where Ti≡k Ek k i, is the centromeric tension at the i-th chromosome. Second, using the additive strain condition along a path connecting p to the i-th chromosome ci,
V tM( )=Vpre( )t +Epre( )t +Epost i,( )t +Vpost i,( )t +V+,i( )t +Ek,ii( ).t
(3)
Using Eq. 2 to substitute the terms in Eq. 3, we get the ordinary differential equation (ODE) that governs the system dynamics. The j-th centromere tension is given by
(4)
1 1 1 1 1
1
φnkci T ti k k T t µ φ εn T t
n
c k j c i i
( ) ( ) ( ) = =
∑
+ + + + 110 1 1
n
c k j
T t P
∑
+ + = ε ε ( ) µ.
To gather an intuitive understanding of the system behavior, we separate the problem in two parts. First we follow the evolution of the ensemble- averaged centromeric tension and then focus on how individual centro-mere tension levels approach the evolving mean tension. For the first step we simply need to calculate
(
Eq. 4)
=
∑
i n 1 , giving1 1 1 1 1
1 1 0 + + + + + + = − = −
∑
φ µ φ ε εk k T t
n
T t nP
c k i i
n
c k i
( ) ( ) µµ i n =
∑
1 ,a first-order ODE with a solution given by a single exponential that decays in a characteristic time
on December 29, 2010
jcb.rupress.org
RNAi
RNAi depletion of Drosophila CLASP, KLP10A, and Mad2 in S2 cells was performed as described previously (Rogers et al., 2004; Maiato et al., 2005; Orr et al., 2007). Phenotypes were quantified by light microscopy every 24 h over 7 d. Protein knockdown was monitored by Western blotting using the following antibodies and dilutions: rabbit CLASP and anti-Mad2 (gifts from C. Sunkel, Instituto de Biologia Molecular e Cellular, Univer-sity of Porto, Portugal) 1:600 and 1:3,000, respectively; rabbit anti-KLP10A (gift from J. Scholey, University of California, Davis, Davis, CA) 1:1500; and mouse anti–-tubulin clone B512 (Sigma-Aldrich) 1:10,000. Secondary antibodies were visualized using the ECL system (GE Healthcare).
Drug treatments
To suppress MT dynamics in S2 cells, we used 10 nM taxol for 10 min be-fore time-lapse recording or immunofluorescence processing. Whenever indicated, the proteasome inhibitor MG132 was used at 20 µM for 2 h. To determine the interkinetochore rest length, we treated S2 cells with 30 µM colchicine for 2 h to induce MT depolymerization.
Immunofluorescence microscopy
S2 cells were grown on 0.5 mg/ml concanavalin A (Sigma-Aldrich)-coated coverslips and processed for immunofluorescence as described previously (Maiato et al., 2004b). Primary antibodies were rabbit anti–-tubulin (1:500; gift from A. Debec, Institut Jacques Monod, Paris, France); mouse anti–-tubulin clone B512 (1:1500; Sigma-Aldrich); rabbit anti-BubR1 and anti-Scc1 (1:2,000 and 1:500, respectively; gifts from C. Sunkel); chicken anti-CID (1:300; gift from G. Karpen, University of California, Berkeley, Berkeley, CA); rabbit anti-Aurora B (1:500; a gift from M. Carmena and B. Earnshaw, University of Edinburgh, Edinburgh, Scotland, UK). All fluorescent-conjugated secondary antibodies were from the Alexa Fluor series (Invitrogen). Quantitative 3D datasets were collected using a wide-field microscope (Imager.Z1; Carl Zeiss, Inc.) equipped with a charge-coupled device (CCD; Axiocam MRm) and using a 100×, 1.4 NA oil immersion objective lens at 0.25 µm z steps, using Axiovision software. For an imag-ing medium, we used 89.5% glycerol, 10% 1 M Tris-HCl, pH 8.5, and 0.5% N-propyl-gallate. Images were subsequently blind deconvolved with AutoDeblur X2 software (Media Cybernetics) and processed for publica-tion using Photoshop CS3 (Adobe).
Time-lapse microscopy
S2 cells stably expressing GFP–-tubulin (a gift from R. Vale, University of California, San Francisco, San Francisco, CA) and CID-mCherry (the mCherry cDNA was provided by R. Tsien, University of California, San Diego, La Jolla, CA) or mRFP-BubR1 (mRFP-BubR1 construct was modi-fied from a vector provided by R. Karess, Institut Jacques Monod, Paris, France) were grown on concanavalin A–coated coverslips and mounted in modified Rose chambers with Schneider´s medium (Sigma-Aldrich) containing 10% FBS. 4D datasets covering the entire cell volume were collected every 30 s with 1-µm z steps with a 100× 1.4 NA Plan- Apochromatic objective at 25°C with a Revolution Spinning Disk confo-cal system (Andor) equipped with an electron multiplying CCD (EMCCD) iXonEM+ camera, two laser lines (488 and 561 nm), and a Yokogawa
CSU-22 unit based on an inverted microscope (IX81; Olympus) and driven by Andor IQ.
Fluorescent speckle microscopy
To measure flux rates, we used S2 cells stably expressing GFP–
-tubulin under the control of a leaky inducible metallothionein promoter (a gift from R. Vale) and CID-mCherry. Without induction, low levels of GFP–-tubulin are expressed. Time-lapse images were collected every 5 s at 25°C with an inverted microscope (TE2000U; Nikon) equipped with a CoolSNAP HQ2 CCD camera (Photometrics) using a 100× 1.4 NA Plan-Apochromatic objective, and driven by NIS elements (Nikon). Images were subsequently blind-deconvolved with AutoDeblur X2 (Media Cybernetics).
Guided kymography
In order to either kymograph the entire spindle or to prepare the data for local kymograph analysis, we used a custom routine written in Matlab (The MathWorks, Inc.) to compensate for spindle rotation and translation de-scribed by the following steps: (1) 2D tracking of spindle poles, (2) region-of-interest (ROI) dimensions definition, and (3) thick-kymograph generation with the ROI being automatically translated and rotated every frame ac-cording to the 2D coordinates of the two reference objects in step 1. The direct output is a whole-spindle kymograph that can be used to generate a time. The optimal regime is found to occur for high coupling (c = ) but
with intermediate k (see Fig. 6 c). Optimal k is independent of and
given by εkoptimal =µn−1, which leads to an equilibrium tension equal to half its maximum value T = P
0/(2n), or a flux velocity equal to V0/4.
A critical value of
εkcritical=µn−1
(
1 2+ φ−1)
,which corresponds to a flux velocity of V0/[4(1 + 1)], may be
found above which k = always maximizes Ω, a condition in which
equalization is achieved solely by slippage at the coupler–MTs interface but at the expense of a reduced power yield: Ωmax,high-coupling/
Ωmax,high-attachment = 1 + 1.
In summary, the mechanical system in Fig. 6 a will behave most efficiently if kMTs are strongly coupled to the poleward force-generating structures (and therefore between them), whereas their attachment to kinetochores allows kMT flux velocity between one and three eighths of the maximal motor velocity when ipMTs and kMTs have comparable attach-ments to the coupler ( of 1). This range is broadly consistent with the observed magnitude of flux velocities in different systems if it is assumed that motors with 5 µm/min free velocity are responsible for ipMT slid-ing. We stress that nonlinearities in the motor F-V relation will shift this optimal regime.
Effect of polar resistance to microtubule poleward translocation
We have presented a model for the “wild-type” spindle. To study the possi-ble effect of KLP10A depletion on metaphase spindle tension and dynam-ics, we introduced a set of polar viscous elements antagonizing microtubule sliding. We assume these dashpots to be anchored (e.g., by astral MTs at the cortex). Adding such viscous term pV,i, where V−,i =V+,i+Ek i,, is the depolymerization velocity, to Eqs. 2 and 3 yields a second-order ODE with overdamped solutions that tend to an equilibrium tension given by
T
P
n
o
p
k c k
∞ − = + + + + µ ε ε φ
ε µ ε
1 1 1 1 ,
where p is the viscous drag at the poles. As expected, an increase in p
leads to decreased centromeric tension, which, however, may be recov-ered by an increase in k. This is in broad agreement with mean tension
re-covery (as measured by interkinetochore distance) in KLP10A RNAi followed by codepletion of CLASP (Table I). However, flux velocity at equi-librium, given by V+∞ =T∞ εk, will drop upon increased p or k. Polar
re-sistance will in general lead to an increased equalization time, which for stiff coupling (kc→) is given by
τ
ε ε ε
∆=
+ +
1
1 1 kk
c p k
.
Effect of an active tension-generating mechanism at the kinetochore
An offset force component, Fk, may be introduced in the model to account for
kinetochore-based tension generation, possibly by minus end–directed mo-tors like dynein (Howell et al., 2001; Yang et al., 2007). Tension is then given by T ti( )=εkV+,i( )t +Fk. For clarity, we describe Fk as a fraction f of the
maxi-mum tension deliverable by an equilibrated spindle, Fk = fPo/n. Only the
constant term in Eq. 4 is modified, with the RHS becoming P0
(
µ−1+fn− −1 1εk)
, which naturally doesn’t change the timescales that describe the system, or . However, equilibrium tension is now increased toT P f n n o k c k ∞= + + + + 1 1
1 1 1
µ ε
µ
ε φ ε
.
To first order in f, optimal behavior (see “Optimal performance of the model mechanical system”) occurs for µεk optimal−,1 ≈n
(
1 4+ f)
, valid for f1, with c = . This means that introduction of an active tension-assistingcomponent at the kinetochore shifts the optimal behavior to the slightly in-creased flux velocity V0(1 + f)/4.