UNIVERSIDADE DE LISBOA
Faculdade de Medicina Veterinária
EQUINE EXERCISE ELECTROCARDIOGRAM: STANDARDIZED LUNGEING TEST
VANESSA CORDEIRO SANTOS
CONSTITUIÇÃO DO JÚRI
Doutor José Paulo Pacheco Sales Luís Doutora Paula Alexandra Botelho Garcia de Andrade Pimenta Tilley
Doutor Luís Ressano Garcia Pardon Lamas
ORIENTADORA
Doutora Paula Alexandra Botelho Garcia de Andrade Pimenta Tilley
2016 LISBOA
UNIVERSIDADE DE LISBOA
Faculdade de Medicina Veterinária
EQUINE EXERCISE ELECTROCARDIOGRAM: STANDARDIZED LUNGEING TEST
VANESSA CORDEIRO SANTOS
DISSERTAÇÃO DE MESTRADO INTEGRADO EM MEDICINA VETERINÁRIA
CONSTITUIÇÃO DO JÚRI
Doutor José Paulo Pacheco Sales Luís Doutora Paula Alexandra Botelho Garcia de Andrade Pimenta Tilley
Doutor Luís Ressano Garcia Pardon Lamas
ORIENTADORA
Doutora Paula Alexandra Botelho Garcia de Andrade Pimenta Tilley
2016 LISBOA
ii
Acknowledgments
My parents for all their values and wisdom, all the sacrifices they made for our education, for relying on me their trust and support thought these years, and for always being there when no one else could be;
My sisters for showing me the path I was going to follow one day, teaching me its perks and rules. Especially Cláudia, who has always been my undeniable best friend and supporter;
To all my family for the encouragement they always gave to their little alien;
My hometown and childhood friends, for spending with me unforgettable moments, and always providing me incredible joy and happiness, throughout the best and worst phases of my life;
My faculty friends for sharing with me the academic life in all its memorable moments; My friends from Barcelona, for helping me rediscover myself and my dreams, and spending with me the best year of my life so far;
My friends from Gent for demonstrating that work and fun don’t always need to be separated from each other, and can actually result in a delightful fusion.
To Prof. Gunther van Loon, and especially Dr. Dominique De Clerq, for their valuable kindness, attention and help, which was more than I could ever hope for, given the fact that I was only their temporary student;
Prof. Paula Tilley for her kindness, availability and guidance throughout this final stage of my academic journey;
Dr. Hugo Rosa and Dr. José Macedo Tomás from the National Guarded Police for their precious kindness, teachings and guidance;
iii
Abstract
Cardiovascular lesions are common in horses, but these lesion are often minor and well tolerated by the horses. However, some cardiovascular lesions can become clinically significant, manifesting as poor performance or even exercise intolerance, arrhythmia, weakness, systemic infection, congestive heart failure, or sudden death. (Bonagura & Reef, 2004)
Arrhythmias may cause uncertainty to the equine practitioner especially when diagnosed in resting animals. They must be distinguished as being normal due to variations in autonomic tone (‘physiological’ arrhythmias), or as being caused by cardiac abnormalities. Although rest examination is critical to diagnose many clinical problems, exercise tests can help assess dynamic cardiac problems. Exercise testing can be conducted in a treadmill laboratory or in the field. There are advantages and disadvantages for both types of exercise test. However, both protocols might be difficult to implement, and their availability can be limited.
This study is focused on evaluating a protocol for standardized lungeing exercise test which was included in the protocol for cardiac examination, used to evaluate cardiac arrhythmias. Lungeing usually is part of most horse’s training, and they can be walked, trotted, and galloped, and induce high levels of exertion, so performing it as an exercise test doesn’t need sophisticated instruments nor specialized people, allowing it to be implemented with less limitations, as long as an arena and the wireless ECG recording equipment (telemetry or Holter monitor) are available.
Therefore, this study includes a sample of 10 diverse cases of clinically apparent healthy horses and horses with cardiac disease, in which a standardized lungeing exercise test was performed as part of a protocol for cardiac examination. The protocol for standardized lungeing test consisted of 5 minutes walking, 10 minutes trotting, 4 minutes galloping, 1 minute fast galloping, and 5 minutes walking.
iv
Resumo
As lesões cardiovasculares são comuns em cavalos, mas estas lesões são muitas vezes pouco significativas, e bem toleradas. No entanto, algumas lesões cardiovasculares podem tornar-se clinicamente significativas, manifestando-se em diminuição da performance ou mesmo intolerância ao exercício, arritmias, fraqueza, infeção sistémica, insuficiência cardíaca congestiva ou morte súbita. (Bonagura & Reef, 2004)
As arritmias representam incerteza para os clínicos de equinos, especialmente quando diagnosticadas em animais em repouso. Devem ser distinguidas como sendo normais devido a variações no tónus vagal (arritmia 'fisiológica'), ou como sendo causadas por lesões cardíacas. Embora o exame em repouso seja fundamental para diagnosticar muitos problemas clínicos, os testes de exercício ajudam a avaliar problemas cardíacos dinâmicos. A prova de esforço pode ser realizada em passadeira elétrica ou no campo. Existem vantagens e desvantagens para ambos os tipos de prova de esforço. No entanto, ambos os protocolos podem ser difíceis de implementar, e sua disponibilidade pode ser limitada.
Este estudo tem como objetivo estudar um protocolo de eletrocardiograma de esforço durante o trabalho à guia padronizado e inserido num protocolo de exame cardíaco, para a avaliação das arritmias cardíacas. O trabalho à guia geralmente faz parte do treino da maioria dos cavalos, sendo que estes podem ser conduzido a passo, trote, e galope, e originar elevados níveis de esforço. A sua realização enquanto prova de esforço, não torna necessária a utilização de instrumentos sofisticados e pessoas especializadas, dando a possibilidade de ser implementado com menores limitações, sempre que um picadeiro e um equipamento de ECG sem fios (Holter ou telemetria) estejam disponíveis.
Este estudo inclui uma amostra de 10 casos clínicos diferentes, que incluem cavalos aparentemente clinicamente saudáveis e cavalos com doença cardíaca, aos quais foi realizado eletrocardiograma de esforço durante o trabalho à guia padronizado e inserido num protocolo de exame cardíaco. Este protocolo consistiu em 5 minutos de passo 10 minutos de trote, 4 minutos de galope, 1 minuto de galope rápido, e 5 minutos de passo.
v
Table of Content
Index of Tables ... vii
Index of Figures ... vii
List of abbreviations and symbols ... viii
Brief description of the traineeship ... ix
A. Literature Review ... 1
1. Introduction ... 1
2. Introduction to cardiac physiology ... 4
2.1 Electrical Properties of the Heart ... 4
2.2 The Cardiac Cycle ... 6
2.3 Systole ... 6
2.4 Diastole ... 7
2.5 Normal Heart Sounds ... 8
2.6 Electrophysiology and arrhythmogenesis ... 10
2.7 Recording electrical events in cells ... 10
2.8 Cellular physiology ... 10
2.8.1 The cardiac electrical field ... 12
2.8.2 Depolarization ... 12
2.8.3 Repolarization ... 13
2.8.4 Resting phase or diastolic depolarization ... 14
2.9 Innervation of the heart ... 15
2.10 The conduction process ... 16
2.11 The surface ECG ... 17
2.12 The concept of cardiac vector ... 18
2.13 ECG lead systems ... 19
3. Ambulatory and exercise ECG ... 21
vi
3.2 Exercise ECG recording ... 23
4. Identification and assessment of dysrhythmias ... 24
4.1 Classification of dysrhythmias ... 25
4.2 Bradydysrhythmias ... 26
4.3 Tachydysrhythmias ... 30
B. Case studies ... 40
1. Objectives ... 40
2. Material and Methods ... 40
2.1 Sample ... 40
2.2 ECG recording equipment ... 40
2.3 Standardized lungeing test protocol ... 40
3. Clinical Cases ... 40 3.1 Case I ... 40 3.2. Case II ... 42 3.3 Case III ... 44 3.4 Case IV ... 47 3.5 Case V ... 49 3.6 Case VI ... 51 3.7 Case VII... 53 3.8 Case VIII ... 55 3.9 Case IX ... 57 3.10 Case X ... 58 4. Discussion ... 61 4.1 Clinical Approach ... 62 4.2 Exercise testing ... 77 5. Conclusion ... 82 C. References ... 84
vii
Index of Tables
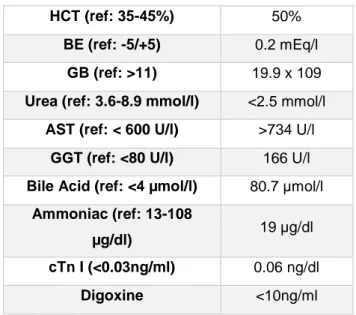
Tabela 1 - Arrhythmias, electrocardiogram findings, and observations in horses. (Adapted from: McGurrin, 2015) ... 39 Table 2 – Blood analysis of Case IV’s first appointment ... 47 Table 3 – Summary of the cases ... 60
Index of Figures
Fig 1 - Typical cardiac cycle diagram representing important electrical, mechanical and acoustical events occurring on the left side of the heart using a common time axis (Adapted from: Bright & Marr, 2010) ... 9 Fig 2 - Diagram representation of the cardiac conduction system and the relationship between the spread of conduction and the surface ECG (Adapted from: van Loon & Patterson, 2010) ... 17
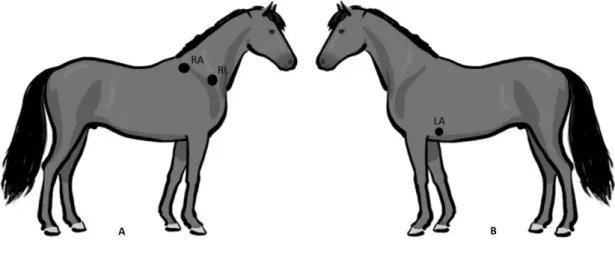
Fig 3 - Sites for lead placement for obtaining a base-apex electrocardiogram in the horse.
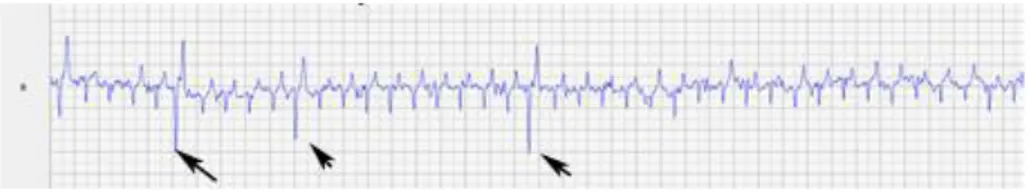
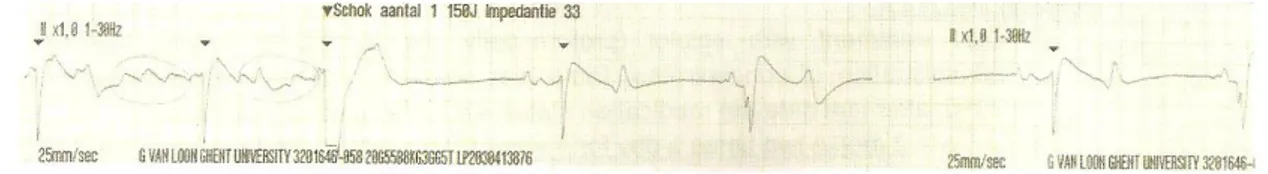
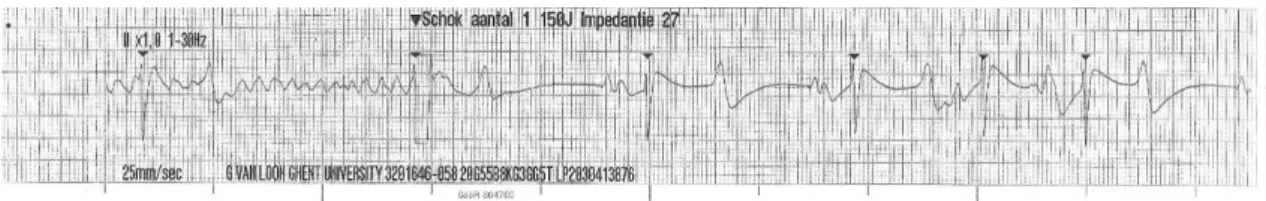
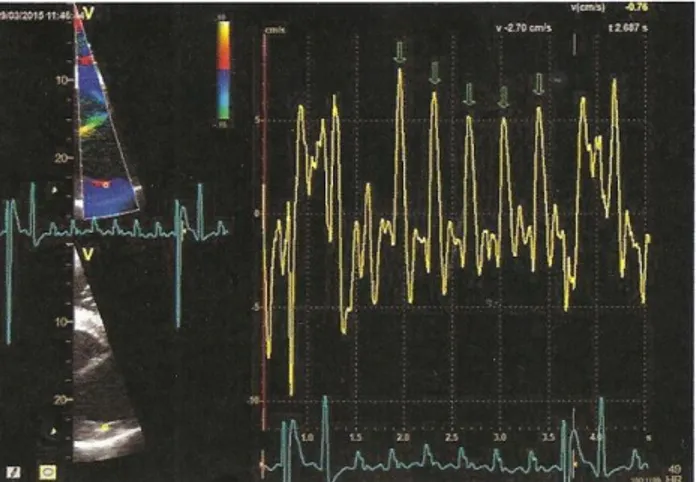
The black circles represent the sites of attachment for the electrodes. (A) Position of the electrodes on the right side of the horse for obtaining a base-apex ECG using the electrodes from lead I. RA: right arm; RL: right leg. (B) Position of the electrode placement on the left side of the horse for obtaining a base-apex ECG using the electrodes from lead I. LA: left arm. (Adapted from: van Loon & Patterson, 2010) ... 24 Fig 4 - Exercise ECG recording, the black arrows represent 3 of the ventricular premature depolarizations recorded ... 43 Fig 5 - Transvenous electrical cardioversion ECG recording of Case III: with the first shock sinus rhythm was successfully restored. ... 45 Fig 6 - Transvenous electrical cardioversion ECG recording of Case V: with the first shock sinus rhythm was successfully restored ... 50 Fig 7 - Myocardial contraction of the left atrium (4 chambers): maximum rate of contraction of the left atrium is shown by the arrows ... 54 Fig 8 - Transvenous electrical cardioversion electrocardiogram recording of Case VII: with the first shock sinus rhythm was successfully restored ... 55 Fig 9 - ECG recording at rest, the black arrows represent the Second AV blocks... 57
viii
List of abbreviations and symbols
ACVIM - American College of Veterinary Internal Medicine
AF – Atrial Fibrillation
APD - Atrial Premature Complexes ARP - Absolute Refractory Period AT – Atrial Trachycardia
aVF - Augmented vector foot aVL - Augmented vector left aVR - Augmented vector right AV block – Atrioventricular Block AV node – Atrioventricular Node AV valves – Atrioventricular Vales bpm – Beats per minute
Ca - Calcium
CHF - Congestive Heart Failure cTn I - Serum Cardiac Troponin I CV - Cardiovascular
ECEIM - European College of Equine Internal Medicine
ECG - Electrocardiogram HR – Heart Rate
iCa – Ionised Calcium
IRAF - Immediate Recurrence of Atrial Fibrillation
IU – International units K - Potassium
LA – Left Atrium LV – Left Ventricle
LVD – Left Ventricular Dysfunction Lone AF – Lone Atrial Fibrillation
MEA - Mean Electrical Axis mEq - Milliequivalents Mg - Magnesium
mmHg - Millimeter Of Mercury MR – Mitral Regurgitation Na - Sodium
PAF - Paroxysmal Atrial Fibrillation PaO2 - Arterial Oxygen Tension PHT - Pulmonary Hypertension
po – per os
RA – Right atrium
RBC – Red Blood Cell Count RV – Right Ventricle
RRP - Relatively Refractory Period SA - Sinoatrial
S1 – First heart sound S2 – Second heart sound S3 – Third heart sound S4 – Forth heart sound SCD - Sudden Cardiac Death
SNS – Sympathetic Nervous System SVPD - Supraventricular premature depolarizations
TVEC - Transvenous Electrical Cardioversion
VA – Ventricular Arrhythmias VF – ventricular Fibrillation VT – Ventricular Tachycardia
VO2max - Maximal Oxygen Consumption
ix
Brief description of the traineeship
My official curricular traineeship consisted of a 12 week Equine Programme at the Faculty of Veterinary Medicine of the University of Gent, completing a total of 511 hours distributed by the different departments of their Large Animal’s Veterinary Hospital: Internal Medicine, Diagnostic Imaging, Surgery, Pathology, Obstetrics, Hospitalisation, and Reception; under the supervision of Professor Ann Martens.
In the department of Internal Medicine, I spent 4 weeks performing the following activities:
Daily care of the hospitalised patients including administration of medication, discussions of the clinical cases etc.;
Help with the complementary exams of patients including abdominal, thoracic and cardiac ultrasound, endoscopy of the upper respiratory tract, rectal examination etc.;
Interpretation of blood analysis results;
During one week, I performed the evening, night and weekend duties, and helped with the examination and treatment of emergency cases (mainly colics).
For another 2 weeks I was in the department of Medical Imaging department, the activities were:
Provide help in taking the radiographs in and performing the ultrasonographic examinations;
Interpret radiographic and ultrasonographic images under guidance of assistants, residents, and professors.
In the department of Surgery, in the following week, the activities were:
Assist in the different soft tissue and orthopaedic procedures performed at the surgical department. Alternatively scrubbed-in with my colleagues with the surgeon, and provided help during the surgical procedures, or simply watched the surgeries, for which it was suggested to have done previous theoretical preparation;
Surgical procedures on ruminants were also performed during this week. One other week was spent in the department of Pathology:
x
Necropsies were performed by the students and trainees under the guidance of the assistants and professors.
In the department of Obstetrics, for the following week, the activities were: Semen collections in stallions;
Rectal ultrasound of mares for insemination/ pregnancy.
Two weeks were the spent with the patients, in the called ‘Hospitalisation’:
Care of the hospitalised patients from the surgical department included administration of medication, changing bandages, flushing wounds and sinuses; Feeding, handling and daily care of the horses (including clinical examination); One of these 2 weeks, I was involved in the care of the patients during the
evenings, nights and at the weekend. At the same time, I also assisted and scrubed-in to surgeries of emergency cases (mascrubed-inly wounds and colics).
‘Reception’ was the designation given to the department responsible for the examination of the orthopaedic patients. I spent 1 week in this department, and my activities were the following:
Involvement in writing the anamnesis of the lameness cases and performing the clinical examination. This included observation of the lameness, performing the hoof- and flexion tests, and assisting in the diagnostic anaesthesias;
Interpretation of radiographs and ultrasound from the orthopaedic patients, also performed under the guidance of the assistants and professors.
1
A. Literature Review
1. Introduction
The horse is an extraordinary athlete, due to the evolution of horses as grazing animals on the ancient prairies of North America. To survive in these open lands the horses needed to develop speed to escape predators, and endurance required to travel long distances in search of food and water (Hinchcliff, 2014).
Domesticated horses were selected and bred for certain particularities depending on the intended use. Nowadays there are many hundreds of breeds of horses, for example, large heavy breeds of horses were bred for draft work, such as pulling ploughs, sledges or carts, or military work, such as the chargers that carried heavily armoured knights during ancient battles (Hinchcliff, 2014).
Lighter horses were bred for speed and endurance, and were used for transportation, herding and sport. There are the Thoroughbred racehorses that can run at high speed (18 m/s, 64 km/h) over distances of 800 to 5000 meters, Standardbred horses trot or pace at high speed for distances up to 3600 m, and Arabians trot or canter at speeds of up to 29 km/h for up to 160 km in a single day during endurance events (and over longer distances during multi-day races). In contrast, draft horses pull huge weights (1000 kg or more) short distances in pulling competitions. Warmbloods perform elegant, and demanding, dressage routines, and ponies pull lightly laden jinkers or buggies (Hinchcliff, 2014). Horses are most commonly used as athletes, rather than for professional purposes or for pleasure riding (Durando, 2010), and a series of characteristics, both physiological and anatomical, act in concert to enhance the horse with extraordinary athletic capacity. Therefore, the athletic capacity of horses is due to many physiological adaptations, and in some cases these adaptations are not affected by training. An example of this, is the lung size. Whereas other adaptations change in response to training, for example, blood volume. The superior athletic ability of horses results from their high maximal aerobic capacity, large intramuscular stores of energy substrates and in particular glycogen, high mitochondrial volume in muscle, the ability to increase oxygen carrying capacity of blood at the onset of exercise through splenic contraction, efficiency of gait, and efficient thermoregulation (Hinchcliff, 2014).
2
The cardiovascular system is a transport system consisting of a muscular pump, the heart, and a network of blood vessels that contain blood. Its principal function is transport of water, oxygen, carbon dioxide, fuels for energy production, electrolytes, hormones, and metabolic products. The cardiovascular system of the horse is specifically designed for exceptional transport of oxygen from the lungs to body tissues. Horses have a high maximal oxygen consumption (VO2max) relative to body weight when compared with
most other mammals. The superior oxygen transport of the horse is attributed to its specialized spleen, which is able to add an extra volume of red blood cells (RBC) to the circulation when it contracts after the stimuli of fear, excitement or exercise. This infusion of erythrocytes increases the oxygen-transport capacity of arterial blood and enables horses to greatly increase VO2max during exercise. The stroke volume of blood pumped
with each cardiac contraction is over 1 liter (L) in trained horses, and maximal rates of blood flow during exercise are likely to be up to approximately 400 liters per minute (L/min) in the most exceptional athletes. The structure and function of the equine cardiovascular system are, therefore, fundamental to the superior athletic performance of the horse (Hodgson, 2014).
The size of the heart is the most important determinant of maximum stroke volume, cardiac output, hence aerobic capacity and exercise performance. This relationship has been documented in humans by examination of the electrocardiogram (ECG), ultrasound, radiographs, and post-mortem examination of heart size. As noted by Poole & Erickson (2014), Paavo Nurmi, multiple Olympic champion distance runner, had a heart mass nearly three times larger than the size presumed for his body size. At post-mortem, the heart of the seven-time Boston Marathon winner, Clarence DeMar, who died of a non-myocardial cancer, was substantially larger than normal, and his coronary arteries were threefold larger than found in non-athletic equals. In horses, heart mass approximates 0.9–1% of body mass, which is greater than the other non-athletic species, and may exceed 1.1% of body mass in trained horses, possibly reaching ~2% in elite horses. The heaviest horse heart actually weighed was Sham’s heart, who was consistently runner-up to Secretariat, and it weighed 18 lb (8.2 kg). Secretariat was a Triple Crown winner and holds the track record at Belmont Park (2 min 24.4 s for 1.5 miles on turf). Secretariat’s heart was never weighed, but Dr. Thomas Swerczek who weighed Sham’s heart, calculated that Secretariat’s heart weighed 22 lb (10 kg), considering it to be in perfect condition. If that mass is correct, it predicts that Secretariat may have achieved a
3
cardiac output in excess of 500 L/min and VO2max over 120 L/min (Poole & Erickson,
2014).
Cardiovascular lesions are common in horses. Although these lesion are often minor, and well tolerated by the horses, some cardiovascular lesion can become clinically significant, manifesting as exercise intolerance, arrhythmia, weakness, systemic infection, congestive heart failure, or sudden death. The effect of the cardiovascular lesion on a performance horse that depends so much on circulatory function, can be difficult to quantify without a thorough examination (Bonagura & Reef, 2004).
In essence, any condition that reduces a horse's cardiac output will reduce performance. Causes of poor performance related to the heart include arrhythmias, systolic or diastolic dysfunction, valvular regurgitation, and intracardiac shunts. Severe regurgitation, large shunts, or sustained arrhythmias such as atrial fibrillation or ventricular tachycardia have an obvious impact on performance (Durando, 2003).
In the context of examinations for purchase, or in horses being investigated for poor performance, a murmur in an otherwise apparently healthy horse, may have uncertain significance (Marr, 2010). If echocardiography is a tool available to the clinician, the source of the murmur can be easy to identify. The difficulties arise when the clinician needs to know if the source is pathological, or perhaps the horse can be considered clinically healthy, advising or guiding the owner, rider or buyer. It is important to understand if, for example a valvular regurgitation, can lead to a cardiac arrhythmia during exercise and be potentially fatal (Buhl, 2010).
In general terms, arrhythmias can develop as a result of damage to: a few localized cells which act as a focus of abnormal depolarization; specialized cells within the conduction pathway; and also a damage to most myocytes. Whatever the form of damage (cell death, fibrosis, ischaemia, hypoxia), there may be changes in the membrane properties which determine the electrophysiology of the cells.The significance of these effects depends on which cells are affected, and any drugs or electrolyte abnormalities that might be present at the same time. In addition, the autonomic nervous system may have an effect on normal and abnormal rhythms (van Loon & Patterson, 2010).
Although, arrhythmias are for the most part benign in nature (McGurrin, 2011), they represent doubt to the equine practitioner especially when detected in resting animals. In horses, some arrhythmias are normal because of the high vagal (parasympathetic) tone. Therefore, the arrhythmias must also be distinguished as being due to normal variation in
4
autonomic tone (“physiological” arrhythmias), or as arrhythmias which occur because of valvular, myocardial or systemic disease. (Verheyen et al., 2010).
2. Introduction to cardiac physiology
2.1 Electrical Properties of the Heart
Orderly electrical activation of the heart is accomplished by the sequential propagation of action potentials along the anatomically defined structures. Within the sinoatrial (SA) node, the atrioventricular (AV) node and the specialized conduction fibres of the His Purkinje system, a spontaneous action potential without the need of an external stimulus (automaticity) can be generated, due to an inherent property of the myocytes. The cells of the SA node normally have the fastest rate of spontaneous action potential generation, consequently, the SA node is the site of impulse formation in the normal heart (Rastagi, 2007; Bright & Marr, 2010; Gilmour, 2015).
From the SA node, the impulse spreads over the atria to the AV node producing electrical potentials that inscribe a P wave on the surface electrocardiogram (ECG). The P wave reflects atrial depolarization and precedes the QRS complex (Miller et al., 1999). P waves are typically positive in a base-apex ECG recording, since spread of the cardiac impulse through the atria is in an overall direction that is dorsal to ventral (Bright & Marr, 2010). The P–R interval, measured from the beginning of the P wave to the beginning of the QRS complex, represents the time required for the wave of excitation to travel from the SA node to the ramifications of the His–Purkinje system (Bright & Marr, 2010; Gilmour & Moïse, 2015).
Because it is greatly innervated by the parasympathic and sympathetic nervous systems that provide stimuli to alter the heart rate, the degree of AV conduction delay is influenced by the autonomic tone, as the vagal tone reduces and sympathetic tone increases the rate of conduction. Therefore, in horses with dysrhythmias, such as atrial fibrillation, autonomic tone is an important determinant of heart rate. After relatively slow conduction through the AV node, the cardiac impulse is rapidly conducted over the bundle of His and Purkinje system to the terminal Purkinje fibres and the working ventricular myocytes (Bright & Marr, 2010).
5
The His–Purkinje system penetrates more deeply in horses, ruminants, swine and birds (Gilmour & Moïse, 2015), and is widely distributed throughout the right and left ventricular myocardium, penetrating the entire thickness of the ventricular walls (Bright & Marr, 2010). The vast distribution of the Purkinje system is physiologically important because the conduction velocity within the ventricular myocytes is approximately 6 times slower than conduction velocity of the Purkinje cells. Thus, the time duration and sequence of ventricular activation and, ultimately, the surface ECG is affected (Bright & Marr, 2010).
The earliest phase of ventricular activation in horses consists of depolarization of a small apical region of the interventricular septum. This early depolarization is often in an overall left to right and ventral direction. The electrical potentials generated from this early phase of ventricular activation may produce the initial portion of the QRS complex (Q wave) on the surface of the ECG (Bright & Marr, 2010; Stephenson, 2013). However, there is significant variation in the direction of the early phase of ventricular activation, and in some horses the vectors of local electrical activity effectively cancel each other, thereby eliminating any deflection on the surface ECG. Thus the duration of QRS complexes in normal horses may vary from 0.08 to 1.4 seconds (≤0,14, foal: 0,05 - 0,08) (Bright & Marr, 2010).
Immediately after early ventricular activation, the major masses of both ventricles and the middle portion of the septum are depolarized (Bright & Marr, 2010), and the extremely fast conduction of the cardiac action potential, from cell-to-cell, through the latter portion of the AV bundle, the bundle branches, and the Purkinje system, results in a nearly synchronous contraction of all the fibres in both ventricles (Stephenson, 2013). Since this depolarization occurs without a spread of the impulse in any specific direction, it’s contribution isn’t considered in the genesis of the QRS complex on the ECG (Bright & Marr, 2010).
The final phase of equine ventricular activation consists of depolarization of the basilar third of the septum, which occurs in an apical to basilar direction. This final phase of activation is responsible for the generation of most of the QRS complex and normally produces a negative deflection in a base-apex recording (Bright & Marr, 2010). The duration of the QRS complex represents the spread of impulses throughout ventricular muscle, and is a measure of the intraventricular conduction time (Gilmour & Moïse, 2015).
6
2.2 The Cardiac Cycle
An understanding of the cardiac cycle is essential to understand the healthy heart, and for an acknowledgment of how various diseases disturb its normal function (Bright & Marr, 2010). The cardiac cycle describes and relates temporally the mechanical, electrical and acoustical events that occurs in the heart and great vessels. It is the sequence of events occurring in the heart during every contraction (systole) and relaxation (diastole) (Bright & Marr, 2010; Hodgson, 2014; Riedesel, 2015).
Systole consists of the isovolumic contraction phase and ventricular ejection. Diastole consists of the isovolumic relaxation phase, the rapid filling phase, diastasis and atrial contraction. It is helpful to recall that mechanical events are stimulated by electrical depolarization, and, thus, the mechanical events occur slightly after the electrical events on the cardiac cycle diagram (Bright & Marr, 2010; Stephenson, 2013). The right and left ventricular cycles are almost identical except for the peak pressures. The right ventricle usually only achieves peak systolic pressures of 20–40 mmHg, while the left ventricle develops pressures of 100–160 mmHg in the resting animal (Riedesel, 2015).
The cyclic nature of cardiac activity depends on normal conduction of electrical impulses from the sinoatrial (SA) node, through the atrial and ventricular myocardium. The diffuse distribution of Purkinje fibres through the left ventricular wall, enables rapid depolarization and development of muscular tension. Right ventricular contraction slightly precedes left ventricular contraction (Hodgson, 2014).
2.3 Systole
Ventricular contraction (ventricular systole) is initiated by ventricular depolarization, which is indicated by the QRS complex, and mechanical systole begins slightly later with the contraction and closure of the AV valves (Bright & Marr, 2010; Stephenson, 2013). Blood is not immediately ejected from the left ventricle into the aorta at the beginning of systole, because the aortic valve remains closed until the left ventricular pressure exceeds the aortic pressure. Therefore, ventricular volume remains the same during this first phase of systole, which is therefore named isovolumetric contraction (Stephenson, 2013). During the isovolumic contraction phase of systole, the intraventricular pressure increases rapidly, and when pressure in the left ventricle exceeds pressure in the aorta, the aortic
7
valve opens and the blood begins to flow into the aorta. The opening of the aortic valve marks the end of isovolumic contraction and the beginning of ejection. The interval between the onset of the QRS complex and the onset of ejection is the pre-ejection period. The pre-ejection period includes both electromechanical delay and isovolumic contraction. During most of the ejection phase of systole, the left ventricular pressure is above the aortic pressure (Hamlin, 1999; Bright & Marr, 2010; Stephenson, 2013). Left ventricular pressure begins to decrease during systole, and at the end of ejection, aortic pressure exceeds ventricular pressure briefly. Aortic blood flow velocity reaches a peak during the first third of ejection and then decreases. A short backflow of blood from the aorta into the left ventricle closes the aortic valve. The closure of the aortic valve marks the end of ventricular systole, and the beginning of ventricular diastole. The interval between opening and closure of the aortic valve is the left ventricular ejection time. Toward the end of systole the ventricular muscle repolarizes producing the T wave on the ECG (Hamlin, 1999; Bright & Marr, 2010; Stephenson, 2013).
2.4 Diastole
The ventricular diastole begins with the aortic valve closure. The left ventricular pressure, which has been declining due to relaxation of the myocytes, and continues to decline rapidly during early diastole, but ventricular volume remains constant due to the cardiac valves being closed (Bright & Marr, 2010). Therefore, this initial phase of diastole is
isovolumic relaxation, and the rate of intraventricular pressure decline during this phase
of the cardiac cycle, is determined by the rate of active relaxation of the myofibers (Bright & Marr, 2010; Stephenson, 2013; Riedesel, 2015). When left ventricular pressure drops below left atrial pressure, the mitral valve leaflets open and ventricular filling begins (Bright & Marr, 2010).
Opening of the mitral valve marks the onset of the rapid filling phase of diastole, which filling occurs passively due to a difference in pressure between the ventricle and atrium that results largely from myocyte relaxation. The velocity of left ventricular inflow, and the volume of blood transferred from the atrium to the ventricle during this phase, are largely determined by the increasing pressure gradient created by the continuous decline in tension in the ventricular myocytes at this time (Bright & Marr, 2010).
As left ventricular pressure decline slows and ventricular fillings progresses, the atrioventricular pressure difference approaches zero, and ventricular volume reaches a
8
plateau (Bright & Marr, 2010). This phase of diastole is known as diastasis, and minimal changes in intraventricular pressure and volume are occurring at this time. The duration of diastasis varies inversely with the heart rate, and at resting heart rates in horses the diastasis is the longest phase of diastole. Atrial systole is the final phase of ventricular diastole. This phase begins slightly after P wave of the ECG. Atrial contraction recreates an atrioventricular pressure gradient that increases ventricular filling (Bright & Marr, 2010; Stephenson, 2013).
In healthy resting horses, atrial systole has minimal effects on ventricular filling and cardiac performance. However, absence of atrial contraction or loss of atrioventricular synchrony during exercise, has a considerable adverse effect on ventricular filling and cardiac output (Bright & Marr, 2010).
2.5 Normal Heart Sounds
During the cardiac cycle four heart sounds are generated as a result of rapid acceleration or deceleration of blood (Bright & Marr, 2010). In healthy horse two to four sounds can be heard. The recognition and understanding of these sounds provides information regarding timing of murmurs, and presence or absence of atrial contraction (Bright & Marr, 2010; McGurrin, 2011).
Normally the first (S1) and second (S2) heart sounds are the loudest and are audible in all healthy animals. S1 is audible at the onset of mechanical systole and occurs in association with closure of the atrioventricular valves (Bright & Marr, 2010; Stephenson, 2013). In healthy horses S1 is the loudest in duration, and is louder in young, thin animals and in those with high sympathetic tone, tachycardia, systemic hypertension, or anaemia (Sisson & Ettinger, 1999). S2 is heard at the end of systole with the closure of the semilunar valves, and is a shorter, higher pitched sound. The third heart sound (S3) follows S2, and if audible, is associated with early ventricular filling (the rapid filling phase of diastole). The fourth heart sound (S4), if audible, is heard immediately prior to S1, and is associated with atrial contraction (late filling) (Bright & Marr, 2010; McGurrin, 2011; Stephenson, 2013; Riedesel, 2015).
Typically, the normal heart sounds occur nearly simultaneously on the left and right sides of the heart. However, there are some conditions that may cause enough asynchrony so that the first or second heart sounds are split into two components. An audible splitting of S1 is unusual in horses and generally not significant unless the split is mistaken for an
9
audible S4 in horses with atrial fibrillation. S2 is frequently split in horses, and inspiration usually increases the degree of splitting in normal animals (Bright & Marr, 2010). A murmur is a series of auditory vibrations occurring during a normally silent period of the cardiac cycle. The clinician should describe the timing, duration, quality or pitch, grade, point of maximal murmur intensity, and radiation of a murmur, as well as the effect of changing heart rate on the sounds (Bonagura & Reef, 2004; McGurrin, 2011; Blissitt, 2014).
One determines the timing relative to the heart sounds and categorizes murmurs as systolic, diastolic, or continuous. Skilled auscultators subdivide the timing of murmurs, because the timing and duration of the murmur often correlate with specific flow disturbances (Bonagura & Reef, 2004).
In general, the clinically significant murmurs are loud and long-lasting. However, the intensity of the murmur is related not only to the volume of regurgitant blood, but also to the driving pressure and the conformation of the horse. Hence grading of severity by auscultation alone is often not sufficient. Further classification of severity and determination of the exact diagnosis and prognosis require additional diagnostic tests (Buhl, 2015).
The most commonly detected murmurs associated with structural heart disease are those generated by TR, MR, aortic regurgitation, and VSD (Bonagura & Reef, 2004).
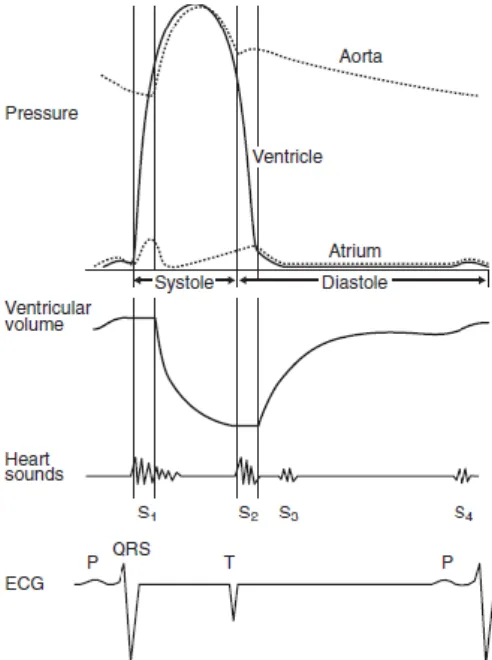
Fig 1 - Typical cardiac cycle diagram representing important electrical, mechanical and acoustical events occurring on the left side of the heart using a common time axis (Adapted from: Bright & Marr, 2010)
10
2.6 Electrophysiology and arrhythmogenesis
The normal electrical excitation, through the specialized conduction pathway that is part of the heart, is fundamental for the coordination of the myocardial contraction and relaxation. Many systemic homeostatic mechanisms have the capacity to alter heart rate in order to maintain an appropriate cardiac output, and may also affect the cardiac rhythm (van Loon & Patterson, 2010).
Recording the depolarization and repolarization of the excitable cells of the heart, is essential for understanding its electrophysiological properties. Even though the understanding of arrhythmogenesis is far from complete, the knowledge of the electrophysiology of cardiac cells is fundamental to an appreciation of the factors which lead to abnormal cardiac rhythm (van Loon & Patterson, 2010).
2.7 Recording electrical events in cells
The depolarization process can be detected at different levels by intracellular electrodes, intracardiac electrodes, and by electrodes placed on the body surface (van Loon & Patterson, 2010).
The surface electrocardiogram (ECG) records the potential difference between selected points on the body surface. It allows to detect changes in the electrical field around the heart during depolarization and repolarization (van Loon & Patterson, 2010). The physics of how the heart produces voltages that are detectable at the body surface is extremely complex. However, it is possible to develop an intuitive model adequate for clinical applications (Stephenson, 2013).
2.8 Cellular physiology
All myocytes possess the properties of excitability, refractoriness and conductivity. Like nervous tissue, individual cardiac cells exhibit the all-or-none phenomenon – that is once threshold is reached they are completely activated by an action potential. The cells can therefore be described as excitable. Once the action potential is initiated, cells cannot be depolarized again until they have returned to the resting potential following repolarization. This property of refractoriness ensures that all cardiac cells have a period after activation during which no level of further stimulus will cause an action potential. This prevents heart muscle from developing a tetanic spasm (van Loon & Patterson,
11
2010). Properties of automaticity, excitability, conductivity, and refractoriness are important in arrhythmia genesis and therapy (Miller et al., 1999).
Atrial and ventricular myocytes form two syncytia within which excitation passes from cell-to-cell through intercalated discs, conducting the stimulus for depolarization to their neighbours. Other tissues within the heart have specialized conductivity properties so that they conduct the impulse along a network either slowly (atrioventricular node) or rapidly (e.g. Purkinje fibres). While the atrial and ventricular myocytes have contractile function, the cells of the specialized conducting network have no contractile protein (Miller et al., 1999). Other cardiac tissues, including cells in the atria, mitral and tricuspid valves, distal atrioventricular (AV) node and AV junctional tissues, and the His-Purkinje system, are capable of automaticity. Normally, these latent pacemaker cells reach threshold later than do the SA node cells, and thus are discharged before they automatically depolarize. (Miller et al., 1999; van Loon & Patterson, 2010).
The electrophysiological features of myocytes result from specific properties of the cardiac cell membrane. Like all living cells, the inside of cardiac cells have a negative electrical charge compared to the outside, due to an accumulation of negatively charged ions. This voltage difference across the cell membrane is called the transmembrane potential, which is about 80 to 90 mV. All cells have a very high intracellular concentration of potassium and low levels of sodium and calcium, and for most cells this situation remains unaltered. However, excitable cells like cardiac cells have tiny pores or channels in the cell membrane. Upon appropriate stimulation, these channels open and close in a predefined way to allow specific ions to move across the cell membrane. This movement of ions results in changes in the transmembrane potential, from 90 mV to about +20 mV (depolarization), and finally back to 90 mV (repolarization) (van Loon & Patterson, 2010).
A graphical representation of these changes in transmembrane potential is known as the action potential (a cardiac action potential is created when the cell is depolarized to the threshold voltage for opening the voltage-gated Na+ channels). The currents, and the morphology of the action potential, vary in different tissues and determine the different properties of each specialized cell. Also, changes in extracellular ion concentrations, diseases and drugs may influence the action potential of the cells (van Loon & Patterson, 2010; Stephenson, 2013).
12
The action potential can be divided into five phases (0–4), but it is practical to consider the action potential in terms of three general phases: depolarization, repolarization and resting phase (van Loon & Patterson, 2010).
2.8.1 The cardiac electrical field
During the depolarization and repolarization processes, different currents are flowing across the cell membrane at various points, and a potential difference will be present between one part of the cell and another. When the current is flowing, an external electrical field is set up around the cell, which can be described as acting as a dipole (van Loon & Patterson, 2010).
However, when the cell is depolarized, or repolarized at a resting potential, no electrical field is formed around the cell because no current is flowing, despite the potential difference between the inside and outside of the cell. Each myocyte forms its own electrical field, but the electrical effects summate to produce an electrical field around the whole heart which (van Loon & Patterson, 2010), in simplified terms, can then be regarded as a single dipole, which is a pair of electrical charges (a positive charge and a negative charge) separated by a distance (van Loon & Patterson, 2010; Stephenson, 2013).
2.8.2 Depolarization
The Phase 0 represents the depolarization process, and onsets once a cell has reached a certain potential (the threshold potential), spontaneously in the case of pacemaker cells or as a result of depolarization of adjacent cells in the case of conduction pathway and myocardial cells. The upstroke of the cardiac action potential in atrial and ventricular muscle and His-Purkinje fibres is the result of a sudden increase in membrane conductance to Na+, resulting in rapid movement of extracellular-to-intracellular sodium ions through fast sodium channels (voltage-gated Na+ channels). The rate at which the depolarization occurs (slope of phase 0) is a determinant of the conduction velocity for the propagated action potential (Miller et al., 1999; van Loon & Patterson, 2010; Stephenson, 2013).
In the conducting pacemaker tissues of the sinoatrial (SA) and AV nodes, the resting potential of the cell membrane is less negative (around –60 mV) than in non-pacemaker cells. This results in a decreased rate of phase 0 depolarization and relatively slow
13
conduction in pacemaker tissues. In these cells, the contribution of the fast inward current usually carried by sodium is small, and the relatively slow depolarization process is largely due to movement of calcium ions (van Loon & Patterson, 2010; Stephenson, 2013). As a result, these tissues are relatively sensitive to changes in calcium concentration (van Loon & Patterson, 2010).
2.8.3 Repolarization
Once a cell is depolarized, it cannot be depolarized again until the cell has first recovered, by restoring the initial ion gradients and thus by regaining its polarized state. This recovery process is called the repolarization process and corresponds to phases 1–3 of the action potential (van Loon & Patterson, 2010).
Because during these phases the cell cannot be excited again, this period is called the refractory period and corresponds to the width of the action potential. Consequently, cardiac myocytes do not undergo contraction (i.e. tonic contraction) (van Loon & Patterson, 2010). The repolarization phase starts with the early rapid repolarization phase (phase 1) which shows as a relatively small but sharp drop in potential towards 0 mV, partly owing to inactivation of sodium current or activation of an outward potassium current (van Loon & Patterson, 2010; Stephenson, 2013).
This phase is immediately followed by the plateau phase (phase 2) which may last several hundred of milliseconds, about 200 msec. During this period, membrane conductance to all ions falls to rather low values, with a complex interaction of ion movements involving sodium, potassium, magnesium and chloride, and an inward L-type calcium current (slow Ca2+ channels). These channels, especially the latter, interrupt the repolarization process and prolong the action potential (van Loon & Patterson, 2010; Stephenson, 2013). Therefore, the cardiac muscle cells become partially relaxed before the earliest possible subsequent contraction can begin. This means, that each cardiac action potential produces a contraction that is distinctly separated from the preceding contraction. Because of its long refractory period, cardiac muscle cannot sustain a continuous contraction. Therefore, the heart has a guaranteed period of relaxation (and refilling) between heartbeats (Stephenson, 2013). As such, the action potential duration, and therefore the refractory period, is predominantly determined by the balance between the inward and outward currents during the plateau phase, which have a very important role in the generation of some arrhythmias (van Loon & Patterson, 2010).
14
After the plateau phase, the final rapid repolarization (phase 3) takes place due to a series of potassium currents. In order to maintain the concentration gradients, sodium is pumped out of the cell in exchange for potassium, resulting in a return to its stable, negative resting potential (phase 4) (van Loon & Patterson, 2010; Stephenson, 2013).
During this final recovery process, the cardiac myocyte gradually regains excitability. This means that the cell is not excitable during phase 1, phase 2 and the beginning of phase 3, regardless of the magnitude of the stimulating impulse (van Loon & Patterson, 2010). This period is called the absolute refractory period (ARP). As the cell repolarizes, it becomes excitable. However, there is a period of time during which the cell can only be excited by a large current (the amplitude of such an action potential is lower than normal because only a fraction of the Na+ channels have returned to the resting state and are available for activation). This period is known as the relatively refractory period (RRP) (van Loon & Patterson, 2010; Gilmour, 2015).
2.8.4 Resting phase or diastolic depolarization
Normally, membrane potential of atrial and ventricular muscle cells remains steady at around -90 mV (-80 mV, according to Stephenson (2013)) throughout diastole (phase 4). Although, in certain specialized conducting cells, or due to leakage of ions across the cell membrane, the resting membrane potential does not remain constant in diastole but gradually depolarizes. This spontaneous depolarization is called a pacemaker potential, and may reach threshold potential (around -60 mV) by itself and produce an action potential (automaticity) (van Loon & Patterson, 2010; Stephenson, 2013).
The rate of this change in potential is mainly determined by a time-related change in membrane potassium or sodium permeability. It is influenced by autonomic tone, electrolytes, drugs and diseases. The steeper the slope of phase 4, the faster the rate of automaticity. Phase 4 is more abrupt in SA nodal cells. However, the AV node and the junctional tissue also have automaticity, as mentioned before, and will take over as pacemaker if the SA node fails to depolarize. In some disease states, Purkinje tissue may also act as a pacemaker, and abnormal automaticity may occur in other cells (Miller et al., 1999; van Loon & Patterson, 2010).
As mentioned before, compared to the action potential of a ventricular or Purkinje fibre cells, the sinoatrial and atrioventricular nodal cells have a slow depolarization phase (phase 0). This slower depolarization phase occurs because of a lack of rapid sodium
15
channels responsible for the rapid depolarization phase. The sinoatrial and atrioventricular nodes are mainly dependent on the slow calcium channel for depolarization. Because of the slower rate of depolarization, the sinoatrial and atrioventricular nodes conduct electrical pulses slowly. For the atrioventricular node this slow conduction is reflected on the surface ECG as the PR interval (van Loon & Patterson, 2010; Stephenson, 2013).
2.9 Innervation of the heart
The cardiovascular system is under the control of both neuronal and humoral components of the autonomic nervous system, acting both on the heart and on the peripheral vasculature. Cardiovascular physiologic responses to pharmacologic and physiologic disturbs are related to selective distribution of autonomic fibres. These actions are associated with parasympathetic and sympathetic nerves (Miller et al., 1999; van Loon & Patterson, 2010).
Acetylcholine activates muscarinic cholinergic receptors on the cell membranes of pacemaker cells, which slows the ion channel changes that are responsible for the pacemaker cell’s spontaneous depolarization. Because the pacemaker cells take longer to reach threshold in the presence of acetylcholine, there is a longer interval between heartbeats. Therefore, heart rate is decreased below its spontaneous level. Therefore, parasympathetic neurons release acetylcholine at the SA node cells, and thus parasympathetic activity decreases the heart rate (Stephenson, 2013).
Sympathetic neurons release norepinephrine at the SA node cells, and thus sympathetic nerve activity increases the heart rate. Epinephrine (or norepinephrine), which is released from the adrenal glands and circulates in the bloodstream, has the same effect. This results in an increased automaticity, an increased conduction velocity, and a shortened refractory period. Therefore, cells recover quicker, allowing a higher rate of stimulation, and resulting in increased myocardial contractility (van Loon & Patterson, 2010; Stephenson, 2013).
The subcellular effect of these hormones is largely due to effects on contractile proteins; however, they also affect transmembrane potentials, and alter cardiac rhythm in some circumstances (van Loon & Patterson, 2010).
16
2.10 The conduction process
The conduction process follows a pathway in the normal heart, leading to a coordinated contraction of atrial and then ventricular muscle. An impulse spreads from the SA node, across the atria, to the AV node. The electrical activity associated with depolarization of this muscle mass results in a sufficiently large electrical field for it to be detected on a body surface ECG as a P wave (van Loon & Patterson, 2010; Stephenson, 2013; Gilmour, 2015).
The precise location of impulse formation within the SA node and the pattern of depolarization across the atria, can be influenced by heart rate and autonomic tone, which can result in a different configuration of P waves (wandering pacemaker, normal finding in horses [McGurrin, 2011]) even though the SA node remains the source of the impulse (van Loon & Patterson, 2010).
When the impulse reaches the AV junction it finds a barrier to further spread. The specialized cells of the AV node conduct the impulse slowly. Because only a small number of cells are depolarized, no deflection is seen on the surface ECG. This period is represented by the P–R interval (van Loon & Patterson, 2010). Conduction through the AV node is profoundly affected by vagal tone in the horse (Bright & Marr, 2010; van Loon & Patterson, 2010). Even in normal animals, conduction is often sufficiently slowed or reduced in amplitude to result in a marked reduction in the normal rate of conduction (first degree AV block), or complete abolition of further spread of the impulse (second degree AV block) (van Loon & Patterson, 2010).
An important feature of the AV node is its long refractory period, which helps protect the ventricles from being stimulated to contract at rates that are too rapid for efficient pumping. This protective function of the AV node is critical to an animal’s survival when atrial action potentials are extremely frequent (atrial flutter/ fibrillation) (Stephenson, 2013).
When the impulse passes through the AV node it is rapidly conducted through the bundle of His and the Purkinje network to the ventricular myocardium. Depolarization of the ventricles is rapid and results in a coordinated contraction. Depolarization of the Purkinje network is not detected on the body surface ECG; however, depolarization of the myocardium results in substantial electrical forces, the net result of which produces the QRS complex on the surface ECG (van Loon & Patterson, 2010).
17
Each cell within the heart repolarizes after depolarization. The sum of the repolarization processes within the heart can be detected at the body surface in the same way as the depolarization (van Loon & Patterson, 2010). Ventricular repolarization is seen as the T wave (van Loon & Patterson, 2010; Stephenson, 2013; Gilmour, 2015). The change in electrical field caused by atrial repolarization may or may not be seen (atrial T wave or Ta wave) (van Loon & Patterson, 2010).
Identification of the characteristic waveforms allows a clinician to detect when depolarization and repolarization of the atria and ventricles has occurred. The timing of the waves, the relation between the different waves, and the morphology and duration of the complexes and intervals allows for the deduction of the origin and of the conduction pathway of the impulse (van Loon & Patterson, 2010; Stephenson, 2013).
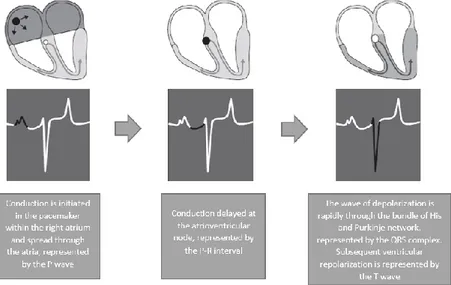
Fig 2 - Diagram representation of the cardiac conduction system and the relationship between the spread of conduction and the surface ECG (Adapted from: van Loon & Patterson, 2010)
2.11 The surface ECG
The changes in the electrical field around the heart can be detected by a galvanometer attached to the body surface, which records the potential difference between two electrodes. The link between a positive and negative electrode is called a bipolar lead. An ECG records the potential difference between electrodes placed at various points on the body surface, which reflects the sum of all the electrical fields which are present at any one time (van Loon & Patterson, 2010).
18
The ECG is a moving record of the deflections generated by the electrocardiograph stylus calibrated in voltage (vertical axis) and time (horizontal axis). Electrocardiographic electrodes (leads) sample cardiac potentials at the body surface. These are measured by the electrocardiograph (galvanometer) and recorded (Miller et al., 1999).
The points at which the ECG electrodes are placed are chosen to represent electrical changes in the heart; however, a number of other factors also affect the potential difference between different areas of the body. The position of the heart within the body, the course of the spread of activation within the heart, the shape of the thorax, the conductivity of tissues between the heart and the electrodes, and the exact location of the body surface electrodes all affect the body surface ECG (van Loon & Patterson, 2010).
2.12 The concept of cardiac vector
The surface ECG reflects the combined effects of all the electrical activity of the heart. The sum of the electromotive forces has a direction and magnitude, which is termed the cardiac vector (van Loon & Patterson, 2010; Gilmour, 2015).
The ECG samples these vectors as they project onto a two‐dimensional surface, represented in the frontal plane by Einthoven’s triangle. Any given ECG lead, by recording the difference in potential between two sites on the torso, captures the magnitude of a given vector, but not its direction. Consequently, the measurements provided by ECG leads are scalar quantities, rather than vector. However, the cardiac vector, represented by the mean electrical axis, can be reconstructed using recordings from at least three ECG leads (Gilmour, 2015).
The ECG voltmeter will have a positive deflection if the net direction of overall activity (vector) if it points towards the positive electrode of a bipolar lead, and a negative potential if it is away from it. The voltage recorded will be largest when the vector is directly towards the positive electrode. If the direction of the maximum potential difference is at an angle to the lead axis, the deflection will be smaller. If the electrodes are positioned perpendicular to the vector of electromotive force, no potential difference will be detected. The amplitude of the deflection indicates the magnitude of the vector and is proportional to the mass of myocardial tissue which is depolarized (van Loon & Patterson, 2010).
19
2.13 ECG lead systems
The aim of the lead systems is to clearly record each of the waveforms and complexes so that the conduction process can be evaluated, and also to gain some information about the direction and magnitude of the cardiac vector (van Loon & Patterson, 2010).
Einthoven’s triangle is a lead system that looks at the combined electrical activity which reaches the body surface in the frontal plane, in which the heart is assumed to sit in the centre of a triangle formed by the two forelimbs and the left hindlimb (van Loon & Patterson, 2010; Stephenson, 2013). This system, which is commonly used in small animals and humans, can also be used in horses, and provides useful information about cardiac rhythm and conduction (van Loon & Patterson, 2010).
Other systems have also been designed to accommodate the fact that, in horses, the heart does not sit in the centre of a triangle formed by the limbs. These systems assess the cardiac vector in three dimensions, by measuring the electrical field in three semi-orthogonal planes (van Loon & Patterson, 2010).
Standard bipolar leads are recorded this way: lead I is between the left arm electrode () and the right arm electrode (+); lead II is between the right arm electrode ( and the left foot electrode (+) and lead III is between the left arm electrode () and the left foot electrode (+)van Loon & Patterson, 2010). For the augmented unipolar leads, the positive exploring electrode (right arm for aVR; left arm for aVL and left leg for aVF) is compared with the remaining two electrodes () (van Loon & Patterson, 2010; Stephenson, 2013). The apex lead is most frequently used for recording rhythm strips. To record a base-apex lead the left arm electrode (+) is positioned at the cardiac base-apex, and the right arm electrode (-) is placed two thirds of the way down the right jugular groove or at the top of the right scapular spine. The third electrode is placed at any site remote from the heart (Durando, 2003; van Loon & Patterson, 2010; McGurrin, 2011). Lead 1 is selected to record the ECG. For the Y lead the right arm electrode () is attached over the manubrium sterni and the left arm electrode (+) over the xiphoid process of the sternum. The third electrode is placed at any site remote from the heart (van Loon & Patterson, 2010; McGurrin, 2011). Alternatively, the positive electrode can be positioned at the right side of the withers, and the negative electrode at the ventral middle (McGurrin, 2011). Lead I is selected to record the ECG. Consistency in lead placement facilitates interpretation
20
(McGurrin, 2015). Durations of the ECG components in normal horses can then be consulted.
The ventricular depolarization process is different in horses compared with human beings and small animals. In human beings and small animals, the Purkinje network carries the impulse to the subendocardial myocardium, and depolarization then spreads out from the ends of the fibres, through the myocardium, to the subepicardial layers in a series of wavefronts (van Loon & Patterson, 2010). In human beings and small animals, the duration of the QRS complex may be prolonged when the left ventricle is enlarged, because the wavefront takes longer to spread throughout the myocardium. The amplitude of the R wave in lead II may also be increased as a result of the increased muscle mass (van Loon & Patterson, 2010, McGurrin, 2011, McGurrin, 2015).
In the horse, the depolarization process differs from that described above because of the very widespread distribution of the Purkinje network (Bright & Marr, 2010; van Loon & Patterson, 2010; Gilmour & Moïse, 2015). The fibres extend throughout the myocardium, and ventricular activation takes place from multiple sites. The electromotive forces therefore tend to cancel each other out and, consequently, no wavefronts are formed (van Loon & Patterson, 2010).
Because the surface ECG represents the sum of the electromotive forces within the heart, the overall effect of the depolarization of most of the left and right ventricles on the ECG is minimal. Most electrical activity seen at the body surface results from depolarization of the basal interventricular septum and part of the left ventricular free-wall. A wavefront spreading towards the heart base is responsible for this last part of ventricular activation, so the cardiac vector is directed dorsally and cranially with respect to the body surface (van Loon & Patterson, 2010).
Frontal plane MEA, or the cardiac vector in the orthogonal systems are therefore of very limited value in horses. In addition, the duration of the QRS complex does not depend on the spread of a wavefront across the ventricles, and is therefore not necessarily related to their size (van Loon & Patterson, 2010). Equine ECGs still give useful information about heart rate and rhythm, but provide very little or no information about the relative or absolute sizes of the ventricles (McGurrin, 2011).
21
3. Ambulatory and exercise ECG
As mentioned before, some arrhythmias are not present at the time of electrocardiography, despite being obvious during physical examination, or may be suggested by a clinical history of intermittent reduction in cardiac output and not identified clinically. There are several reasons why the arrhythmia may not be detected at the time of recording a patient-side ECG, and may be related to changes in autonomic tone such that they only occur during exercise or during rest. In these situations 24-hour ambulatory ECG monitoring and telemetry can be very useful in order to document cardiac rate and rhythm at the times when clinical signs have been reported, such that a dysrhythmia may be reproduced (Durando, 2010; Bowen, 2014).
Therefore, an ambulatory ECG can be recorded for a brief period, or for a longer period while monitoring for less frequent dysrhythmias, and an exercise ECG can be recorded to assess the importance of certain dysrhythmias found at rest or exercise-induced, especially in horses with poor performance (Durando, 2010; Verheyen et al., 2010).
3.1 Equipment
The basic equipment consists of electrodes, a recording device and a way to display the trace. Self-adhesive electrodes are well tolerated by the horses, and significantly improve recording quality. Specific equine self-adhesive electrodes should be used as they contain more gel to improve skin contact and stronger glue to remain in place, even during exercise. Clipping of the hair coat is generally not necessary and even undesirable since it causes the electrodes to fall off more easily, especially with sweating. Extra gel can be used when the hair coat is very long, or extra glue in case of excessive sweating (Verheyen et al., 2010).
There is no universally accepted lead system for the use in large animals. Usually, a single-lead recording is sufficient (Verheyen et al., 2010; McGurrin, 2011; McGurrin, 2015). However, the advantage of a multiple lead system is that each lead detects the potential difference between its 2 electrodes from a unique angle, which might help to differentiate between a normal or abnormal complex. In addition, when one electrode falls off in a multiple-lead system, the recording can still continue from the remaining
22
electrodes. Whichever method is used, the procedure should be standardized so that ECGs can be compared (Verheyen et al., 2010).
Systems with 4 electrodes are most commonly used. In such a system, the black electrode serves as a reference electrode for the electrocardiogram, and can be positioned anywhere on the body surface of the horse. The remaining 3 electrodes are used to construct 3 leads: lead I between the red (right arm, -) and the yellow (left arm, +) electrode, lead II between the red (-) and the green (left foot, +) electrode, and lead III between the yellow (-) and the green (+) electrode. Although, these color conventions can vary depending on the country of origin. Modern devices will automatically record from all 3 leads at the same time, offering the advantages of a multiple-lead recording. Older devices might require a manual switch between each lead (Verheyen et al., 2010, Young & van Loon, 2014; McGurrin, 2015).
Any ECG device can be used for ambulatory recording, but a small battery-powered device fixed to the horse’s back allows to make recordings during exercise. The signal can then be digitally stored or wireless transmitted (telemetry) through radio-frequency or Bluetooth. Telemetry allows for beat-to-beat real-time monitoring and thus represents an advantage above other systems, allowing to assess the quality of the recording (while Holter devices cannot do this). When a device has sufficient storage capacity, long-term (24-hour ambulatory ECG monitoring, usually with Holter monitor) monitoring becomes possible (Verheyen et al., 2010; Durando, 2010; McGurrin, 2011; McGurrin, 2015). The recorded signals can be imported into computer software for the automatic analysis of normal and abnormal rhythms. The software detects R waves and screens for sudden irregularities in the R-R interval. Complex algorithms for the analysis of the QRS morphology exist in more advanced software packages designed for human or small animal cardiology. Although, these algorithms usually fail to interpret the horse’s ECG correctly, partly because of the large P and T wave on the equine ECG. Many systems indicate ‘bradycardia’ at the heart rates higher than the normal heart rate of a horse. Therefore, the visual screening of the horse’s ECG remains necessary (Verheyen et al., 2010; McGurrin, 2015).
Exercise or stress can cause changes in the P and T waves with no clinical meaning. With a systematic approach while evaluation the ECG recordings, the artefacts can easily be interpreted as so (Verheyen et al., 2010).