RESUMO.- [Eletrocardiograma normal de cabras Saanen clinicamente sadias.]O objetivo deste estudo foi de esta-belecer os valores de referência para o eletrocardiograma normal de derivação II de cabras Saanen sadias. As dura-ções totais (segundos) das amplitudes de P, Q, R, S e T foram 0.03±0.01, 0.02±0.005, 0.03±0.014, 0.03±0.011, 0.06±0.014, respectivamente, e os valores de referência foram 0.01-0.04, 0.01-0.02, 0.01-0.06, 0.02-0.04 e 0.04-0.08, respectivamen-te. As amplitudes (milivolts) dessas formas de onda foram
0.1±0.031, 0.06±0.023, 0.44±0.312, 0.39±0.434, 0.26±0.164 (T negativo) e 0.15±0.071 (T positivo), respectivamente. Os valores de referência foram 0.05-0.15, 0.05-0.1, 0.05-1.2, 0.05-1.1 e -0.2-0.7, respectivamente. As durações (segun-dos) dos intervalos PR e QT, do complexo QRS e do segmen-to ST foram 0.08±0.018, 0.26±0.03, 0.05±0.008, 0.15±0.041, respectivamente. Os valores de referência foram 0.06-0.12, 0.2-0.32, 0.04-0.07, e 0.11-0.26, respectivamente. Foi pos-sível observar diferenças em relação à duração e amplitu-de dos constituintes do ECG quando comparados com os resultados de outras raças. Portanto, torna-se necessário a realização de mais estudos para se permitir comparações, detectar e diagnosticar arritmias cardíacas bem como auxi-liar no desenvolvimento de terapias.
TERMOS DE INDEXAÇÃO: Cabras Saanen, eletrocardiograma, ECG.
INTRODUCTION
Electrocardiography is a noninvasive, inexpensive tech-nique that yields useful information in classification of
The normal electrocardiogram in the clinically healthy
Saanen goats
1Fabio C. Pogliani2*, Eduardo H. Birgel Junior3, Bruno M. Monteiro2, José H.H.
Grisi Filho4 and Raquel F.S. Raimondo2
ABSTRACT.- Pogliani F.C., Birgel Jr E.H., Monteiro B.M., Grisi Filho J.H.H. & Raimondo R.F.S. 2013. The normal electrocardiogram in the clinically healthy Saanen goats. Pesquisa Veterinária Brasileira 33(12):1478-1482. Departmento de Clínica Médica, Faculdade de Me-dicina Veterinária e Zootecnia, Universidade de São Paulo, Av. Prof. Dr. Orlando Marques de Paiva 87, São Paulo, SP 05508-270, Brazil. E-mail: [email protected]
The purpose of this study was to establish normal reference electrocardiographic (ECG) values for standard limb lead II in Saanen goats. For this, were used 19 healthy adult fe-male Saanen goats. And for reference values for the ECG parameters, were used 95% con-fidence level. The overall P, Q, R, S and T durations (seconds) were 0.03±0.01, 0.02±0.005, 0.03±0.014, 0.03±0.011, 0.06±0.014 respectively, and the reference values were 0.01-0.04, 0.01-0.02, 0.01-0.06, 0.02-0.04 and 0.04-0.08 respectively. The amplitudes (milivolts) of these waveforms were 0.1±0.031, 0.06±0.023, 0.44±0.312, 0.39±0.434, 0.26±0.164 (T negative) and 0.15±0.071 (T positive), respectively. The reference values were 0.05-0.15, 0.05-0.1, 0.05-1.2, 0.05-1.1 and -0.2-0.7 respectively. The PR and QT interval, the QRS com-plex and the ST segment durations (seconds) were 0.08±0.018, 0.26±0.03, 0.05±0.008, 0.15±0.041 respectively. The reference values were 0.06-0.12, 0.2-0.32, 0.04-0.07 and 0.11-0.26, respectively. It was possible to observe differences in ECG of Saanen goats regarding the amplitude and duration of the constituents when compared to the results of other bre-eds. Therefore it is necessary to conduct further studies to allow comparisons, detect and diagnose cardiac arrhythmias and help the development of therapies.
INDEX TERMS: Saanen goats, electrocardiogram, ECG.
1 Received on September 6, 2013.
Accepted for publication on November 28, 2013.
2 Departamento de Clínica Médica, Faculdade de Medicina Veterinária e Zootecnia (FMVZ), Universidade de São Paulo (USP), Av. Prof. Dr. Orlando Marques de Paiva 87, Cidade Universitária, São Paulo/SP 05508-270, Bra-zil. *Corrersponding author: [email protected]
3 Departamento de Medicina Veterinária, Faculdade de Zootecnia e En-genharia de Alimentos, USP, Av. Duque de Caxias Norte 225, Campus da USP, Pirassununga, SP 13635-900, Brasil.
arrhythmias, diagnosing conduction abnormalities and it also is a valuable aid in prognostic and therapeutic conside-rations (Fregin 1985). Small body size, easy availability and cheapness are advantages that make the goat more prefe-rable over other ruminants for biological research (Mohan et al. 2005). However, most of the literature on the elec-trocardiogram among domestic animals is related to dogs and horses (Mohan et al 2005) and the ECG has been rarely applied in caprine medicine (Smith & Sherman 2009). Few studies relate the process of ventricular activation (Hamlin et al. 1984), variability of QRS complex (Szabuniewicz & Clark 1967), values for few leads (Upadhyay & Sud 1977), ionophore toxicity (Howard 1993), fluoride intoxication (Kant et al. 2010), poisoning by oleander (Barbosa et al. 2008), ECG values for a specific breed (Mohan et al. 2005; Ahmed & Sanyal, 2008, Fakour et al. 2013) and with a spe-cific age (Montes et al. 1994), heart monitoring for phar -macology evaluation of drugs (Raina et al. 2008, Staffieri et al. 2009) and as an experimental model for the study of arrhythmias commonly found in humans such as atrial fi -brillation (Shan et al. 2004, 2010, Blaauw et al. 2007, Van Brakel et al. 2009, Verheule et al. 2010, Liu et al. 2012).
According to the breed, the variation among the size and form of the heart is expected to reflect in the ECG. Mohan et al. (2005) related differences between an ECG records from Jamunapari goats and the results from the literature and concluded that this might to be due to breed differen-ces in the goats. Besides this, Szabuniewicz & Clark (1967) measured the mean amplitudes for various leads in one hundred male goats, with no specific breed described, and concluded that minimal differences occur between various leads, with high variation in the shape of the QRS complex within and between different leads, and the amplitude of ECG deflections are small in the goat.
Sinus arrhythmia is a common arrhythmia described in adult goats (Szabuniewicz & Clark 1967, Pugh 2002, Smith & Sherman 2009) as well as a sinus tachycardia in neonatal goats, wich is considered a physiological condition (Matos et al. 1994). A second degree A-V block was related (Sza-buniewicz & Clark 1967, Barbosa et al. 2008) but a lack of normal reference values and electrocardiographic patterns in healthy goats, and for a specific breed, could lead to failu -re in detection of others arrhythmias or heart injuries.
If minimal differences occur between various leads, and the ECG of goat indicates an existence of variability among goat breeds, the purpose of this study was to establish nor-mal reference ECG values for standard limb lead II in Saa-nen goats.
MATERIALS AND METHODS
All experimental procedures were performed in accordance with the ethical standards and animal care utilization (Protocol no.1093/2007).
A total of 19 adult female Saanen goats weighing between 30 and 63 kg, aged between 1 and 5 years, non-pregnant, reared in the Centro de Pesquisa e Diagnóstico de Enfermidades de Rumi-nantes (Ruminants Diseases Research and Diagnostic Centre) of this University, attached to the Faculty of Veterinary Medicine and Animal Science, were selected for the study. All animals
recei-ved a total daily ration, which composed of coast-cross (Cynodon dactylon) hay and commercial concentrate and had free access to water. Prior to the experiment, blood samples were collected to determine the packed cell volume and serum total protein. All animals showed no clinical manifestations of parasite infections and anemia. Auscultation was performed and all the animals were free of cardiac murmurs.
The ECG recordings were made in right lateral recumbent position using single channel electrocardiograph (TEB ECG C10, Brazil), with a 50 mm/s paper speed and a sensitivity of 10 mm/ mV. The forelimbs were kept parallel to each other and perpen-dicular to the long axis of the body, then four alligator clip
elec-trodes were fixed directly to the skin, just above the elbow joint in the forelimb, and just above the stifle joint in the hind limb,
as described earlier by Szabuniewicz & Clark (1967). Alcohol was used to obtain good clip-to-skin contact. The standard bipolar (I, II and III) and augmented bipolar limb leads (aVR, aVL and aVF) were recorded. The heart rate, the amplitude (millivolts) of P, Q, R, S and T waveforms, the duration (seconds) of P, Q, R, S and T wa-veforms and PR and QT intervals, QRS complex, and ST segment
were manually measured on five cardiac cycles from the electro
-cardiographic records.
The mean electrical axis of the QRS complex was calculated from the hexaxial reference system on the frontal plane (Tilley 1992).
Mean and standard deviation (SD) were calculated for each parameter. The interpretation and measured parameters from the ECG recordings were performed according to Tilley (1992). We
calculated the approximate 95% confidence interval (non-conser
-vative) for the upper and lower limits of the reference range for each parameter. This statistical analysis was made with the Stats-Direct Statistical Software version 2.7.7 (StatsStats-Direct Ltd).
RESULTS
The mean heart rate in the goats studied was 129.42±21.55 beats per minute (bpm) and ranged between 94 and 154bpm. Most of the animals presented a normal sinus rhythm (89.47%), while sinus arrhythmia was evident in 10.53% of the tracings, corresponding to two goats. The mean electrical axis of the heart was between 60 and 90 de-grees. There was a wide range (-180 to +180) in the orien-tation of the mean electrical axis among the goats.
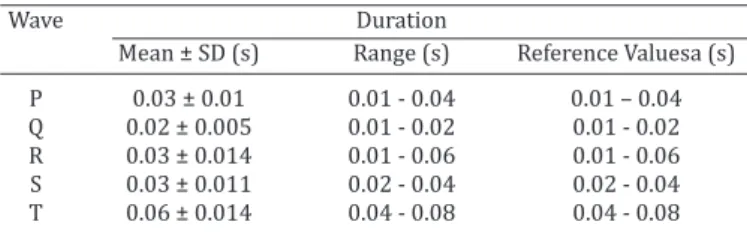
The results obtained from the different electrocardio-graphic waves and their reference values are shown in Ta-ble 1 and TaTa-ble 2 for the standard limb II lead waveforms.
The lead II P wave duration was 0.03s ±0.01 and ranged between 0.01s and 0.04s. The P wave was oriented in the positive direction, bifid P wave was evident in 10.52%, and showed no biphasic pattern. Wandering pacemaker was present in all tracings on lead II, with P wave morphologic alterations in duration and amplitude. The P wave
amplitu-Table 1. Duration and reference values of waves for lead II in Saanen goats
Wave Duration
Mean ± SD (s) Range (s) Reference Valuesa (s)
P 0.03 ± 0.01 0.01 - 0.04 0.01 – 0.04 Q 0.02 ± 0.005 0.01 - 0.02 0.01 - 0.02 R 0.03 ± 0.014 0.01 - 0.06 0.01 - 0.06 S 0.03 ± 0.011 0.02 - 0.04 0.02 - 0.04 T 0.06 ± 0.014 0.04 - 0.08 0.04 - 0.08
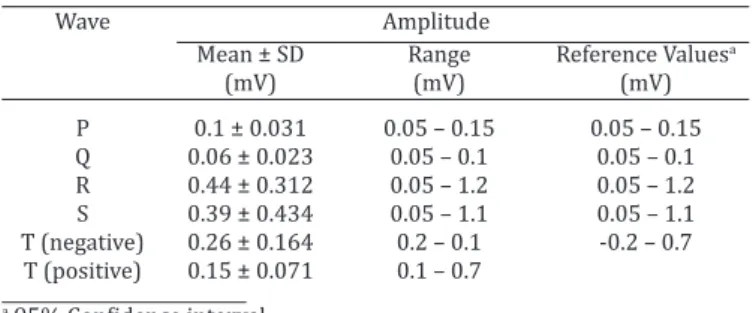
de was 0.1 mV ±0.031 and ranged from 0.05mV to 0.15mV on lead II. The P wave reference values were the same as the range interval.
The lead II R wave was present in all the tracings. Most of the animals presented a lead II Q wave (73.68%) while the S wave was found in 26.32% of the lead II electrocar-diographic records.
The duration and amplitude of lead II Q wave were 0.02s ±0.005 and 0.06mV ±0.023 and ranged from 0.01s to 0.02s and 0.05mV to 0.1mV, respectively. The duration and amplitude of lead II R wave were 0.03s ±0.014 and 0.44mV ±0.312 and ranged from 0.01s to 0.06s and 0.05mV to 1.2mV, respectively. The range of lead II S wave duration was from 0.02s to 0.04s and 0.05mV to 1.1mV in amplitude. The S wave results for lead II electrocardiographic records was 0.03s ±0.011 and 0.39mV ±0.434 for duration and am-plitude, respectively. The Q, R and S reference values were the same as the range interval.
Different types of QRS complexes were found in lead II. The most frequent configuration was qR (47.36%), while QR (21.05%), rS (21.05%), R (5.26%), and qRs (5.26%) were less evident. The QS configuration did not appear in the electrocardiographic records. The QRS complex length range was from 0.04s to 0.08s having duration of 0.05s ± 0.008 on lead II tracings (Table 3). The QRS com-plex duration reference value was the same as the range interval.
In the lead II configuration of T wave, the positive sha -pe was the most frequent (89.47%), and the negative sha-pe was found in only 10.53% of the electrocardiographic records. No biphasic lead II configuration of T wave was found in this study. The range of T wave duration was from 0.04 to 0.08, and the range of T wave amplitude was from 0.1 to 0.7mV for positive and 0.1 to 0.2mV for negative T wave configuration on lead II. The T wave reference values were the same as the range interval.
The results and the reference values of the intervals PR and QT, and ST segment for lead II ECG records observed throughout the experiment are given in Table 3. The PR interval duration range in lead II was from 0.06s to 0.12s and the PR interval value was 0.08s ±0.018. The QT inter-val duration range was between 0.22s to 0.32s, and the QT interval value was 0.26s ±0.03 on lead II. The ST segment duration range in lead II was from 0.11s to 0.26s, and the ST segment value was 0.15s ±0.041. The ST segment was isoelectric in the study. The PR, QT, and ST duration refe-rence values were the same as the range interval.
DISCUSSION
To our knowledge, this is the first description of Saanen goats ECG parameters in the veterinary literature. There-fore, we could only use our results to compare them with a limited number of researches, with goats without specific breed (Szabuniewicz & Clark 1967) and with Jamunapari goats (Mohan et al. 2005), Black Bengal goats (Ahmed & Sanyal 2008), Kagani goats (Raina et al. 2008) and Markhoz goats (Fakour et al. 2013). Montes et al. (1994) studied the ECG parameters in Murciano-Granadina goats, however, were evaluated the influence of age in those values by using animals with 1-30 days old.
The lateral recumbent position when compared with standing position did not influence the ECG records (Szabu -niewicz & Clark 1967). Therefore, discussion can be made among studies with different positions for ECG records.
The heart rates ranged from 94 and 154 bpm with a mean rate of 129.42±21.55 bpm which were similar to tho-se obtained by Mohan et al. (2005) for Jamunapari goats (127±3.46 bpm) but higher than those observed by Sza-buniewicz & Clark (1967) for cross-bred goats (96 bpm), Ahmed & Sanyal (2008) for Black Bengal goats (101±2.6 bpm), Kant et al. (2010) for cross-bred goats (90±2.45 bpm and 82.5±4.98 bpm) and Fakour et al. (2013) for Markhoz goats (110±2.38 bpm). As stated by Mohan et al. (2005), this might be due to breed difference in the goats studied. When compared to younger animals, the mean heart rate found for adult Saanen goats was lower than Murciano--Granadina kids with one (258±4.59 bpm) and 30 days old (176±4.32 bpm) as described by Matos et al. (1994).
Although sinus arrhythmia was present in 10.53% of the animals, this is considered a related common characteristic and as a respiration-heart rate response (Szabuniewicz & Clark 1967, Pugh 2002, Smith & Sherman 2009), indicating a specific vagal influence on the sinus node (Szabuniewicz & Clark 1967).
The mean electrical axis was oriented between 60 and 90 degrees with a wide range (-180o to +180o) observed.
Likewise, a wide range among goats was reported by Mo-han et al. (2005) for Jamunapari goats (+7.5o to +58.5o) and
Ahmed & Sanyal (2008) for Black Bengal goats (-166o to
+168o). Changes in electrical axis were no significant to
monitor fluorine intoxication (Kant et al. 2010) and show no significant alteration in goats treated with tramadol (Raina et al. 2008). Even in conditions with induced he-art failure, such as poisoning by oleander (Barbosa et al. 2008), the electrical axis didn´t show significant changes. Table 2. Amplitude and reference values of waves for lead II
in Saanen goats
Wave Amplitude
Mean ± SD Range Reference Valuesa
(mV) (mV) (mV)
P 0.1 ± 0.031 0.05 – 0.15 0.05 – 0.15 Q 0.06 ± 0.023 0.05 – 0.1 0.05 – 0.1 R 0.44 ± 0.312 0.05 – 1.2 0.05 – 1.2 S 0.39 ± 0.434 0.05 – 1.1 0.05 – 1.1 T (negative) 0.26 ± 0.164 0.2 – 0.1 -0.2 – 0.7 T (positive) 0.15 ± 0.071 0.1 – 0.7
a 95% Confidence interval.
Table 3. PR and QT interval, QRS complex and ST segment durations and reference values for lead II in Saanen goats
Duration
Mean ± SD (s) Range (s) Reference Valuesa (s)
PR interval 0.08 ± 0.018 0.06 – 0.12 0.06 – 0.12 QRS 0.05 ± 0.008 0.04 – 0.08 0.04 – 0.08 QT interval 0.26 ± 0.03 0.22 – 0.32 0.2 – 0.32 ST segment 0.15 ± 0.041 0.11 – 0.26 0.11 – 0.26
However, kids at different ages showed alterations in the mean electrical axis with statistical differences between one (173±3.35 degrees) and 30 days old (158±4.96 de-gress), corresponding to a physiological condition determi-ned by the left ventricle development (Matos et al. 1994). Probably, in the pathological cited conditions, the wide ran-ge of the electrical axis influenced the results, presenting no differences and, according to Hamlin et al. (1984) and Pugh (2002), because the Purkinje fibers anatomy in the ruminant, vectorcardiography is of limited clinical value in goats. Therefore, it’s possible to suggest that electrical axis may not have a good clinical value to monitor pathological heart alterations in goats.
The P voltage in lead II was oriented in the positive direction and the mean value was almost similar to tho-se obtained by Szabuniewicz & Clark (1967) and Mohan et al. (2005) but higher than observed in the studies for Murciano-Granadina kids (Matos et al. 1994), Black Bengal goats (Ahmed & Sanyal, 2008), Kagani goats (Raina et al. 2008), cross-bred goats (Kant et al. 2010) and Markhoz go-ats (Fakour et al. 2013). These reported mean values could be classified as normal if we assume the reference values for adult Saanen goats. No negative P wave was found, ra-ther than Ahmed & Sanyal (2008) for Black Bengal goats, wich 18,75% of the animals presented the negative form indicating that the impulse was generated from de AV junc-tion as a juncjunc-tional premature complex (Ahmed & Sanyal, 2008). The P duration reference range for Saanen goats did not support the mean value determined by Matos et al. (1994), Mohan et al. (2005), Ahmed & Sanyal (2008) and Raina et al. (2008), but was also almost similar to Kant et al. (2010) and Fakour et al. (2013). The morphologic alte-rations presented in all P waveforms induced by wandering pacemaker were supported by Pugh (2002) and Smith & Sherman (2009) and the differences among determined P values might to be due to breed difference in the goats stu-died (Mohan et al. 2005).
The shape of QRS complex is quite variable within and between the different leads in goats (Mohan et al. 2005). Therefore, breed differences were expected when compa-ring the configurations of QRS complexes with those obser -ved by Szabuniewicz & Clark (1967), Matos et al. (1994), Mohan et al. (2005), Ahmed & Sanyal (2008), Raina et al. (2008), Kant et al. (2010) and Fakour et al. (2013). While QS, rS, RS, Rs, qRs, and R patterns, among others, were the most observed in lead II by Szabuniewicz & Clark (1967), QS and Qr patterns were observed by Matos et al. (1994) for kids and qR, QR, rS, R and qRs patterns were the most observed in the lead II ECG records for Saanen goats. Accor-ding to our finAccor-dings and other studies, this variability in the QRS complexes might be due to the differences in the to-pographic anatomy of the heart within the thorax, position of heart in relation to the limbs (J. E. Breazile 1971) and mechanism of ventricles activation (Hamlin et al. 1984). Because of this, Szabuniewicz & Clark (1967) were able to conclude: the characterization of the QRS complex pattern in the normal ECG for goats would be meaningless.
The T wave positive shape was the most frequent ob-served for lead II ECG records, and the mean T wave
am-plitude was similar to the mean values presented by Ma-tos et al. (1994), Ahmed & Sanyal (2008), and by Fakour et al. (2013), for Murciano-Granadina, Black Bengal and Markhoz goats, respectively; higher than the mean values found by Szabuniewicz & Clark (1967), Mohan et al (2005), and Raina et al. (2008) for cross-bred, Jamunapari and Ka-gani goats, respectively; and lower than the values found by Kant et al. (2010) for cross-bred goats.
The mean T wave duration was higher than Matos et al. (1994) and Fakour et al. (2013), and lower than Mohan et al. (2005), Ahmed & Sanyal (2008), Raina et al. (2008) and similar to Kant et al. (2010).
Few studies were performed to report the values of the ECG intervals from healthy goats: Szabuniewicz & Clark (1967), PR and QT, cross-bred goats; Mohan et al. (2005), PR, RR and QT, Jamunapari goats; Ahmed & Sanyal (2008), PR and ST, Black Bengal goats; Raina et al. (2008), PR, ST and QT, Kagani goats; Kant et al. (2010), PR, QT and ST, cross-bred goats; and Fakour et al. (2013), PQ and QT, Ma -rkhoz goats. The PR interval was present in 100% (6/6) of the studies, being the most evaluated interval among all, followed by QT (83%, 5/6), ST (50%, 3/6) and RR (16,6%, 1/6). Only one study describing segments was found: Ma-tos et al. (1994), PQ, ST and QT, for Murciano-Granadina kids.
Such as the differences found among the values from QRS complexes, different values were found for the inter-vals and segments among the literature. The lead II PR in-terval value from Mohan et al. (2005) is similar to our re-sult and is within our reference values interval. The mean values found for PR interval of Saanen goats were lower than the results reported by Szabuniewicz & Clark (1967), Ahmed & Sanyal (2008), Raina et al. (2008), Kant et al. (2010) and Fakour et al. (2013) and higher than the results reported by Matos et al.(1994) for kids.
The lead II QT interval was similar to the mean values found by Mohan et al. (2005) and Fakour et al. (2013). Among the reported studies, Szabuniewicz & Clark (1967), Raina et al. (2008) and Kant et al. (2010) found higher values. However, Matos et al. (1994) found a lower mean value, but they measured the QT segment instead the QT interval, being, as expected, a lower value when the compa-risons were made.
Different values were also expected and found when the results of the lead II ST segment were compared to Ahmed & Sanyal (2008), Raina et al. (2008) and Kant et al. (2010), which determined the lead II ST intervals, therefore, the segment mean value was lower than the intervals mean va-lues. Matos et al. (1994) reported lower mean values for ST segment in Murciano-Granadina kids and concluded that the ST segment and PR and QT intervals of kids were higher according to their ages, being resulted of the physiological decrease in heart rate. According to their conclusion, our results and the literature, these intervals and segment con-tinue to increase as they become adults.
present study support the data from Mohan et al. (2005). More comparisons of our data are difficult to make since no previous published data for Saanen goats or others breeds have been found.
CONCLUSIONS
According to the results of this research, we suggest, based on the confidence interval, the use of the following reference values for the lead II ECG of Saanen goats: P wave amplitude - between 0.05 and 0.15mV; Q wave amplitude - between 0.05 and 0.1mV; R wave amplitude - between 0.05 and 1.2mV; S wave amplitude - between 0.05 and 1.1mV; T wave amplitude - between -0.2 and 0.7mV; P wave dura -tion - between 0.01 and 0.04s; Q wave dura-tion - between 0.01 and 0.02s; R wave duration - between 0.01 and 0.06s; S wave duration - between 0.02 and 0.04s; T wave duration - between 0.04 and 0.08s; QRS complex - between 0.04 and 0.08; PR interval - between 0.06 and 0.12s; QT interval - be -tween 0.2 and 0.32s; ST segment - be-tween 0.11 and 0.26s. The results of the present study could lead us to con-clude that the some values for the ECG of Saanen goats di-ffer from that of other breeds previously reported. Further studies are necessary to establish reference values in order to allow comparisons among different breeds and to detect and diagnostic heart arrhythmias and for therapeutic deve-lopment in goats.
Acknowledgements.- Eduardo H. Birgel Junior and Fabio C. Pogliani thank FAPESP for their fellowships. This research was supported by FA-PESP (Process no. 2007/05785-5).
REFERENCES
Ahmed J.A. & Sanyal S. 2008. Electrocardiographic studies in Garol sheep and Black Bengal goats. Res. J. Cardiol 1:1-8.
Barbosa R.R., Fontenele-Neto J.D. & Soto-Blanco B. 2008. Toxicity in goats caused by oleander (Nerium oleander). Res. Vet. Sci. 85:279-281. Blaauw Y., Schotten U., Van Hunnik A., Neuberger H.R. & Allessie M.A.
2007. Cardioversion of persistent atrial fibrillation by a combination of atrial specific and non-specific class III drugs in the goat. Cardiovasc.
Res. 75:89-98.
Breazile J.E. 1971. Textbook of Veterinary Physiology. Lea and Febiger, Philadelphia, p.241-251.
Fakour Sh., Mokhber Dezfuli M.R., Nadalian M.G., Rezakhani A. & Lotfollah Zadeh S. 2013. Electrocardiographic parameters of Markhoz goat using base apex lead and six standard limb leads. Iranian J. Vet. Res. 14:241-244.
Fregin F.G. 1985. Electrocardiography. Vet. Clin. North Am., Equine Pract. 1:419-432.
Hamlin R.L., Glower D.D.J. & Pimmel R.L. 1984. Genesis of QRS in the rumi-nant: graphic stimulation. Am. J. Vet. Res. 45:938-941.
Howard J.L. 1993. Current Veterinary Therapy: food animal practice. W.B. Saunders, Philadelphia. 966p.
Kant V., Srivastava A.K., Verma P.K., Raina R. & Pankaj N.K. 2010. Altera-tions in electrocardiographic parameters after subacute exposure of
fluoride and ameliorative action of aluminium sulphate in goats. Biol.
Trace Elem. Res. 134:188-194.
Liu J., Wang Y., Shan Z. & Guo H. 2012. Influence of acute stress on cardiac
electrophysiological stability in male goats. Acta Cardiol. 67:325-330. Montes A.M., Bernal L.J., Bayon A., Fernandez del Palacio M.J., Sotillo J.,
Aya-la I. & Trenti F. 1994. A study of ECG in goats. Proc. 18th World Buiatrics Congress, Italy, p.1201-1024.
Mohan N.H., Niyogi D. & Singh H.N. 2005. Analysis of normal electrocardio-grams of Jamunapari goats. J. Vet. Sci. 6:295-298.
Pugh D.G. 2002. Sheep and Goat Medicine. W.B. Saunders, Philadelphia, p.393-404.
Raina R., Verma P.K., Pankaj N.K., Prawez S. & Srivastava A.K. 2008. Effects of tramadol on electrocardiogram, mean electrical axis and respiration in kagani goats (Capra hircus). Iran. J. Pharmacol. Ther. 7:157-160. Shan Z.L., Van der Voort P.H., Blaauw Y., Duytschaever M. & Allessie M.
2004. Fractionation of electrograms and linking of activation during
pharmacologic cardioversion of persistent atrial fibrillation in the goat.
J. Cardiovasc. Electrophysiol. 15:572-580.
Shan Z.L., Yan J.J., Zhou J.Y., Shi X.M., Guo J.P., Yuan H.T., Allessie M. & Wang Y.T. 2010. Role of progressive widening of the temporal excitable gap for
perpetuation of atrial fibrillation in the goat. Circ. J. 74:655-663.
Smith M.C. & Sherman D.M. 2009. Goat Medicine. Wiley-Blackwell, Iowa, p.319-338
Staffieri F., Driessen B., Lacitignola L. & Crovace A. 2009. A comparison of
subarachnoid buprenorphine or xylazine as an adjunct to lidocaine for analgesia in goats. Vet. Anaesth. Analg. 36:502-511.
Szabuniewicz M. & Clark D.R. 1967. Analysis of the electrocardiograms of 100 normal goats. Am. J. Vet. Res. 28:511-516.
Tilley L.P. 1992. Essentials of Canine and Feline Electrocardiography. Lea and Febiger, Philadelphia. 470p.
Upadhyay R.C. & Sud S.C. 1977. Electrocardiogram of the goat. Ind. J. Exp. Biol. 15:359-362.
Van Brakel T.J., Hermans J.J.R., Accord R.E., Schotten U., Smits J.F.M.,
Alles-sie M.A. & Maessen J.G. 2009. Effects of intrapericardial sotalol and fle
-cainide on transmural atrial electrophysiology and atrial fibrillation. J.
Cardiovasc. Electrophysiol. 20:207-215.
Verheule S., Tuyls E., Van Hunnik A., Kuiper M., Schotten U. & Allessie M. 2010. Fibrillatory conduction in the atrial free walls of goats in
persis-tent and permanent atrial fibrillation. Circ. Arrhythm. Electrophysiol.